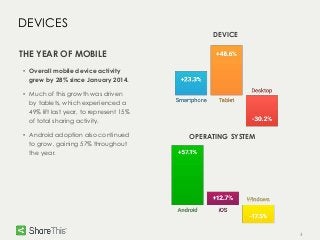
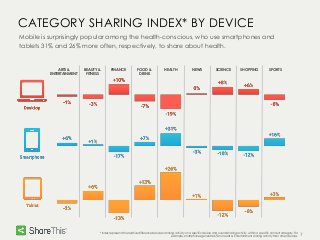
SHARETHIS
Q4 2014 Consumer Sharing
Trends Report
2
SOCIAL CHANNELS
FACEBOOK CONTINUES
TO DOMINATE
• 81% of all shares were on
Facebook this quarter.
• Since January, Facebook has
added 8.2% to it’s share of total
social activity.
• Email activity also gained –
however, email sharing still only
represented about 1% of total
volume.
SOCIAL CHANNELS ANNUAL CHANGE
3
DEVICES
THE YEAR OF MOBILE
• Overall mobile device activity
grew by 28% since January 2014.
• Much of this growth was driven
by tablets, which experienced a
49% lift last year, to represent 15%
of total sharing activity.
• Android adoption also continued
to grow, gaining 57% throughout
the year.
DEVICE
OPERATING SYSTEM
4
DEVICES
MOBILE DRIVES MORE THAN
HALF OF SOCIAL
• As of December 2014, mobile devices
overtook desktop to generate roughly
66% of browsing and sharing activity on
our network (compared to 50% in early
2014).
• People are generally more inclined to
share on their mobile devices; sharing
represents 19% of total activity within
mobile devices, compared to only 6%
within desktop environments. Mobile
engagement has nearly doubled since
the beginning of 2014.
• iPhone and iPad users tend to be the
most social, while Windows Mobile users
tend to favor browsing on their devices
rather than sharing.
SOCIAL RATE
SHARING BY DEVICE
(sharing activity as % of total activity)
5
SOCIAL CHANNELS ON MOBILE
ON MOBILE, TWEETS & PINS
THRIVE
• On mobile, 85% of activity
happens on Facebook, up 51%
from last year.
• Desktop is less Facebook
dominant; the social channel
represents 74% of activity.
SHARING BY DEVICE
DESKTOP MOBILE
JAN DECFEB MAR APR MAY JUNE JULY AUG SEPT OCT NOV
6
CATEGORY SHARING INDEX* BY CHANNEL
Sports is the dominant conversation driver among twitter users, while beauty, food, and
shopping all over-index on Pinterest.
BEAUTY &
FITNESS
ARTS &
ENTERTAINMENT
FINANCE FOOD &
DRINK
HEALTH NEWS SCIENCE SHOPPING SPORTS
*Index represents the relative difference between sharing activity on a specific social channel and overall sharing activity, within a
specific content category. For example, Twitter generates 5% more Arts & Entertainment sharing activity than other channels.
7
CATEGORY SHARING INDEX* BY DEVICE
Mobile is surprisingly popular among the health-conscious, who use smartphones and
tablets 31% and 26% more often, respectively, to share about health.
*Index represents the relative difference between sharing activity on a specific device and overall sharing activity, within a specific content category. For
example, smartphones generate 6% more Arts & Entertainment sharing activity than other devices.
BEAUTY &
FITNESS
ARTS &
ENTERTAINMENT
FINANCE FOOD &
DRINK
HEALTH NEWS SCIENCE SHOPPING SPORTS
THANK YOU

Q4 2014 Consumer Sharing Trends Report

  • 1.
    SHARETHIS Q4 2014 ConsumerSharing Trends Report
  • 2.
    2 SOCIAL CHANNELS FACEBOOK CONTINUES TODOMINATE • 81% of all shares were on Facebook this quarter. • Since January, Facebook has added 8.2% to it’s share of total social activity. • Email activity also gained – however, email sharing still only represented about 1% of total volume. SOCIAL CHANNELS ANNUAL CHANGE
  • 3.
    3 DEVICES THE YEAR OFMOBILE • Overall mobile device activity grew by 28% since January 2014. • Much of this growth was driven by tablets, which experienced a 49% lift last year, to represent 15% of total sharing activity. • Android adoption also continued to grow, gaining 57% throughout the year. DEVICE OPERATING SYSTEM
  • 4.
    4 DEVICES MOBILE DRIVES MORETHAN HALF OF SOCIAL • As of December 2014, mobile devices overtook desktop to generate roughly 66% of browsing and sharing activity on our network (compared to 50% in early 2014). • People are generally more inclined to share on their mobile devices; sharing represents 19% of total activity within mobile devices, compared to only 6% within desktop environments. Mobile engagement has nearly doubled since the beginning of 2014. • iPhone and iPad users tend to be the most social, while Windows Mobile users tend to favor browsing on their devices rather than sharing. SOCIAL RATE SHARING BY DEVICE (sharing activity as % of total activity)
  • 5.
    5 SOCIAL CHANNELS ONMOBILE ON MOBILE, TWEETS & PINS THRIVE • On mobile, 85% of activity happens on Facebook, up 51% from last year. • Desktop is less Facebook dominant; the social channel represents 74% of activity. SHARING BY DEVICE DESKTOP MOBILE JAN DECFEB MAR APR MAY JUNE JULY AUG SEPT OCT NOV
  • 6.
    6 CATEGORY SHARING INDEX*BY CHANNEL Sports is the dominant conversation driver among twitter users, while beauty, food, and shopping all over-index on Pinterest. BEAUTY & FITNESS ARTS & ENTERTAINMENT FINANCE FOOD & DRINK HEALTH NEWS SCIENCE SHOPPING SPORTS *Index represents the relative difference between sharing activity on a specific social channel and overall sharing activity, within a specific content category. For example, Twitter generates 5% more Arts & Entertainment sharing activity than other channels.
  • 7.
    7 CATEGORY SHARING INDEX*BY DEVICE Mobile is surprisingly popular among the health-conscious, who use smartphones and tablets 31% and 26% more often, respectively, to share about health. *Index represents the relative difference between sharing activity on a specific device and overall sharing activity, within a specific content category. For example, smartphones generate 6% more Arts & Entertainment sharing activity than other devices. BEAUTY & FITNESS ARTS & ENTERTAINMENT FINANCE FOOD & DRINK HEALTH NEWS SCIENCE SHOPPING SPORTS
  • 8.