Equities, interest rates, energy, commodities and currencies have become more correlated in their movements in recent years. This lack of diversification increases volatility and risk for portfolios. The document discusses how quantitative easing policies have caused liquidity to spread beyond domestic markets, influencing commodity prices globally and reducing benefits from diversification across asset classes.
(INDIRA) Call Girl Mumbai Call Now 8250077686 Mumbai Escorts 24x7
Commodity Wealth Creation
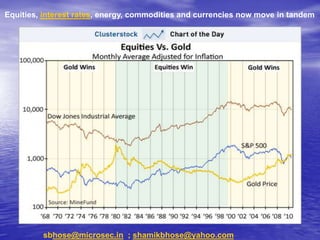
1. Equities, interest rates, energy, commodities and currencies now move in tandem
sbhose@microsec.in ; shamikbhose@yahoo.com
2. Gold will hit $1,650 before the end of the year) (the green line in the chart
below) has held; gold is in a nice channel; we have broken out to new highs; and
mid-March to the end of May is often a strong time of year for gold as is August
to November since 2005 .
This has been falling since 2000, when the Dow was incredibly expensive against
gold. In 1980 methinks that ratio is eventually falling back to 1:1. So, if the Dow
is at 10,000, so will gold be at $10,000. I’m slightly more conservative than that.
But here’s my simplification of his stepping-down pattern:
4. Recent gold versus Dow behaviour suggest that even during periods of stock
market volatility gold has continued to have a relatively smoother journey
upwards and the ratio can get much higher in favour of gold when the blow-
out phase occurs.... The benefits of diversification are thus destroyed and
the volatility of once low-risk portfolios greatly increases. looking further a
field to alternate assets ;
5. These prices have been also influenced by weaker & cheaper cost of money as Fed
monetized debt and flooded the system -- QE 1 ; QE 2 has seeped out to influence
commodity prices = most obvious manifestation is the lack of diversification, fat tail risk!!
The Query for 2011 --* Risk on Risk off + Inverted yield curve + Year Ending Comments
Looking back at -- Fat Tail Risk + Bubbles
6. Consumption: 70% of the US economy is driven by consumption. This in
turn accounts for 20% of the worlds consumption i.e. 5% of the world's
population accounts for 20% of its consumption.
Talk about an imbalance! Savings: The US finances its consumption by borrowing from the
Chinese, Japanese, Mid-East etc.. because they save.... One more area of deep significance is the
45% of GDP is exports for the Asian tigers , that means they are not de-coupled at all with USA in
fact they are anything but given how badly American consumer and consumer credit drives
demand there and how much a tiger like China needs that export market.
7. Risk trades will test investors through 2011
Correlations have continued to increase despite falls in individual asset volatility
U.S. government debt is now over $13.7 trillion (not including estimated
states' debt of $2.8 trillion and agencies' debt of $3.0 trillion). The
average rollover period for the debt is 49 months. With recent deficits
running over $1 trillion a year, the Treasury issues new debt and refunds
old debt at a rate of about $4.3 trillion a year.
A nation needs to inspire a lot of confidence to keep that Ponzi scheme
alive. Unfortunately, markets know that even the U.S. government will
print money to meet expenses when necessary.This leads to the
question, being asked from Beijing to Brussels: Does the risk match the
reward? A negative response to that question could lead to
hyperinflation.
Gold trading at more than $1,440 an ounce, despite no appreciable
increase in the consumer price index, is much more understandable
when you realize that in periods of hyperinflation , gold tends to
appreciate by 2,000% to 50,000% against a hyper-inflated currency.
8. The Lessons Of History
Quantitative easing hasn’t worked for Japan. If it’s going to work in the
U.S., capital controls may be inevitable. The Fed must stop the seepage
of liquidity overseas. It makes no sense for the Fed to take such
monumental risks with its balance sheet if America isn’t reaping the
benefits.
9. Here we see the US dollar index, which shows the dollar against a basket of
foreign currencies.
10. In Bear Market 4 stages -- stage 1: leverage killed
Stage 2: denial: market goes into a quite zone
Stage 3: realisation and pessimism & poison gets flushed out…
Stage 4: abject fear… which creates the base for the next bull market to
germinate…
13. Another week, another new high in gold and silver. The inexorable rise continued
with gold breaking out to new all-time highs at $ xxxx per ounce. It’s now in
positive territory for the year; But here’s the action that surprised me: gold was up
in the face of falling stock markets…and a ranged dollar index
Shamik Bhose
sbhose@microsec.in ; shamikbhose@yahoo.com
15. The best way to play a bull market –buy at the right time and then just sit
tight
I have always said that of all the metals silver has the most potential. There is its
monetary appeal. As a precious metal, investors are seeking it out because of its
increasing value at a time where governments are debasing their currencies. And there
is its industrial appeal. It is finding more and more uses each year in industries that,
recession or no recession, are growing. I’m talking particularly about its use in electrical
and medical applications. Meanwhile there is an ever-increasing supply deficit. Share-
lynx has charted this:
16.
17. Share-lynx says: “Note that since 1950, almost 925,000 tonnes have gone into demand
with 570,000 tonnes of this having come from production. This leaves a shortfall of
350,000 tonnes, which has come from central bank sales, stockpiles and scrap. This
deficit equals approximately 16 years of production”. The scrap is running out.
Meanwhile, on the futures exchanges, there seems to be a genuine supply squeeze which
is pushing prices higher and higher. And since one of the bigger sellers, JP Morgan,
announced the closure of its prop trading desks in late August, the price has catapulted
higher.
18. One day silver, much as it did in 1980, is going to rise higher than your wildest
dreams. (That $50 number from 1980, is somewhere north of $200 in today’s
money.)
22. Nomura set the bar pretty high with a warning that $220 a barrel might even
be overly-conservative should production in Libya and Algeria shut down
altogether. In 2007 Goldman had predicted a 150 $ per barrel of WTI crude
price for 2010 only to see 147$ in 2008
23. To sum up his point, Libya has plenty of oil money and should have been able to
bribe its citizens into submission. But they decided they want freedom instead.
And if “that is the case with Libya, which has a comparable ratio of income to
population to Saudi Arabia, one might worry more about the stability of Saudi Arabia,
which is of course the big one”. That’s an understatement.
24. A New Superabundance of Game-Changing Shale Gas Will Provide 250 Years of
Natural Gas A few years ago the United States was ready to import gas. In 2009 it had
become the world's biggest gas producer.
The U.S. achieved the change through a technological breakthrough in which firms
found a way of using tiny explosions to free gas previously trapped in a common rock
- shale.
Tactically this makes Americans less dependent on Middle East and Suez Canal and it
also means over time as this plays out – the dollar will regain traction vis-à-vis other
currencies............
25. 60990456, 60990522, 60990205 1750
1700
1650
1600
1550
A substantial tonnage of 1500
1450
corn has been used as 1400
ethanol bio-fuel in USA 1350
1300
with the help of generous 1250
1200
subsidies and green lobby 1150
1100
media campaigns; this has 1050
raised an ethical debate – 1000
950
if food should be diverted 900
850
with subsidy to become 800
750
fuels as crop shortages 700
and inflations have created 650
600
SOYBEAN
riots and surging grain 550
500
prices have been helped 450
along with the Fed’s cheap WHEAT
400
350
and easy money policies 300
250
200
CORN
150
100
50
1991 1992 1993 1994 1995 1996 1997 1998 1999 2000 2001 2002 2003 2004 2005 2006 2007 2008 2009 2010 2011
Attracted by these high prices farmers in USA have planted huge crops but weather
has been truant ; substantial Chinese and Russian demands as dollar has been weak
has added to price rise along with massive hedge fund and index fund participation.
All these connections are not linear though
26. Raw sugar and white sugar prices have been strong and getting higher as
crop shortages and demand have both played a part in the rally as has higher
crude oil prices as many countries notably Brazil uses sugar ethanol to fire
up flexi-fuel cars
SUG AR 11 CO NT INUOUS 112000 LBS [NY CSCE] (30.6000, 30.7600, 29.0000, 29.8800), LIG HT CRUDE CO NT INUO US 1000 BARRELS [ NYMEX] (101.700, 104.940, 101.540, 104.420)
155 38
150 37
36
145
35
140
34
135 33
130 32
SUG AR 31
125
30
120
29
115 28
110 27
105 26
25
100
CRUDE OI L 24
95
23
90 22
85 21
80 20
19
75
18
70 17
65 16
60 15
14
55
13
50
12
45 11
40 10
9
35
8
30
7
25
6
A S O N D 2005 A M J J A S O N D 2006 A M J J A S O N D 2007 A M J J A S O N D 2008 A M J J A S O N D 2009 A M J J A S O N D 2010 A M J J A S O N D 2011