
Recommended
More Related Content
Similar to Tx -stat_fy12_teds_414982_7
Similar to Tx -stat_fy12_teds_414982_7 (20)
More from satoriwatersfl
More from satoriwatersfl (20)
Tx -stat_fy12_teds_414982_7
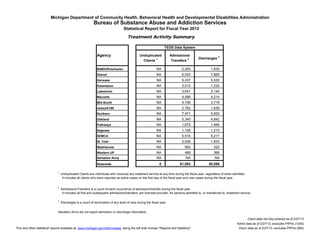
- 1. Unduplicated Clients 1 Admissions/ Transfers 2 Discharges 3 NA 2,283 1,935 NA 9,053 7,865 NA 6,337 5,530 NA 3,012 1,232 NA 3,641 3,144 NA 4,586 4,214 NA 4,756 3,719 NA 2,762 1,636 NA 7,471 5,952 NA 5,340 4,842 NA 1,675 1,469 NA 1,195 1,210 NA 5,516 5,217 NA 2,026 1,933 NA 952 320 NA 488 368 NA NA NA 0 61,093 50,586 Salvation Army did not report admission or discharge information. Client data not fully entered as of 2/27/13 Admit data as of 2/27/13, excludes PIPHs (1200) Disch data as of 2/27/13, excludes PIPHs (980)This and other statistical reports available at: www.michigan.gov/mdch-bsaas, along the left side choose "Reports and Statistics". 2 Admissions/Transfers is a count of each occurrence of admission/transfer during the fiscal year. It includes all first and subsequent admissions/transfers, per licensed provider, for persons admitted to, or transferred to, treatment service. 1 Unduplicated Clients are individuals who received any treatment service at any time during the fiscal year, regardless of when admitted. It includes all clients who were reported as active cases on the first day of the fiscal year and new cases during the fiscal year. Agency Northern Detroit Genesee Kalamazoo Statewide TEDS Data System Lakeshore network180 Salvation Army St. Clair Washtenaw Michigan Department of Community Health, Behavioral Health and Developmental Disabilities Administration 3 Discharges is a count of termination of any level of care during the fiscal year. SEMCA BABH/Riverhaven Saginaw Western UP Oakland Pathways Macomb Mid-South Bureau of Substance Abuse and Addiction Services Statistical Report for Fiscal Year 2012 Treatment Activity Summary