More Related Content
Similar to The lakes of_titan
Similar to The lakes of_titan (20)
More from Sérgio Sacani (20)
The lakes of_titan
- 1. Vol 445 | 4 January 2007 | doi:10.1038/nature05438
LETTERS
The lakes of Titan
E. R. Stofan1,2, C. Elachi3, J. I. Lunine4, R. D. Lorenz5, B. Stiles3, K. L. Mitchell3, S. Ostro3, L. Soderblom6, C. Wood7,
H. Zebker8, S. Wall3, M. Janssen3, R. Kirk6, R. Lopes3, F. Paganelli3, J. Radebaugh4, L. Wye8, Y. Anderson3, M. Allison9,
R. Boehmer3, P. Callahan3, P. Encrenaz10, E. Flamini11, G. Francescetti12, Y. Gim3, G. Hamilton3, S. Hensley3,
W. T. K. Johnson3, K. Kelleher3, D. Muhleman13, P. Paillou14, G. Picardi15, F. Posa16, L. Roth3, R. Seu15, S. Shaffer3,
S. Vetrella12 & R. West3
The surface of Saturn’s haze-shrouded moon Titan has long been year ago by Voyager in the north and now also seen to be present (see,
proposed to have oceans or lakes, on the basis of the stability of for example, ref. 13), forms during polar winter. Observations and
liquid methane at the surface1,2. Initial visible3 and radar4,5 modelling suggest that high-latitude clouds poleward of 75u south
imaging failed to find any evidence of an ocean, although abund- are methane but include an ethane mist9. Ethane is fairly involatile at
ant evidence was found that flowing liquids have existed on the Titan surface conditions, and hence if present would form a perman-
surface5,6. Here we provide definitive evidence for the presence of ent component to lakes. With the observations currently available,
lakes on the surface of Titan, obtained during the Cassini Radar the condensed-phase surface methane-to-ethane ratio cannot be
flyby of Titan on 22 July 2006 (T16). The radar imaging polewards constrained. Even if the as yet unmeasured surface temperatures
of 706 north shows more than 75 circular to irregular radar-dark above 75u north latitude are 3–5 K below the equatorial 93.6 K (ref.
patches, in a region where liquid methane and ethane are expected 14), as suggested by Voyager observations11, dissolved nitrogen in
to be abundant and stable on the surface2,7. The radar-dark patches binary methane–nitrogen lakes will depress the freezing point suffi-
are interpreted as lakes on the basis of their very low radar reflec- ciently, and ternary methane–ethane–nitrogen lakes will have
tivity and morphological similarities to lakes, including associated strongly depressed freezing points.
channels and location in topographic depressions. Some of the The Cassini Titan Radar Mapper4,15 (Ku-band wavelength 2.17 cm)
lakes do not completely fill the depressions in which they lie, instrument had its sixth radar pass of Titan (T16) on 22 July 2006
and apparently dry depressions are present. We interpret this to (UTC). The synthetic aperture radar (SAR) arc-shaped imaging
indicate that lakes are present in a number of states, including swath extends from mid-northern latitudes to near the north pole
partly dry and liquid-filled. These northern-hemisphere lakes con- and back, and is 6,130 km long with spatial resolutions of 300–
stitute the strongest evidence yet that a condensable-liquid hydro- 1,200 m (Fig. 1, and Supplementary Fig. 1). Incidence angles across
logical cycle is active in Titan’s surface and atmosphere, in which the swath vary from 15u to 35u. The portion of the swath that
the lakes are filled through rainfall and/or intersection with the extended from about 70u to 83u north contained more than 75 radar
subsurface ‘liquid methane’ table. dark patches, from 3 km to more than 70 km across.
Liquid methane is a thermodynamically allowed phase anywhere The dark patches contrast with the surrounding terrain, which has
on the surface of Titan today. However, at all except the highest a mottled appearance similar to that of other ‘plains’ regions on
latitudes, the methane relative humidity (amount of methane relative Titan4,5,16. The backscatter of some of the dark patches is extremely
to the saturated value) is less than 100%, and so standing bodies of low. Several appear at the noise floor of the data (about 225 dB s0),
methane must evaporate into the atmosphere. There is no methane with much lower reflectivity than previously imaged areas on Titan,
ocean in contact with the atmosphere8, and the timescale for saturat- including the radar-dark (about 213 dB s0) sand dunes observed
ing the atmosphere by evaporation of methane from the surface near Titan’s equator. For the darkest patch we have observed so
(about 103 years (ref. 9)) is much longer than the seasonal cycle of far, the normalized radar cross-section (s0) value is less than about
just under 30 years. Hence methane precipitation near the poles 226 dB and could be zero, because the measured signal is at the
should dominate the ‘hydrology’ of methane on Titan10. Thus, lakes system noise level (Fig. 2). We are unable to ascertain that any signal
will be stable from the poles down to a latitude determined by the at all has been reflected from this feature.
abundance of methane in the surface–atmosphere system and by the The radar backscatter of the dark patches at Cassini SAR imaging
possible intersection of such surface methane fluids with putative incidence angles is consistent with that expected from a very smooth
subterranean ‘methanifers’, analogous to terrestrial aquifers. surface of any kind (for example liquid, rock, ice or organics) or even
An additional factor in establishing and stabilizing the presence of simply a non-reflecting, absorbing surface (for example a low-density
lakes at high latitude is the preferential deposition of ethane in polar surface smoothly matched into a non-scattering absorber such as
regions (see, for example, ref. 11). This in turn may be controlled fluffy soot or dirty snow overlying a uniform and electrically absorb-
by the availability of cloud condensation nuclei in the stratosphere ing substrate). Radiometric brightness temperatures are obtained
enhanced by the sedimentation of heavier organics such as C4N2 (ref. along with the SAR swaths, although the spatial resolution is limited
12) in the seasonal polar hood. This feature, imaged nearly a Titan to the footprints of the respective radar beams (that is, more than
1
Proxemy Research, Rectortown, Virginia 20140, USA. 2Department of Earth Sciences, University College London, London WC1E 6BT, UK. 3Jet Propulsion Laboratory, California
Institute of Technology, Pasadena, California 91109, USA. 4Lunar and Planetary Laboratory, University of Arizona, Tucson, Arizona 85721, USA. 5Space Department, Johns Hopkins
University Applied Physics Lab, Laurel, Maryland 20723-6099, USA. 6US Geological Survey, Flagstaff, Arizona 86001, USA. 7Wheeling Jesuit University and Planetary Science
Institute, Tucson, Arizona 85719, USA. 8Stanford University, Stanford, California 94305, USA. 9Goddard Institute for Space Studies, National Aeronautics and Space Administration
New York, New York 10025, USA. 10Observatoire de Paris, 92195 Meudon, France. 11Alenia Aerospazio, 00131 Rome, Italy. 12Facolta di Ingegneria, 80125 Naples, Italy. 13Division of
´
Geological and Planetary Sciences, California Institute of Technology, Pasadena, California 91125, USA. 14Observatoire Aquitain des Sciences de l’Univers UMR 5804, 33270 Floirac,
15 16
´
France. Universita La Sapienza, 00184 Rome, Italy. Dipartimento Interateneo di Fisica, Politecnico di Bari, 70126 Bari, Italy.
61
©2007 Nature Publishing Group
- 2. LETTERS NATURE | Vol 445 | 4 January 2007
0º 5º a b
14 6
80 −5 80 −5
0º
º
13
70
60 −10 60 −10
km
0º
12
º 40 40
75 −15 −15
20 −20 20 −20
º
110
º
80
20 40 60 80 20 40 60 80
km km
100º
º
85 c d
0 0
90º
−10 −10
NRCS (db)
−20 −20
80º
85º
−30 −30
70º
80º
−40 −40
−50 0 50 100 −20 0 20 40 60
km km
60
º
75º
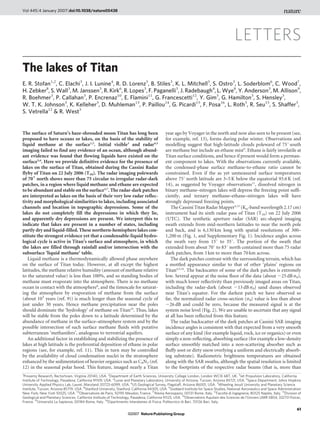
Figure 2 | Radar return from the darkest observed lake. a, Pseudo-colour
image of observed normalized radar cross-section (NRCS) over lake at 80.5u
50
º
north, 50u west. Corrections have been applied to remove known systematic
40 70º biases in return resulting from thermal noise. NRCS measurement produced
º
by thermal noise alone is referred to as the noise floor. Noise floor varies
30
º throughout the image due primarily to shape of antenna gain pattern. Dark
20º
65º blue region at top is outside radar observation. b, The same image without
10º
0º 350º noise correction. White vertical and horizontal lines depict cuts used to
produce c and d. To reduce the effect of random variance, we averaged NRCS
Figure 1 | Northern portion of the T16 swath. This portion of the T16 swath
over a 17 m 3 17 km region (white rectangle). c, Horizontal cut through the
contains the dark patches interpreted as lakes. The image swath is shown in a
noise-corrected NRCS image (black) with a 2s lower bound (blue) and upper
polar projection; for scale, 1u of latitude is about 45 km. A high-resolution
bound (red). In c and d, each point on the solid black curve is the average
version of this image is given in Supplementary Information.
NRCS over a 3.6 km 3 3.6 km area. Error bars include the effect of relative
calibration errors due to spacecraft attitude knowledge, errors in noise
6 km). Nevertheless, several dark patches were observed that were subtraction process, and random variance. Cassini radar NRCS estimates
resolved or partly resolved by at least one of the beams. The temper- have an unknown absolute bias estimated to be 63 dB. Gaps in the NRCS
ature contrast between these dark patches and the surrounding curve and the lower bound curve are regions in which the values are zero or
terrain is consistent with a flat surface of low dielectric constant in negative and thus cannot be represented in dB. d, Vertical cut through the
an ice terrain, where the emissivity of the ice is probably decreased noise-corrected NRCS image. There is a large contrast (15 dB) in NRCS
across lake boundaries.
somewhat by volume scattering. From microwave reflectivity and
emissivity considerations, then, the dark patches are probably deposit that is darker than any observed elsewhere on Titan. The
smooth surfaces of a low-dielectric material such as liquid methane. absence of any aeolian features in this area makes low-density, por-
At several of the dark patches, radar-dark sinuous features lead ous, unconsolidated sediments unlikely. This, combined with the
into the dark patch (Fig. 3a). These features resemble channels else- morphologic characteristics of the dark patches, leads us to conclude
where on Titan interpreted to be fluvial in origin4,5,17. Two of the dark that the dark patches are lakes containing liquid hydrocarbons.
patches are connected by a narrow, radar-dark channel (Fig. 3b). Several types of characteristic margins or shorelines of the lakes are
However, even the dark patches with channels do not have extensive observed (Figs 1 and 3). As described above, some have steep margins
associated channel networks, suggesting that the channels are not the and very distinct edges, suggesting confinement by a topographic
sole source of dark material infilling the patches. rim. These lakes are more consistent with seepage or groundwater
Fifteen dark patches are in relatively steep-sided, rimmed, circular drainage lakes, with the lake intersecting the subsurface liquid-meth-
depressions, in contrast with other dark patches in this region that ane table. Other lakes have diffuse, more scalloped edges, with a
exhibit no such topography at this scale. These depressions seem to gradual decrease in backscatter towards the centre of the lake.
have existed in this form before being filled with dark material, and These lakes are more likely to have associated channels, and thus
do not show clear evidence of erosion. The dark patches in depres- may be either drainage lakes or groundwater drainage lakes. Other
sions resemble terrestrial lakes confined within impact basins (for lakes are more sinuous, or have sinuous extensions, similar in
example Clearwater Lakes, Canada), volcanic calderas (for example appearance to terrestrial flooded river valleys.
Crater Lake, Oregon, USA) or karst dolines or sinkholes. The nested Several of the depressions seem to be filled with liquid, whereas
nature and limited size range of the depressions make an impact others are only partly filled (Fig. 3c). These partly filled depressions
origin unlikely. A volcanic origin for the depressions is possible, given may never have filled fully, or may have partly evaporated at some
their morphology and our previous identification of cryovolcanic point in the past. Other features in the swath have margins similar to
calderas on Titan4,18. Although liquid methane is thought to be other lakes but a surface backscatter similar to the surrounding ter-
unable to dissolve water ice19, it is also possible that dissolution of rain (Fig. 3d). We interpret these to be possibly depressions that are
a mixed organics and ice substrate has produced topographic depres- now devoid of liquid. These lakes in possible varying states of fill
sions that can hold liquid. suggest that the lakes in this region of Titan might be ephemeral,
Only two hypotheses are consistent with the radiometric and mor- on some unknown timescale.
phological characteristics of the dark patches: either we are observing Although the lakes have generally very radar-dark surfaces, some
liquid-filled lakes on Titan today, or depressions and channels have areas of increased radar brightness most commonly near their
formed in the past have now been infilled by a very low-density edges. The proximity to the edges suggests that the enhanced
62
©2007 Nature Publishing Group
- 3. NATURE | Vol 445 | 4 January 2007 LETTERS
a 50 km c 50 km
b
d 50 km
50 km
Figure 3 | Examples of lakes from the T16 swath. a, Sinuous radar-dark to be a nested depression, with dark material filling the inner depression. d, A
channels can be seen leading into two lakes. b, A pair of irregularly shaped feature with a shape similar to lakes (arrows), but with backscatter similar to
lakes connected by a radar-dark channel. c, Radar-dark material in the lake surrounding plains. On the basis of similarly shaped lakes and possibly
to the left lies inside an apparent topographic edge (arrows), indicating that partly filled features, we interpret this feature to be a dry lakebed.
it might once have been at a higher level. The circular lake to the right seems
brightness might be due to a reflection from the lake bottom, where it istry decreases the total methane—atmospheric, lacustrine and
is sufficiently shallow that the bottom echo is not completely atte- methaniferic—available to the system, causing lakes at progressively
nuated. Ku-band energy may penetrate many tens of metres through higher latitudes to be dry all year round. The abrupt and striking
pure hydrocarbon liquids such as ethane or methane. Tidal winds at transition southwards of about 70u north latitude from the very dark
these high latitudes are predicted20 to be less than 0.5 m s21, an order lakes to features similarly shaped but bearing no contrast with the
of magnitude lower than that needed to form capillary waves in liquid surroundings might be a consequence of the progressive depletion of
hydrocarbons in wind-tunnel tests on Earth21. The higher air density methane from the surface–atmosphere system. On unknown but
on Titan may facilitate wave growth somewhat, and over long fetches possibly longer timescales, thermal evolution of Titan’s interior
small gravity waves may form (amplitude about 5 cm; wavelength may drive additional methane into the surface–atmosphere system26
much less than 1 m) that could potentially be detected by the radar. by means of cryovolcanic events, geysering or the impact-generated
We note that it is also possible that bright patches near the lake edges release of methane stored below the surface. This last postulated
could be small ‘islets’ protruding through the surface. Floating ‘ice- resupply of methane from the interior is most speculative and is
bergs’ are unlikely because most materials would not float in liquid not directly implied by the presence of the lakes, although possible
hydrocarbons. volcanic constructs seen by radar4 and the visible and near-infrared
Our inference that the northern-hemisphere lakes discovered by mapping spectrometer27 hint at the long-term role of volcanism and
Cassini radar are at least partly liquid methane is consistent with outgassing.
various other considerations. If such lakes cover at least 0.2–4% of Future radar observations will determine the origin of lake surface
Titan’s surface (depending on the amount of relatively involatile but textures (for example winds or lake bottom effects) and will also
highly soluble ethane contained within them), they will buffer the constrain liquid dielectric properties, and possibly depth and shore-
atmospheric methane’s relative humidity at its observed value7, line characteristics through diversity in the viewing geometry. SAR
removing the requirement for a putative steady drizzle at the imagery of the lakes near the end of a proposed extended mission, in
equator22. If the abundance of lakes seen in the T16 data are typical 2009 or 2010, would provide a sufficient time base on which to detect
of their coverage poleward of about 70u in both hemispheres, then the seasonally driven changes in lake extent, predicted to occur7 if the
fraction of Titan’s surface covered by lakes is within this range. More lakes are not connected to a much larger subsurface methanifer.
recent polar radar data from Cassini support this assertion. Future missions to the surface will be required for a full understand-
Titan’s northern hemisphere lakes probably participate in a ing of the lakes of Titan, in particular how they formed, their detailed
methanological cycle that has multiple timescales. As Titan’s seasons composition and their interaction with their shorelines.
progress over the 29-year cycle of Saturn’s orbit around the Sun, lakes
in the winter hemisphere should expand by steady methane precip- Received 2 September; accepted 9 November 2006.
itation while summer hemisphere lakes shrink or dry up entirely. 1. Lunine, J. I., Stevenson, D. J. & Yung, Y. L. Ethane ocean on Titan. Science 222,
More speculatively and possibly less frequently (about 103 years for 1229–1230 (1983).
any given location9), mid-latitude and equatorial regions could 2. Lorenz, R. D., Kraal, E., Asphaug, E. & Thomson, R. The seas of Titan. Eos 84,
experience a progressive growth in methane humidity leading to 125–132 (2003).
3. Porco, C. C. et al. Imaging of Titan from the Cassini spacecraft. Nature 434,
much more violent methane thunderstorms23, carving the erosional 159–168 (2005).
patterns seen in the Huygens probe images6 and other radar swaths24. 4. Elachi, C. et al. Cassini radar views the surface of Titan. Science 308, 970–974
On timescales of tens of millions of years25, atmospheric photochem- (2005).
63
©2007 Nature Publishing Group
- 4. LETTERS NATURE | Vol 445 | 4 January 2007
5. Elachi, C. et al. Titan radar mapper observations from Cassini’s T3 flyby. Nature 19. Lorenz, R. D. & Lunine, J. I. Erosion on Titan: Past and present. Icarus 122, 79–91
441, 709–713 (2006). (1996).
6. Tomasko, M. et al. Rain, winds and haze during the Huygens probe’s descent to 20. Tokano, T. & Neubauer, F. M. Wind-induced seasonal angular momentum
Titan’s surface. Nature 438, 765–778 (2005). exchange at Titan’s surface and its influence on Titan’s length-of-day. Geophys.
7. Mitri, G., Showman, A. P., Lunine, J. I. & Lorenz, R. D. Hydrocarbon lakes on Titan. Res. Lett. 32, L24203 (2005).
Icarus (in the press). 21. Lorenz, R. D., Kraal, E., Eddlemon, E., Cheney, J. & Greeley, R. Sea-surface wave
8. West, R. A., Brown, M. E., Salinas, S. V., Bouchet, A. H. & Roe, H. G. No oceans on growth under extraterrestrial atmospheres—preliminary wind tunnel
Titan from the absence of a near-Infrared specular reflection. Nature 436, experiments with application to Mars and Titan. Icarus 175, 556–560 (2005).
670–672 (2005). 22. Tokano, T. et al. Methane drizzle on Titan. Nature 442, 432–435 (2006).
9. Lorenz, R. D., Griffith, C. A., Lunine, J. I., McKay, C. P. & Renno, N. O. Convective ´
23. Hueso, R. & Sanchez-Lavega, A. Methane storms on Saturn’s moon Titan. Nature
plumes and the scarcity of Titan’s clouds. Geophys. Res. Lett. 32, L01201 (2005). 442, 428–431 (2006).
10. Rannou, P., Montmessin, F., Hourdin, F. & Lebonnois, S. The latitudinal distribution 24. Lunine, J. I. et al. Cassini radar’s third and fourth looks at Titan. Icarus (submitted).
of clouds on Titan. Science 311, 201–205 (2006). 25. Yung, Y. L., Allen, M. A. & Pinto, J. P. Photochemistry of the atmosphere of Titan:
11. Samuelson, R. E., Nitya, N. R. & Borysow, A. Gaseous abundances and methane comparison between model and observations. Astrophys. J. Suppl. Ser. 55,
465–506 (1984).
supersaturation in Titan’s troposphere. Planet. Space Sci. 45, 959–980 (1997).
26. Tobie, G., Lunine, J. I. & Sotin, C. Episodic outgassing as the origin of atmospheric
12. Samuelson, R. E., May, L. A., Knuckles, M. A. & Khanna, R. J. C4N2 ice in Titan’s
methane on Titan. Nature 440, 61–64 (2006).
north polar atmosphere. Planet. Space Sci. 45, 941–948 (1997).
27. Sotin, C. et al. Release of volatiles from a possible cryovolcano from near-infrared
13. Lorenz, R. D., Lemmon, M. T. & Smith, P. H. Seasonal evolution of Titan’s dark
imaging of Titan. Nature 435, 786–789 (2005).
polar hood: midsummer disappearance observed by the Hubble Space Telescope.
Mon. Not. R. Astron. Soc. 369, 1683–1687 (2006). Supplementary Information is linked to the online version of the paper at
14. Fulchignoni, M. et al. In situ measurements of the physical characteristics of www.nature.com/nature.
Titan’s environment. Nature 438, 785–791 (2005).
15. Elachi, C., Im, E., Roth, L. E. & Werner, C. L. Cassini Titan radar mapper. Proc. IEEE Acknowledgements We gratefully acknowledge the long years of work by the
entire Cassini team that allowed these data of Titan to be obtained. The Cassini
79, 867–880 (1991).
Project is a joint endeavour of NASA, ESA and ASI, managed by the Jet Propulsion
16. Stofan, E. R. et al. Mapping of Titan: Results from the first Titan radar passes. Icarus
Laboratory, California Institute of Technology under a contract with NASA.
(in the press).
17. Lorenz, R. D. et al. Fluvial channels on Titan: Meteorological paradigm and Cassini Author Information Reprints and permissions information is available at
RADAR observations. Planet. Space Sci. (submitted). www.nature.com/reprints. The authors declare no competing financial interests.
18. Lopes, R. M. C. et al. Cryovolcanic features on Titan’s surface as revealed by the Correspondence and requests for materials should be addressed to E.R.S.
Cassini Titan radar mapper. Icarus (in the press). (estofan@proxemy.com).
64
©2007 Nature Publishing Group