
Recommended
More Related Content
Viewers also liked
More from rkottam
More from rkottam (18)
Recently uploaded
Recently uploaded (20)
Plan601 e session 1 lesson 20151005
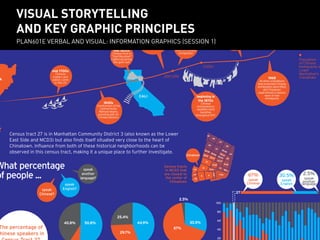
- 1. 67% 2.5% 30.5%44.9% 25.4% 29.7% The percentage of hinese speakers in speak English? speak another language? What percentage of people ... speak Chinese? 40.8% 50.8% Census tracts in MCD3 that are closest to the center of Chinatown 20 40 60 80 100 27 2.5% speak another language 67% speak Chinese 30.5% speak English Chinatown 42 40 34 28 24 26.02 26.0122.02 20 10.02 32 38 36.02 30.02 30.01 36.01 22.01 12 10.01 14.02 14.01 18 25 27 29 8 6 2.01 2.02 16 A mid 1700s Chinese traders and sailors come to the US mid 1800s Chinese flock to “Gold Mountain” California during the gold rush A brief history of Chinese immigration to Lower Manhattan 1840s Construction of the Central Pacific Railroad begins, providing jobs for Chinese laborers beginning in the 1870s Chinese entrepreneurs establish hand laundries throughout NYC 1860s - 1880s Rising violence and discrimination toward Chinese immigrants causes them to flee to the big cities of the eastern US for more job opportunities 1882 The Chinese Exclusion Act imposed strict limits on Chinese immigration 7,000+ 34,554 28,68 200-1,100 Population of Chinese immigrants in Lower Manhattan’s Chinatown 1943 During WWII the Chinese Exclusion Act was discontinued 1968 All other prohibitions that prevented Chinese immigration were lifted, and Chinatown experienced a massive wave of new immigrants 2000s Getrification of Chinatown begins to displace residents CALI NYC As a result of this, “Chinatowns” are growing in other areas of the City such as Sunset Park in Brooklyn and Flushing in Queens. Census tract 27 is in Manhattan Community District 3 (also known as the Lower East Side and MCD3) but also finds itself situated very close to the heart of Chinatown. Influence from both of these historical neighborhoods can be observed in this census tract, making it a unique place to further investigate. VISUAL STORYTELLING AND KEY GRAPHIC PRINCIPLES PLAN601E VERBAL AND VISUAL: INFORMATION GRAPHICS (SESSION 1)
- 2. HOW TO BUILD A STORY PREMISE
- 3. A mischievous boy is transported to an island of wild creatures who make him their king—but is it paradise? PREMISE: FUNDAMENTAL IDEA/S THAT DRIVE THE PLOT
- 4. A successful stockbroker gets involved with a younger man during a vacation to Jamaica, causing her to reevaluate her life priorities. PREMISE: FUNDAMENTAL IDEA/S THAT DRIVE THE PLOT
- 5. SAMPLE PREMISES Bike racks are needed in Census Tract 2.02. Where does garbage from Community District 3 go, and why? What are the challenges in the process of registering a new business with the Department of Small Business Services?
- 6. NONE OF THESE ARE PREMISES The history of Tompkins Square Park A look at graffiti in Soundview Community Gardens in Clinton Hill
- 7. HOW TO BUILD A STORY ACT 1: BEGINNING ACT 2: MIDDLE ACT 3: END
- 8. THREE ACT STORY ACT 1: SET UP – SETTING, CHARACTERS, AND PROBLEM INTRODUCED Confined to a wheelchair, Jefferies spends the day watching his neighbors. Lisa wants Jefferies, but he acts distracted. ACT 2: TURNING POINT – PROBLEM GETS COMPLEX A neighbor appears to have killed a dog that was digging up the garden; Jefferies thinks the neighbor has murdered his wife, but his detective friend doesn’t believe him. ACT 3: DENOUEMENT – CLIMAX HAPPENS AND PROBLEM RESOLVED Jefferies convinces Lisa to sneak into the neighbor’s apartment to find evidence of the murder, but they both almost get murdered themselves. Now that she is a co-conspirer, Jefferies agrees to marry Lisa. Lisa is happy. Organize a presentation with three “acts” or “chapters”: 1) set the characters and context; 2) detail a problem; 3) resolve the problem. Let story lead your narrative, not data. THREE acT sToRy acT 1: sET up – sETTING, cHaRacTERs, aNd pRoBLEM INTRoducEd confined to a wheelchair, Jefferies spends the day watching his neighbors. Lisa wants Jefferies, but he acts distracted. acT 2: TuRNING poINT – pRoBLEM GETs coMpLEX A neighbor appears to have killed a dog that was digging up the garden; Jefferies thinks the neighbor has murdered his wife, but his detective friend doesn’t believe him. acT 3: dENouEMENT – cLIMaX HappENs aNd pRoBLEM REsoLVEd Jefferies convinces Lisa to sneak into the neighbor’s apartment to find evidence of the murder, but they both almost get murdered themselves. Now that she is a co-conspirer, Jefferies agrees to marry Lisa. Lisa is happy. organize a presentation with three “acts” or “chapters”: 1) set the characters and context; 2) detail a problem; 3) resolve the problem. Let story lead your narrative, not data. THREE acT sToRy acT 1: sET up – sETTING, cHaRacTERs, aNd pRoBLEM INTRoducEd confined to a wheelchair, Jefferies spends the day watching his neighbors. Lisa wants Jefferies, but he acts distracted. acT 2: TuRNING poINT – pRoBLEM GETs coMpLEX A neighbor appears to have killed a dog that was digging up the garden; Jefferies thinks the neighbor has murdered his wife, but his detective friend doesn’t believe him. acT 3: dENouEMENT – cLIMaX HappENs aNd pRoBLEM REsoLVEd Jefferies convinces Lisa to sneak into the neighbor’s apartment to find evidence of the murder, but they both almost get murdered themselves. Now that she is a co-conspirer, Jefferies agrees to marry Lisa. Lisa is happy. organize a presentation with three “acts” or “chapters”: 1) set the characters and context; 2) detail a problem; 3) resolve the problem. Let story lead your narrative, not data. THREE acT sToRy acT 1: sET up – sETTING, cHaRacTERs, aNd pRoBLEM INTRoducEd confined to a wheelchair, Jefferies spends the day watching his neighbors. Lisa wants Jefferies, but he acts distracted. acT 2: TuRNING poINT – pRoBLEM GETs coMpLEX A neighbor appears to have killed a dog that was digging up the garden; Jefferies thinks the neighbor has murdered his wife, but his detective friend doesn’t believe him. acT 3: dENouEMENT – cLIMaX HappENs aNd pRoBLEM REsoLVEd Jefferies convinces Lisa to sneak into the neighbor’s apartment to find evidence of the murder, but they both almost get murdered themselves. Now that she is a co-conspirer, Jefferies agrees to marry Lisa. Lisa is happy. organize a presentation with three “acts” or “chapters”: 1) set the characters and context; 2) detail a problem; 3) resolve the problem. Let story lead your narrative, not data.
- 9. WAYS TO TELL A STORY Organize a presentation with three “acts” or “chapters”: 1) set the characters and context; 2) detail a problem; 3) resolve the problem. Let story lead your narrative, not data. BUILD A CASE Provide information and argue for a specific interpretation – reveal a way to look at the world ACT 1: Background information ACT 2: Analysis ACT 3: Findings or proposal
- 10. WAYS TO TELL A STORY Organize a presentation with three “acts” or “chapters”: 1) set the characters and context; 2) detail a problem; 3) resolve the problem. Let story lead your narrative, not data. GIVE A SUMMATIVE TOUR Describe existing conditions in depth and volume that puts a single phenomenon in context ACT 1: Individual instances ACT 2: Explain phenomena ACT 3: Draw phenomenon into context and draw conclusions
- 11. WAYS TO TELL A STORY Organize a presentation with three “acts” or “chapters”: 1) set the characters and context; 2) detail a problem; 3) resolve the problem – narrate with stories not data EXPLORE A SCENARIO Explain a problem or condition through the experience of stakeholders ACT 1: Describe a character and their issues/concerns ACT 2: Detail the mechanism that could serve them ACT 3: Describe how the character is served by the proposed program or service
- 12. WAYS TO TELL A STORY Organize a presentation with three “acts” or “chapters”: 1) set the characters and context; 2) detail a problem; 3) resolve the problem. Let story lead your narrative, not data. EVALUATION Explore the strengths and weaknesses of a given phenomenon, issue or dimension ACT 1: Set a baseline: establish existing conditions and explain them in context ACT 2: Evaluate conditions or solutions via matrix comparison, continuum, pros and cons, etc. ACT 3: Make recommendations
- 13. INFORMATION GRAPHICS = TOOLS FOR VISUAL COMMUNICATION Do you want to make a COMPARISON? ISOTYPE SECTION SUPERGRAPHIC NETWORK MAP MATRIXCONTINUUM DIAGRAM FLOW CHART CYCLE DIAGRAM GRAPH CHART DOT DENSITY Do you want to show a PROCESS? Do you want to show a RELATIONSHIP? Do you want to explain a CONCEPT?
- 14. INFORMATION GRAPHICS = SHOWING CONTEXT VISUALLY INFORMATION GRAPHICS = SHOWING CONTEXT VISUALLY
- 15. INFORMATION GRAPHICS = VISUAL AND NARRATIVE HIERARCHYINFORMATION GRAPHICS = VISUAL AND NARRATIVE HIERARCHY
- 16. Size / Scale Color Line Weight INFORMATION GRAPHICS = EXPLAINING THROUGH VISUAL DIFFERENCE s of social capital decreased nationwide with reported income. in the absence of traditional civic structure, many Detroiters r less official groups, I investigated the robustness of the trend mple. Using GIS, I mapped respondents’ group memberships rther disaggregated responses to reveal uneven correlations I produced a series of illustrative diagrams to convey the nses both quantatitively and qualitatively. Size / Scale Color Line Weight INFORMATION GRAPHICS = EXPLAINING THROUGH VISUAL DIFFERENCES
- 17. INFORMATION GRAPHICS = USING GRIDS Leading the eye. Rule of thirds. INFORMATION GRAPHICS = PROVIDING VISUAL STRUCTURE
- 18. INFORMATION GRAPHICS = MAKING VISUAL COMPARISONS INFORMATION GRAPHICS = MAKING VISUAL COMPARISONS
- 19. COURSE STRUCTURE WK. 1 2 3 4 5 TOPICS Visual Storytelling and Key Graphic Principles Principles of Graphic Design Single Dimension Comparisons Design Process Sequence, Flow & Connection Design Discretion Evaluative & Synthetic Graphics Constructing a Visual Narrative Storyboarding DEMO FactFinder Photo Highlights Narrative Layout Charts / Graphs with Illustrator Flowcharts / Small Multiples with Illustrator Continuum Diagram / Matrix with Illustrator and InDesign Formatting and Layout with InDesign ASSIGNMENT Data collection Photo-documentation Charts / Graphs Icons Flowcharts / Timelines Continium Diagram / Matrix Slide Presentation A1 Poster
- 20. COURSE STRUCTURE COURSE COMPONENTS Readings (x 2) Case Studies Lectures / Demonstrations 5-part Assignment • Census Tract / Study Area • Weekly slide deck + JPEG submission • Final presentation GRADING Assignment 1: 10% Assignment 2: 10% Assignment 3: 10% Assignment 4: 10% Assignment 5: 20% Case Study Presentation: 10% Online Participation: 10% In-Class Participation: 20% ASSIGNMENT GRADING CRITERIA 4 pts Clarity and coherence of narratives constructed; 3 pts Thoughtfulness, suitability and/or creativity in representation; 2 pts Engagement with and evaluation of different representational strategies (as evidenced in the slide deck by sketches, precedents, notes and finished work); 1 pt Deployment of software tools demonstrated in the course, as appropriate. WEEKLY DEADLINES S Su M T W Th F BLOG / COURSE MATERIALS http://prattinfographics.wordpress.com score and feedback returned blog comments due by midnight assignment due by 9 am class
- 21. Now we’ll assign census tracts or study areas for the assignment. There are 22 census tracts in the study area. They are displayed here in ascending order. BROWNSVILLE STUDY AREA 40.01 44 48 50.01 50.02 52 54 56 60 62 64 68 70 72 76 78 119 121.01 121.02 123 157 161 STUDY AREA
- 22. TIME TO VOLUNTEER FOR CASE STUDIES! WEEK 2 Design tools / Single-dimension comparisons • The Visual Display of Quantitative Information • Florence Nightingale • Otto Neurath WEEK 4 Design discretion / Evaluative and synthetic graphics • “The Cognitive Style of PowerPoint” • Envisioning Information WEEK 3 Design process / Sequence, flow and connection • “The Works” / Kate Ascher • The RSVP Cycles / Lawrence Halprin • Mark Lombardi WEEK 5 Constructing a Visual Narrative • Design with Nature • Taxi07: Roads Forward / Design Trust • Fordham Plaza / NYCEDC