1. Bangladesh Economic and Financial Indicators, January 2022
Bangladesh: Selected Indicators
Both infections and deaths have been picking up - reflecting a
surge in the Omicron variant.
New confirmed cases of and deaths due to COVID-19
Mar 8, 2020 - Jan 31, 2022
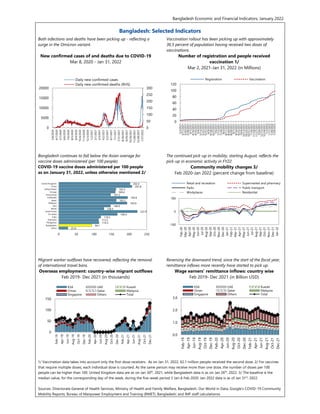
Vaccination rollout has been picking up with approximately
36.5 percent of population having received two doses of
vaccinations.
Number of registration and people received
vaccination 1/
Mar 2, 2021-Jan 31, 2022 (in Millions)
Bangladesh continues to fall below the Asian average for
vaccine doses administered (per 100 people).
COVID-19 vaccine doses administered per 100 people
as on January 31, 2022, unless otherwise mentioned 2/
The continued pick-up in mobility, starting August, reflects the
pick-up in economic activity in FY22.
Community mobility changes 3/
Feb 2020-Jan 2022 (percent change from baseline)
Migrant worker outflows have recovered, reflecting the removal
of international travel bans.
Overseas employment: country-wise migrant outflows
Feb 2019- Dec 2021 (in thousands)
Reversing the downward trend, since the start of the fiscal year,
remittance inflows more recently have started to pick up.
Wage earners' remittance inflows: country wise
Feb 2019- Dec 2021 (in Billion USD)
1/ Vaccination data takes into account only the first-dose receivers. As on Jan 31, 2022, 62.1 million people received the second dose. 2/ For vaccines
that require multiple doses, each individual dose is counted. As the same person may receive more than one dose, the number of doses per 100
people can be higher than 100. United Kingdom data are as on Jan 30th
, 2021, while Bangladesh data is as on Jan 26th
, 2022. 3/ The baseline is the
median value, for the corresponding day of the week, during the five-week period 3 Jan-6 Feb 2020. Jan 2022 data is as of Jan 31st
, 2022.
Sources: Directorate General of Health Services, Ministry of Health and Family Welfare, Bangladesh; Our World in Data; Google's COVID-19 Community
Mobility Reports; Bureau of Manpower Employment and Training (BMET), Bangladesh; and IMF staff calculationss
0
50
100
150
200
250
300
0
5000
10000
15000
20000
3/8/2020
4/7/2020
5/7/2020
6/6/2020
7/6/2020
8/5/2020
9/4/2020
10/4/2020
11/3/2020
12/3/2020
1/2/2021
2/1/2021
3/3/2021
4/2/2021
5/2/2021
6/1/2021
7/1/2021
7/31/2021
8/30/2021
9/29/2021
10/29/2021
11/28/2021
12/28/2021
1/27/2022
Daily new confirmed cases
Daily new confirmed deaths (RHS)
0
20
40
60
80
100
120
3/2/2021
3/11/2021
3/20/2021
3/29/2021
4/7/2021
4/16/2021
4/25/2021
5/4/2021
5/13/2021
5/22/2021
5/31/2021
6/9/2021
6/18/2021
6/27/2021
7/6/2021
7/15/2021
7/24/2021
8/2/2021
8/11/2021
8/20/2021
8/29/2021
9/7/2021
9/16/2021
9/25/2021
10/4/2021
10/13/2021
10/22/2021
10/31/2021
11/9/2021
11/18/2021
11/27/2021
12/6/2021
12/15/2021
12/24/2021
1/2/2022
1/11/2022
1/20/2022
1/29/2022
Registration Vaccination
25.9
94.1
114.3
113.2
119.5
166.4
222.9
128.3
146.9
193.9
163.2
195.6
147.3
160.4
162.5
207.8
202.4
0 50 100 150 200 250
Africa
Bangladesh
Philippines
Indonesia
India
Sri Lanka
South Korea
World
Asia
Malaysia
Japan
Cambodia
Hong Kong
Europe
United States
China
United Kingdom
-100
0
100
Feb-20
Mar-20
Apr-20
May-20
Jun-20
Jul-20
Aug-20
Sep-20
Oct-20
Nov-20
Dec-20
Jan-21
Feb-21
Mar-21
Apr-21
May-21
Jun-21
Jul-21
Aug-21
Sep-21
Oct-21
Nov-21
Dec-21
Jan-22
Retail and recreation Supermarket and pharmacy
Parks Public transport
Workplaces Residential
0
50
100
150
Feb-19
Apr-19
Jun-19
Aug-19
Oct-19
Dec-19
Feb-20
Apr-20
Jun-20
Aug-20
Oct-20
Dec-20
Feb-21
Apr-21
Jun-21
Aug-21
Oct-21
Dec-21
KSA UAE Kuwait
Oman Qatar Malaysia
Singapore Others Total
0.0
1.0
2.0
3.0
Feb-19
Apr-19
Jun-19
Aug-19
Oct-19
Dec-19
Feb-20
Apr-20
Jun-20
Aug-20
Oct-20
Dec-20
Feb-21
Apr-21
Jun-21
Aug-21
Oct-21
Dec-21
KSA UAE Kuwait
Oman Qatar Malaysia
Singapore Others Total
2. 2
Bangladesh: Real Sector Developments
Provisional official data shows continued support to growth by
private consumption and a slight recovery of private investment
and net exports in FY21.
Contributions to Real GDP Growth 1/
FY11-FY21 (y/y, in percentage points)
Consumption to GDP ratio, in FY21, fell slightly while the
investment to GDP ratio remained flat.
Selected Indicators’ Share in Nominal GDP 1/
FY11-FY21 (in percent)
The y/y growth of the quantum indices highlight a pickup in
activity in FY22 thus far.
Quantum Index of Medium and Large-Scale
Manufacturing Industries and Electricity 1/
FY16-FY22 (Oct) (y/y growth, in percent)
Rice production target, in FY22, was set at 39.5 MMT reflecting
the actual production in FY21 (37.4 MMT). Total target for
wheat and maize, in FY22, was set at 7.1 MMT reflecting the
outturn of 5.5 MMT in FY21.
Major Food Grains Production 2/
FY15-FY22 (Million Metric Tons (MMT))
Twelve-month average headline inflation has been creeping up
since the start of the fiscal year.
Twelve Month Average Inflation
Dec 2018-Dec 2021 (y/y, in percent)
Headline inflation, in Dec 2021, exceeded 6 percent with food
inflation reaching 5.5 percent and non-food reaching 7.0
percent.
Point-to-Point Inflation
Dec 2018-Dec 2021 (y/y, in percent)
1/ FY21 and FY22 data are provisional. 2/ FY21 data are actual, while FY22 data are production targets.
Sources: Bangladesh Bureau of Statistics (BBS); Department of Agriculture Extension, Ministry of Agriculture; Bangladesh Bank; and IMF staff
calculations
-4
0
4
8
12
FY11 FY12 FY13 FY14 FY15 FY16 FY17 FY18 FY19 FY20 FY21
Private Consumption Public Consumption
Private Investment Public Investment
Net exports Statiscal discrepancy
GDP growth
72
74
76
78
80
0
10
20
30
40
FY11 FY12 FY13 FY14 FY15 FY16 FY17 FY18 FY19 FY20 FY21
Investment Export
Import Remittance
Consumption (RHS)
0
10
20
30
40
FY16
FY17
FY18
FY19
FY20
FY21
FY22
(Jul)
FY22
(Aug)
FY22
(Sep)
FY22
(Oct)
Manufacturing Electricity
0
5
10
15
20
25
30
35
40
45
50
FY15 FY16 FY17 FY18 FY19 FY20 FY21 FY22
Aus Aman Boro Wheat Maize
4
5
6
7
Dec-18
Feb-19
Apr-19
Jun-19
Aug-19
Oct-19
Dec-19
Feb-20
Apr-20
Jun-20
Aug-20
Oct-20
Dec-20
Feb-21
Apr-21
Jun-21
Aug-21
Oct-21
Dec-21
General Food
Non Food Core
3
4
5
6
7
8
9
Dec-18
Feb-19
Apr-19
Jun-19
Aug-19
Oct-19
Dec-19
Feb-20
Apr-20
Jun-20
Aug-20
Oct-20
Dec-20
Feb-21
Apr-21
Jun-21
Aug-21
Oct-21
Dec-21
General Food
Non Food Core
3. 3
Bangladesh: External Sector Developments
Current account deficit, in FY22 (Jul-Dec), reached USD 8.2
billion, compared with USD 3.5 billion surplus in FY21 (Jul-
Dec).
Current Account Balance Components 1/
FY16-FY22 (Jul-Dec) (in billion USD)
RMG related intermediate goods contributed the most to the
overall growth in imports in FY22 (Jul-Dec).
Item-wise Contributions to Import Growth 2/
FY17-FY22 (Jul-Dec), (y/y growth, in percentage points)
Remittances, y/y in FY22 (Jul-Dec), declined by 21 percent
while exports grew by 27.3 percent and imports by 54.5
percent in the same period.
Major Balance of Payments Components 3/
FY16-FY22 (Jul-Dec) (y/y growth, in percent)
Reflecting the pick-up in import payments, international
reserve coverage continues to decline.
International Reserves 4/
Dec 2018-Dec 2021, (Billion USD)
Trade competitiveness has somewhat improved, mostly
reflecting the depreciation relative to the currency basket of
trading partners.
Exchange Rates
Dec 2018-Dec 2021
Both letters of credit (LC) opening, and settlement have been
picking up in FY22.
Sector-wise contributions to total LC opening and
settlement
FY19-FY22 (Jul-Nov) (y/y, in percentage points)
1/ FY22 (Jul-Dec) data are provisional. 2/ Data are recorded by customs. 3/ Exports and imports are f.o.b. data. 4/ Net international reserve (NIR) is
gross international reserves (excluding investment on bonds below the grade BBB, Silver Acquisition A/C, deposit with Rupali Bank, Pakistan &
deposit with Sonali Bank, UK) minus total liabilities. Total liabilities comprise reserve liabilities in ACU, IMF Trust Fund Account (ECF) and other
foreign currency clearing accounts, and deposits of IBRD/IDA, and SDR allocation.
Sources: Bangladesh Bank; Export Promotion Bureau (EPB); and IMF staff calculations
-70
-20
30
80
FY16 FY17 FY18 FY19 FY20 FY21 FY21
(Jul-Dec)
FY22
(Jul-Dec)
Exports Imports
Services Primary Income
Workers' Remittances Other Secondary Income
Current Account Balance
-20
0
20
40
60
FY17 FY18 FY19 FY20 FY21 FY22 (Jul-
Dec)
Other items Other capital goods
Capital machinery Other intermediate goods
Plastics and rubber articles thereof Fertilizer
Chemicals Petroleum, oil and lubricants
Iron, steel and other base metals RMG intermediate goods
Consumer goods Food grains
Total
-35
15
65
FY16 FY17 FY18 FY19 FY20 FY21 FY22 (Jul-
Dec)
Exports RMG Exports
Other Exports Imports
Remittance
0
5
10
0
6
12
18
24
30
36
42
48
Dec-18
Jan-19
Feb-19
Mar-19
Apr-19
May-19
Jun-19
Jul-19
Aug-19
Sep-19
Oct-19
Nov-19
Dec-19
Jan-20
Feb-20
Mar-20
Apr-20
May-20
Jun-20
Jul-20
Aug-20
Sep-20
Oct-20
Nov-20
Dec-20
Jan-21
Feb-21
Mar-21
Apr-21
May-21
Jun-21
Jul-21
Aug-21
Sep-21
Oct-21
Nov-21
Dec-21
Gross International Reserves (valuation adjusted)
Net International Reserves (BB definition)
Reserves (months of imports, valuation adjusted, RHS)
75
80
85
90
80
100
120
140
160
Dec-18
Feb-19
Apr-19
Jun-19
Aug-19
Oct-19
Dec-19
Feb-20
Apr-20
Jun-20
Aug-20
Oct-20
Dec-20
Feb-21
Apr-21
Jun-21
Aug-21
Oct-21
Dec-21
Nominal Effective Exchange Rate (2010=100)
Real Effective Exchange Rate (2010=100)
Taka per USD (Period average, RHS)
-20
0
20
40
60
Opening Settlement Opening Settlement Opening Settlement Opening Settlement Opening Settlement
FY19 FY20 FY21 FY22 (Jul-Sep) FY22 (Jul-Nov)
Consumer Goods Capital Machinery Intermediate Goods
Petroleum Industrial Raw Materials Others
Total
4. 4
Bangladesh: Fiscal Sector Developments 1/
Total revenue-GDP ratio, in FY22 (Jul-Jan), was 4.7 percent
compared with 5.8 in FY21 (Jul-Jan). VAT and the
supplementary duties-GDP ratio, during the same period,
decreased from 2.5 percent to 2.3.
Central Government Revenue
FY16-FY22 (Jul-Jan) (In percent of GDP)
Preliminary data suggests that total revenue, in FY22 (Jul-Jan),
has decreased by 7.8 percent (y/y) and the decrease in taxes on
others has had the largest impact.
Contribution to Total Revenue Generation
FY16-FY22 (Jul-Jan) (In percentage points)
Total expenditure-GDP ratio, in FY22 (Jul-Jan), decreased from
6.3 percent to 5.2 percent. During the same period, ADP
execution decreased from 1.4 percent to 1.3 percent of GDP.
Central Government (CG) Expenditure
FY16-FY22 (Jul-Jan) (In percent of GDP)
Total expenditure, in FY22 (Jul-Jan), decreased by 7.3 percent
(y/y), where interest payments contributed 1.8 percentage
points.
Contributions to CG’s Expenditure Growth
FY16-FY22 (Jul-Jan), (y/y, In percentage points)
Compared to the same period in the previous FY, the budget
deficit in FY22 (Jul – Jan) has been primarily financed by bank
borrowing.
Fiscal Balance and Sources of Financing
FY16-FY22 (Jul-Jan) (Billion Taka)
Total central government debt, at end-Jan 2022, reached 36.2
percent of GDP from 38.9 percent of GDP at end-Jun 2021.
Domestic debt accounts for roughly two thirds of the total
central government debt.
Central Government Debt
Jun 2016-Jan 2022 (In percent of GDP)
1/ FY21 fiscal data is provisional outturn from Bangladesh Bureau of Statistics (BBS) based on FY2005/06. FY22 (Jul-Jan) GDP data is annualized using
provisional GDP estimate of Bangladesh Bureau of Statistics (BBS).
Sources: Office of the Controller General of Accounts (CGA), Ministry of Finance; and IMF Staff calculations
0
5
10
15
FY16 FY17 FY18 FY19 FY20 FY21 FY21
(Jul-Jan)
FY22
(Jul-Jan)
Other VAT and supplementary duties
Customs duties Taxes on income and profits
Total revenue
-15
5
25
FY16 FY17 FY18 FY19 FY20 FY21 FY22 (Jul-
Jan)
Other VAT and supplementary duties
Customs duties Taxes on income and profits
Total revenue
0
4
8
12
16
FY16 FY17 FY18 FY19 FY20 FY21 FY21
(Jul-Jan)
FY22
(Jul-Jan)
Pay and allowances Subsidies, transfer and net lending
Annual development programme (ADP) Interest payments
Other expenditure Total Expenditure
-20
-10
0
10
20
30
FY16 FY17 FY18 FY19 FY20 FY21 FY22
(Jul-Jan)
Pay and allowances Subsidies, transfer and net lending
Annual development programme (ADP) Interest payments
Other expenditure Total Expenditure
-1000
0
1000
2000
FY16 FY17 FY18 FY19 FY20 FY21 FY21
(Jul-Jan)
FY22
(Jul-Jan)
Net domestic financing: nonbanks, except NSD
Net domestic financing: NSD
Net domestic financing: banks
Net external financing
Net Finacing
0
10
20
30
40
Jun-16 Jun-17 Jun-18 Jun-19 Jun-20 Jun-21 Jan-22
External debt Domestic debt
5. 5
Bangladesh: Monetary and Financial Market Developments
Reserve money, at end-Dec 2021, grew by 6.5 percent (y/y)
compared with 21.2 percent (y/y) in Dec 2020, mainly driven by
net foreign assets.
Contributions to Reserve Money Growth
Dec 2018-Dec 2021 (y/y, in percentage points)
Broad money (M2), at end-Nov 2021, grew by 10.2 percent with
private sector credit and net foreign assets contributing 7.8 and
1.4 percentage points, respectively, to this growth.
Contributions to Broad Money (M2) Growth
Nov 2018-Nov 2021 (y/y, in percentage points)
Broad money (M3) growth reached 9.9 percent, in Nov 2021,
with M2 and NSC sales accounting for 8.3 and 1.8 percentage
points respectively.
Contributions to Broad Money (M3) Growth
Nov 2018-Nov 2021 (y/y, in percentage points)
Interest rates, which had been on an increasing trend-have
started to decrease.
Interest Rates 1/
Mar 2019-Jan 2022 (in percentage points)
Excess liquid assets (as percent of total demand and time
liabilities), in Dec 2021, reached 15.4 percent compared with
15.9 percent in Dec 2020.
Excess Liquid Assets (as percent of total time and
demand liabilities)
Feb 2019-Dec 2021
Growth of bank advances to the private sector remained flat at
around 8.7 percent in Q1 FY22. The growth was mostly driven
by advances to trade and commerce, and industrial term loan.
Contributions to Growth of Bank Advances (Private
Sector) by Economic Purposes
FY16- Q1 FY22 (y/y, in percentage points)
1/ Deposit and Lending rate are as on November 30th
, 2021.
2/ Excess Liquidity is statutory liquidity eligible liquid assets of banks minus statutory liquidity (excluding cash reserve). Excess Reserve is balance with
Bangladesh Bank in local currency minus required cash reserve. These are provisional data taken from Bangladesh Bank’s Department of Off-Site
Supervision.
Sources: Bangladesh Bank; and IMF Staff calculations
-20
-10
0
10
20
30
40
Dec-18
Feb-19
Apr-19
Jun-19
Aug-19
Oct-19
Dec-19
Feb-20
Apr-20
Jun-20
Aug-20
Oct-20
Dec-20
Feb-21
Apr-21
Jun-21
Aug-21
Oct-21
Dec-21
Net foreign assets Net claims on government
Claims on DMBs Non-reserve liabilities to DMBs
Other net domestic assets Reserve Money
-5
0
5
10
15
20
Nov-18
Jan-19
Mar-19
May-19
Jul-19
Sep-19
Nov-19
Jan-20
Mar-20
May-20
Jul-20
Sep-20
Nov-20
Jan-21
Mar-21
May-21
Jul-21
Sep-21
Nov-21
Other domestic assets Claims on the private sector
Net claims on central government Net foreign assets
Broad money
-2
0
2
4
6
8
10
12
14
Nov-18
Jan-19
Mar-19
May-19
Jul-19
Sep-19
Nov-19
Jan-20
Mar-20
May-20
Jul-20
Sep-20
Nov-20
Jan-21
Mar-21
May-21
Jul-21
Sep-21
Nov-21
Other
M2
National Savings Certificates (NSC)
Broad Money (M3)
0
2
4
6
8
10
Mar-19
May-19
Jul-19
Sep-19
Nov-19
Jan-20
Mar-20
May-20
Jul-20
Sep-20
Nov-20
Jan-21
Mar-21
May-21
Jul-21
Sep-21
Nov-21
Jan-22
Deposit Rate Lending Rate
Call Money Rate 91-DAY TREASURY BILLS
2-YEAR TREASURY BONDS
0
4
8
12
16
20
Feb-19
Mar-19
Apr-19
May-19
Dec-19
Jan-20
Mar-20
Jun-20
Jul-20
Aug-20
Oct-20
Dec-20
Jan-21
Mar-21
Apr-21
Jun-21
Jul-21
Sep-21
Oct-21
Nov-21
Dec-21
State-owned Banks Specialised Banks
Private Banks (Other than Islamic) Islamic Banks
Foreign Banks Total
-2
2
6
10
14
18
FY16 FY17 FY18 FY19 FY20 FY21 Q1 FY22
Others Consumer finance
Other Institutional loan Trade & Commerce
Transport Construction
Industry: Working capital financing Industry: Term loan
Agriculture: Others Agriculture: Crops
Total
6. 6
Bangladesh: Monetary and Financial Market Developments… Contd.
The loan-to-deposit ratio, in Nov 2021, reached 80.8 percent
from 81.6 percent in Apr 2021. During the period, the ratio
(excluding government deposits) decreased from 87.4 percent to
86.5 percent.
Loan-to-Deposit Ratio
Jan 2019-Nov 2021 (in percent)
CAR of the banking industry, at Sep 2021, decreased to 11.2
from 11.6 percent in Dec 2020. CAR of the SOBs, in Sep 2021,
increased to 6.3 percent from 4.3 percent in Dec 2020
remaining below the regulatory requirement of 10 percent.
Capital Adequacy Ratio (CAR)
Dec 2016-Sep 2021 (in percent)
Banking sector’s NPL ratio, in Sep 2021, increased to 8.1
percent from 7.7 percent in Dec 2020. In SOBs, the ratio
remained at about 20.1 percent, and increased to 5.5 percent in
the case of PCBs.
Non-Performing Loan (NPL) Ratio 1/
Dec 2016-Sep 2021 (in percent of loans)
Stressed advances in the banking industry (sum of NPLs,
rescheduled and restructured loans), at end-Dec 2018,
accounted for 20.5 percent of outstanding loans.
Stressed Advances
Dec 2012-Dec 2018 (in percent of loans)
Banking sector advance, at end-Q2 FY22, reached Tk.11579
billion, where private commercial banks accounted for Tk. 8680
billion.
Banking Sector Advance
(FY16-Q1 FY22) (in billion Taka)
The 3-mma DSE broad index, turnover, and price volatility,
which had been picked up since May 2021, is starting to trend
down.
Dhaka Stock Market Performance 1/
Dec 2018-Dec 2021 (3-month moving average)
1/ Due to the COVID-19 pandemic, in Apr 2020 there was no stock market transaction.
Sources: Bangladesh Bank; and IMF Staff calculations
70
80
90
100
Jan-19
Mar-19
May-19
Jul-19
Sep-19
Nov-19
Jan-20
Mar-20
May-20
Jul-20
Sep-20
Nov-20
Jan-21
Mar-21
May-21
Jul-21
Sep-21
Nov-21
Loan-to-deposit ratio
Loan-to-deposit ratio (excl. govt. deposits)
0
5
10
15
20
25
30
Dec-16
Dec-17
Dec-18
Dec-19
Jun-20
Dec-20
Jun-21
Sep-21
Dec-16
Dec-17
Dec-18
Dec-19
Jun-20
Dec-20
Jun-21
Sep-21
Dec-16
Dec-17
Dec-18
Dec-19
Jun-20
Dec-20
Jun-21
Sep-21
Dec-16
Dec-17
Dec-18
Dec-19
Jun-20
Dec-20
Jun-21
Sep-21
Banking Sector SOBs PCBs FCBs
0
10
20
30
40
Dec-16
Dec-17
Dec-18
Dec-19
Dec-20
Sep-21
Dec-16
Dec-17
Dec-18
Dec-19
Dec-20
Sep-21
Dec-16
Dec-17
Dec-18
Dec-19
Dec-20
Sep-21
Dec-16
Dec-17
Dec-18
Dec-19
Dec-20
Sep-21
Banking Sector SOBs PCBs FCBs
0
5
10
15
20
25
Dec-12 Dec-13 Dec-14 Dec-15 Dec-16 Dec-17 Dec-18
NPL Stressed Advances
0
4000
8000
12000
FY16 FY17 FY18 FY19 FY20 FY21 Q1 FY22
Foreign commercial banks
Private commercial banks
Specialised banks
State owned commercial banks
Total
0
100
200
300
400
500
4000
4500
5000
5500
6000
6500
7000
7500
Dec-18
Feb-19
Apr-19
Jun-19
Aug-19
Oct-19
Dec-19
Feb-20
Apr-20
Jun-20
Aug-20
Oct-20
Dec-20
Feb-21
Apr-21
Jun-21
Aug-21
Oct-21
Dec-21
DSE Broad Index
Turnover (in billions of Taka, RHS)
Price Volatility (3 months moving standard deviation, RHS)