Global Taxation Arbitrage
•Download as XLS, PDF•
2 likes•818 views

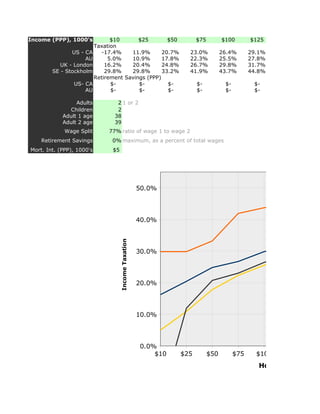
This spreadsheet computes taxation rates for different locations, for different salaries. Currently included are: - US / California - Australia - UK (old data) - Sweden (old data) Computed rates include income taxes, major tax rebates, local taxes (where applicable), retirement tax rebates. In the US it also includes Social Security as a tax (since it's unlike that it's anything but that to anyone under 50 now). Rates are compared across countries using Purchasing Power Parities. Note that I created this spreadsheet a while back, and only quickly updated it recently. Therefore, take all figures with a grain of salt, and verify them for yourselves. Suggestions and updates gratefully accepted.

Recommended
Recommended
More Related Content
What's hot
What's hot (18)
Similar to Global Taxation Arbitrage
Similar to Global Taxation Arbitrage (20)
More from Mark Nottingham
Recently uploaded
Recently uploaded (20)
Global Taxation Arbitrage
- 1. Income (PPP), 1000's $10 $25 $50 $75 $100 $125 Taxation US - CA -17.4% 11.9% 20.7% 23.0% 26.4% 29.1% AU 5.0% 10.9% 17.8% 22.3% 25.5% 27.8% UK - London 16.2% 20.4% 24.8% 26.7% 29.8% 31.7% SE - Stockholm 29.8% 29.8% 33.2% 41.9% 43.7% 44.8% Retirement Savings (PPP) US- CA $- $- $- $- $- $- AU $- $- $- $- $- $- Adults 2 1 or 2 Children 2 Adult 1 age 38 Adult 2 age 39 Wage Split 77% ratio of wage 1 to wage 2 Retirement Savings 0% maximum, as a percent of total wages Mort. Int. (PPP), 1000's $5 50.0% 40.0% Income Taxation 30.0% 20.0% 10.0% 0.0% $10 $25 $50 $75 $100 $125 $150 Household Earne
- 2. $1 $1 Tax-Free Retirement Contributions (PPP) $1 $1 $1 $1 $0 $0 $0 $0 $- $10 $25 $50 $75 $100 $125 $150 $17 Household Earned Inc
- 3. $150 $175 $200 $225 $250 $275 $300 $325 $350 30.5% 31.8% 32.9% 33.8% 34.9% 35.9% 36.7% 37.3% 37.9% 29.4% 30.7% 32.3% 33.5% 34.4% 35.4% 36.2% 36.8% 37.4% 32.9% 33.8% 34.5% 34.9% 35.2% 35.7% 36.2% 36.5% 36.8% 46.1% 47.1% 49.4% 50.0% 50.5% 50.9% 51.2% 51.5% 51.7% $- $- $- $- $- $- $- $- $- $- $- $- $- $- $- $- $- $- 1-Jul-2004 Notes Copyright 2004, Mark Nottingham <mnot@pobox.com>. Some Rights Reserved. Not warranted for any purpose. 77 0 SE - Stockholm UK - London AU US - CA 75 $100 $125 $150 $175 $200 $225 $250 $275 $300 $325 $350 Household Earned Income (PPP), 1000's
- 4. AU US- CA 100 $125 $150 $175 $200 $225 $250 $275 $300 $325 $350 Household Earned Income (PPP), 1000's
- 5. E - Stockholm K - London U S - CA 325 $350
- 7. United States - California (all amounts are annual and in local currency, unless marked as PPP) Gross Income (PPP) $10,000.00 $25,000.00 $50,000.00 $75,000.00 $100,000.00 $125,000.00 $150,000.00 $175,000.00 $200,000.00 $225,000.00 $250,000.00 Gross Income $10,000.00 $25,000.00 $50,000.00 $75,000.00 $100,000.00 $125,000.00 $150,000.00 $175,000.00 $200,000.00 $225,000.00 $250,000.00 Wage 1 $7,700.00 $19,250.00 $38,500.00 $57,750.00 $77,000.00 $96,250.00 $115,500.00 $134,750.00 $154,000.00 $173,250.00 $192,500.00 Wage 2 $2,300.00 $5,750.00 $11,500.00 $17,250.00 $23,000.00 $28,750.00 $34,500.00 $40,250.00 $46,000.00 $51,750.00 $57,500.00 Gross Wages $10,000.00 $25,000.00 $50,000.00 $75,000.00 $100,000.00 $125,000.00 $150,000.00 $175,000.00 $200,000.00 $225,000.00 $250,000.00 Retirement Savings 1 $- $- $- $- $- $- $- $- $- $- $- Retirement Savings 2 $- $- $- $- $- $- $- $- $- $- $- Healthcare $(1,500.00) $(1,500.00) $(1,500.00) $(1,500.00) $(1,500.00) $(1,500.00) $(1,500.00) $(1,500.00) $(1,500.00) $(1,500.00) $(1,500.00) Mortgate Interest $(5,000.00) $(5,000.00) $(5,000.00) $(5,000.00) $(5,000.00) $(5,000.00) $(5,000.00) $(5,000.00) $(5,000.00) $(5,000.00) $(5,000.00) Standard Deduction (Fed) $(9,500.00) $(9,500.00) $(9,500.00) $(9,500.00) $(9,500.00) $(9,500.00) $(9,500.00) $(9,500.00) $(9,500.00) $(9,500.00) $(9,500.00) Taxable Income (Fed) $- $9,000.00 $34,000.00 $59,000.00 $84,000.00 $109,000.00 $134,000.00 $159,000.00 $184,000.00 $209,000.00 $234,000.00 Federal Tax $- $(900.00) $(4,265.00) $(8,015.00) $(13,375.00) $(19,625.00) $(25,875.00) $(32,783.50) $(39,783.50) $(46,791.00) $(55,041.00) Standard Deduction (State) $(6,140.00) $(6,140.00) $(6,140.00) $(6,140.00) $(6,140.00) $(6,140.00) $(6,140.00) $(6,140.00) $(6,140.00) $(6,140.00) $(6,140.00) Taxable Income (State) $- $12,360.00 $37,360.00 $62,360.00 $87,360.00 $112,360.00 $137,360.00 $162,360.00 $187,360.00 $212,360.00 $237,360.00 State Tax $- $(154.50) $(777.04) $(2,029.98) $(3,872.68) $(6,190.79) $(8,578.29) $(10,965.79) $(13,353.29) $(15,740.79) $(18,128.29) Social Security $(620.00) $(1,550.00) $(3,100.00) $(4,650.00) $(6,200.00) $(7,232.30) $(7,588.80) $(7,945.30) $(8,301.80) $(8,658.30) $(9,014.80) Medicare $(145.00) $(362.50) $(725.00) $(1,087.50) $(1,450.00) $(1,812.50) $(2,175.00) $(2,537.50) $(2,900.00) $(3,262.50) $(3,625.00) Earned Income Credit $4,000.00 $1,499.75 $- $- $- $- $- $- $- $- $- Net Income $13,235.00 $23,532.75 $41,132.96 $59,217.52 $75,102.32 $90,139.41 $105,782.91 $120,767.91 $135,661.41 $150,547.41 $164,190.91 Effective Tax Rate -32.4% 5.9% 17.7% 21.0% 24.9% 27.9% 29.5% 31.0% 32.2% 33.1% 34.3% Net Income (incl. health) $11,735.00 $22,032.75 $39,632.96 $57,717.52 $73,602.32 $88,639.41 $104,282.91 $119,267.91 $134,161.41 $149,047.41 $162,690.91 Effective Tax Rate (incl. health) -17.4% 11.9% 20.7% 23.0% 26.4% 29.1% 30.5% 31.8% 32.9% 33.8% 34.9% Retirement Savings (PPP) $- $- $- $- $- $- $- $- $- $- $- Adults 2 1 or 2 Children 2 Adult 1 age 38 Adult 2 age 39 Healthcare $(1,500.00) cost of heath insurance Wage Split 77% ratio of wage 1 to wage 2 Retirement Savings 0% as a percent of wages Assumptions No itemized deductions Two adults are married filing jointly Retirement saving is 401k, capped at the maximum tax-free amount available Does not (yet) consider: capital gains, state or federal tax credits (e.g., child tax credit), traditional IRAs Unknown sales tax is included in PPP Does not include IRAs or interest income Federal Schedule X income > income < tax is this plus this of amount over (Single) $- $8,350.00 $- 10.00% $- source $8,350.00 $33,950.00 $835.00 15.00% $8,350.00 $33,950.00 $82,250.00 $4,675.00 25.00% $33,950.00 $82,250.00 $171,550.00 $16,750.00 28.00% $82,250.00 $171,550.00 $372,950.00 $41,754.00 33.00% $171,550.00 $372,950.00 $108,216.00 35.00% $372,950.00 Federal Schedule Y-1 income > income < tax is this plus this of amount over (Married) $- $16,700.00 $- 10.00% $- source $16,700.00 $67,900.00 $1,670.00 15.00% $16,700.00 $67,900.00 $137,050.00 $9,350.00 25.00% $67,900.00 $137,050.00 $208,850.00 $26,637.50 28.00% $137,050.00 $208,850.00 $372,950.00 $46,741.50 33.00% $208,850.00 $372,950.00 $100,894.50 35.00% $372,950.00 CA Schedule X income > income < tax is this plus this of amount over (single) $- $7,060.00 $- 1.25% $- source $7,060.00 $16,739.00 $88.25 2.25% $7,060.00 $16,739.00 $26,419.00 $306.03 4.25% $16,739.00 $26,419.00 $36,675.00 $717.43 6.25% $26,419.00 $36,675.00 $46,349.00 $1,358.43 8.25% $36,675.00 $46,349.00 $2,156.53 9.55% $46,349.00 CA Schedule Y income > income < tax is this plus this of amount over (married) $- $14,120.00 $- 1.25% $- source $14,120.00 $33,478.00 $176.50 2.25% $14,120.00 $33,478.00 $52,838.00 $612.06 4.25% $33,478.00 $52,838.00 $73,350.00 $1,434.86 6.25% $52,838.00 $73,350.00 $92,698.00 $2,716.86 8.25% $73,350.00 $92,698.00 $4,313.07 9.55% $92,698.00 401k Contribution Theshold age > age < threshold source 0 50 $12,000.00 50 $14,000.00 Earned Income Tax Credit children rate limit threshold phase-out rate 2001 0 7.65% $4,670.00 $5,950.00 7.65% source 1 34.00% $7,140.00 $13,090.00 15.98% 2 40.00% $10,020.00 $13,090.00 21.06%
- 8. $275,000.00 $300,000.00 $325,000.00 $350,000.00 $275,000.00 $300,000.00 $325,000.00 $350,000.00 $211,750.00 $231,000.00 $250,250.00 $269,500.00 $63,250.00 $69,000.00 $74,750.00 $80,500.00 $275,000.00 $300,000.00 $325,000.00 $350,000.00 $- $- $- $- $- $- $- $- $(1,500.00) $(1,500.00) $(1,500.00) $(1,500.00) $(5,000.00) $(5,000.00) $(5,000.00) $(5,000.00) $(9,500.00) $(9,500.00) $(9,500.00) $(9,500.00) $259,000.00 $284,000.00 $309,000.00 $334,000.00 $(63,291.00) $(71,541.00) $(79,791.00) $(88,041.00) $(6,140.00) $(6,140.00) $(6,140.00) $(6,140.00) $262,360.00 $287,360.00 $312,360.00 $337,360.00 $(20,515.79) $(22,903.29) $(25,290.79) $(27,678.29) $(9,371.30) $(9,727.80) $(10,084.30) $(10,440.80) $(3,987.50) $(4,350.00) $(4,712.50) $(5,075.00) $- $- $- $- $177,834.41 $191,477.91 $205,121.41 $218,764.91 35.3% 36.2% 36.9% 37.5% $176,334.41 $189,977.91 $203,621.41 $217,264.91 35.9% 36.7% 37.3% 37.9% $- $- $- $-
- 10. Working Wife 0,.25,.5 Page 10
- 11. Australia (all amounts are annual and in local currency, unless marked as PPP) Gross Income (PPP) $10,000.00 $25,000.00 $50,000.00 $75,000.00 $100,000.00 $125,000.00 $150,000.00 $175,000.00 $200,000.00 $225,000.00 $250,000.00 Gross Income $13,700.00 $34,250.00 $68,500.00 $102,750.00 $137,000.00 $171,250.00 $205,500.00 $239,750.00 $274,000.00 $308,250.00 $342,500.00 Gross Wages $13,700.00 $34,250.00 $68,500.00 $102,750.00 $137,000.00 $171,250.00 $205,500.00 $239,750.00 $274,000.00 $308,250.00 $342,500.00 Wage 1 $10,549.00 $26,372.50 $52,745.00 $79,117.50 $105,490.00 $131,862.50 $158,235.00 $184,607.50 $210,980.00 $237,352.50 $263,725.00 Retirement Savings 1 $- $- $- $- $- $- $- $- $- $- $- Taxable Income 1 $10,549.00 $26,372.50 $52,745.00 $79,117.50 $105,490.00 $131,862.50 $158,235.00 $184,607.50 $210,980.00 $237,352.50 $263,725.00 Tax 1 $(682.35) $(3,055.88) $(9,823.50) $(17,735.25) $(27,686.20) $(37,707.75) $(47,729.30) $(58,073.38) $(69,941.00) $(81,808.63) $(93,676.25) Medicare 1 $- $(395.59) $(791.18) $(1,186.76) $(1,582.35) $(1,977.94) $(2,373.53) $(2,769.11) $(3,164.70) $(3,560.29) $(3,955.88) Wage 2 $3,151.00 $7,877.50 $15,755.00 $23,632.50 $31,510.00 $39,387.50 $47,265.00 $55,142.50 $63,020.00 $70,897.50 $78,775.00 Retirement Savings 2 $- $- $- $- $- $- $- $- $- $- $- Taxable Income 2 $3,151.00 $7,877.50 $15,755.00 $23,632.50 $31,510.00 $39,387.50 $47,265.00 $55,142.50 $63,020.00 $70,897.50 $78,775.00 Tax 2 $- $(281.63) $(1,463.25) $(2,644.88) $(3,826.50) $(5,816.25) $(8,179.50) $(10,542.75) $(12,906.00) $(15,269.25) $(17,632.50) Medicare 2 $- $- $(138.60) $(354.49) $(472.65) $(590.81) $(708.98) $(827.14) $(945.30) $(1,063.46) $(1,181.63) Medicare Surcharge $- $- $- $(1,027.50) $(1,370.00) $(1,712.50) $(2,055.00) $(2,397.50) $(2,740.00) $(3,082.50) $(3,425.00) Private Health Adjustment $- $- $- $- $- $212.50 $555.00 $897.50 $1,240.00 $1,582.50 $1,925.00 Total Tax $(682.35) $(3,733.09) $(12,216.53) $(22,948.88) $(34,937.70) $(47,592.75) $(60,491.30) $(73,712.38) $(88,457.00) $(103,201.63) $(117,946.25) Net Income $13,017.65 $30,516.91 $56,283.48 $79,801.13 $102,062.30 $123,657.25 $145,008.70 $166,037.63 $185,543.00 $205,048.38 $224,553.75 Effective Tax Rate 5.0% 10.9% 17.8% 22.3% 25.5% 27.8% 29.4% 30.7% 32.3% 33.5% 34.4% Retirement Savings $- $- $- $- $- $- $- $- $- $- $- Adults 2 1 or 2 Children 2 Adult 1 age 38 Adult 2 age 39 Healthcare $(1,500.00) cost of private healthcare Wage Split 77% ratio of wage 1 to wage 2 Retirement Savings 0% as a percent of wages Assumptions If medicare surcharge is higher than private healthcare cost, that is paid instead Does not (yet) consider: capital gains, tax credits Retirement saving is superannuation, capped at the maximum tax-free amount available GST is included in PPP Individual Tax Rates income > income < tax is this plus this of amount over source $- $6,000.00 $- 0% $- 2009-10 $6,000.00 $34,000.00 $- 15% $6,000.00 $34,000.00 $80,000.00 $4,200.00 30% $34,000.00 $80,000.00 $180,000.00 $18,000.00 38% $80,000.00 $180,000.00 $56,000.00 45% $180,000.00 Medicare Levy income > income < tax is this plus this of amount over source $- $15,062.00 $- 0% $- $15,062.00 $16,283.00 $- 20% $15,062.00 $16,283.00 $- 1.5% $- Medicare Levy # dependents threshold Surcharge Threshold 0 $100,000.00 (family) 1 $100,000.00 2 $101,500.00 3 $103,000.00 4 $104,500.00 5 $106,000.00 Super Contribution Threshold age > age < threshold source 0 34 $13,934.00 34 48 $38,702.00 49 $95,980.00
- 12. $275,000.00 $300,000.00 $325,000.00 $350,000.00 $376,750.00 $411,000.00 $445,250.00 $479,500.00 $376,750.00 $411,000.00 $445,250.00 $479,500.00 $290,097.50 $316,470.00 $342,842.50 $369,215.00 $- $- $- $- $290,097.50 $316,470.00 $342,842.50 $369,215.00 $(105,543.88) $(117,411.50) $(129,279.13) $(141,146.75) $(4,351.46) $(4,747.05) $(5,142.64) $(5,538.23) $86,652.50 $94,530.00 $102,407.50 $110,285.00 $- $- $- $- $86,652.50 $94,530.00 $102,407.50 $110,285.00 $(20,527.95) $(23,521.40) $(26,514.85) $(29,508.30) $(1,299.79) $(1,417.95) $(1,536.11) $(1,654.28) $(3,767.50) $(4,110.00) $(4,452.50) $(4,795.00) $2,267.50 $2,610.00 $2,952.50 $3,295.00 $(133,223.08) $(148,597.90) $(163,972.73) $(179,347.55) $243,526.93 $262,402.10 $281,277.28 $300,152.45 35.4% 36.2% 36.8% 37.4% $- $- $- $-
- 14. United Kingdom - London (all amounts are annual and in local currency, unless marked as PPP) Gross Income (PPP) $10,000.00 $25,000.00 $50,000.00 $75,000.00 $100,000.00 $125,000.00 $150,000.00 $175,000.00 $200,000.00 $225,000.00 $250,000.00 Gross Income £6,380.00 £15,950.00 £31,900.00 £47,850.00 £63,800.00 £79,750.00 £95,700.00 £111,650.00 £127,600.00 £143,550.00 £159,500.00 Gross Wages £6,380.00 £15,950.00 £31,900.00 £47,850.00 £63,800.00 £79,750.00 £95,700.00 £111,650.00 £127,600.00 £143,550.00 £159,500.00 Wage 1 £4,912.60 £12,281.50 £24,563.00 £36,844.50 £49,126.00 £61,407.50 £73,689.00 £85,970.50 £98,252.00 £110,533.50 £122,815.00 Retirement Savings 1 £- £- £- £- £- £- £- £- £- £- £- Personal Allowance 1 -£4,745.00 -£4,745.00 -£4,745.00 -£4,745.00 -£4,745.00 -£4,745.00 -£4,745.00 -£4,745.00 -£4,745.00 -£4,745.00 -£4,745.00 Taxable Income 1 £167.60 £7,536.50 £19,818.00 £32,099.50 £44,381.00 £56,662.50 £68,944.00 £81,225.50 £93,507.00 £105,788.50 £118,070.00 Tax 1 -£16.76 -£1,415.63 -£4,117.56 -£6,945.40 -£11,858.00 -£16,770.60 -£21,683.20 -£26,595.80 -£31,508.40 -£36,421.00 -£41,333.60 NI 1 -£19.87 -£830.45 -£2,181.41 -£3,019.93 -£3,142.74 -£3,265.56 -£3,388.37 -£3,511.19 -£3,634.00 -£3,756.82 -£3,879.63 Wage 2 £1,467.40 £3,668.50 £7,337.00 £11,005.50 £14,674.00 £18,342.50 £22,011.00 £25,679.50 £29,348.00 £33,016.50 £36,685.00 Retirement Savings 2 £- £- £- £- £- £- £- £- £- £- £- Personal Allowance 2 -£4,745.00 -£4,745.00 -£4,745.00 -£4,745.00 -£4,745.00 -£4,745.00 -£4,745.00 -£4,745.00 -£4,745.00 -£4,745.00 -£4,745.00 Taxable Income 2 £- £- £2,592.00 £6,260.50 £9,929.00 £13,597.50 £17,266.00 £20,934.50 £24,603.00 £28,271.50 £31,940.00 Tax 2 £- £- -£327.84 -£1,134.91 -£1,941.98 -£2,749.05 -£3,556.12 -£4,363.19 -£5,170.26 -£5,977.33 -£6,881.60 NI 2 £- £- -£286.55 -£690.09 -£1,093.62 -£1,497.16 -£1,900.69 -£2,304.23 -£2,707.76 -£2,981.65 -£3,018.33 Council Tax -£1,000.00 -£1,000.00 -£1,000.00 -£1,000.00 -£1,000.00 -£1,000.00 -£1,000.00 -£1,000.00 -£1,000.00 -£1,000.00 -£1,000.00 Total Tax -£1,036.63 -£3,246.08 -£7,913.36 -£12,790.32 -£19,036.34 -£25,282.36 -£31,528.38 -£37,774.40 -£44,020.42 -£50,136.79 -£56,113.16 Net Income £5,343.37 £12,703.93 £23,986.64 £35,059.68 £44,763.66 £54,467.64 £64,171.62 £73,875.60 £83,579.58 £93,413.21 £103,386.84 Effective Tax Rate 16.2% 20.4% 24.8% 26.7% 29.8% 31.7% 32.9% 33.8% 34.5% 34.9% 35.2% Adults 2 1 or 2 Children 2 Adult 1 age 38 Adult 2 age 39 Healthcare -£1,500.00 cost of private healthcare Council Tax -£1,000.00 http://www.rbkc.gov.uk/LocalTaxes/counciltax/bands.asp; http://www.lambeth.gov.uk/counciltax/index.shtml#valuation Wage Split 77% ratio of wage 1 to wage 2 Retirement Savings 0% as a percent of wages Assumptions All retirement savings are tax-deductable (e.g., superannuation) Does not (yet) consider: capital gains, working or child tax credits, housing benefit Retirement saving is estimated and simplistic; http://www.inlandrevenue.gov.uk/pdfs/ir2008b.htm; http://www.inlandrevenue.gov.uk/pdfs/ir78.htm VAT is included in PPP Does not include ISAs or interest income Individual Tax Rates income > income < tax is this plus this of amount over source £- £2,020.00 £- 10% £- £2,020.00 £31,400.00 £202.00 22% £2,020.00 £31,400.00 £6,665.60 40% £31,400.00 National Insurance income > income < tax is this plus this of amount over (weekly) £- £91.00 £- 0% £- source £91.00 £610.00 £- 11% £91.00 £610.00 £57.09 1.0% £610.00 Personal Allowance age > Age < allowance source 0 64 £4,745.00 64 74 £6,830.00 74 £6,950.00
- 15. $275,000.00 $300,000.00 $325,000.00 $350,000.00 £175,450.00 £191,400.00 £207,350.00 £223,300.00 £175,450.00 £191,400.00 £207,350.00 £223,300.00 £135,096.50 £147,378.00 £159,659.50 £171,941.00 £- £- £- £- -£4,745.00 -£4,745.00 -£4,745.00 -£4,745.00 £130,351.50 £142,633.00 £154,914.50 £167,196.00 -£46,246.20 -£51,158.80 -£56,071.40 -£60,984.00 -£4,002.45 -£4,125.26 -£4,248.08 -£4,370.89 £40,353.50 £44,022.00 £47,690.50 £51,359.00 £- £- £- £- -£4,745.00 -£4,745.00 -£4,745.00 -£4,745.00 £35,608.50 £39,277.00 £42,945.50 £46,614.00 -£8,349.00 -£9,816.40 -£11,283.80 -£12,751.20 -£3,055.02 -£3,091.70 -£3,128.39 -£3,165.07 -£1,000.00 -£1,000.00 -£1,000.00 -£1,000.00 -£62,652.66 -£69,192.16 -£75,731.66 -£82,271.16 £112,797.34 £122,207.84 £131,618.34 £141,028.84 35.7% 36.2% 36.5% 36.8%
- 16. Source
- 17. United Kingdom - London (all amounts are annual and in local currency, unless marked as PPP) Gross Income (PPP) $10,000.00 $25,000.00 $50,000.00 $75,000.00 $100,000.00 $125,000.00 $150,000.00 $175,000.00 $200,000.00 Gross Income 96,900.00 kr 242,250.00 kr 484,500.00 kr 726,750.00 kr 969,000.00 kr 1,211,250.00 kr 1,453,500.00 kr 1,695,750.00 kr 1,938,000.00 kr Gross Wages 96,900.00 kr 242,250.00 kr 484,500.00 kr 726,750.00 kr 969,000.00 kr 1,211,250.00 kr 1,453,500.00 kr 1,695,750.00 kr 1,938,000.00 kr Wage 1 74,613.00 kr 186,532.50 kr 373,065.00 kr 559,597.50 kr 746,130.00 kr 932,662.50 kr 1,119,195.00 kr 1,305,727.50 kr 1,492,260.00 kr Retirement Savings 1 - kr - kr - kr - kr - kr - kr - kr - kr - kr Taxable Income 1 74,613.00 kr 186,532.50 kr 373,065.00 kr 559,597.50 kr 746,130.00 kr 932,662.50 kr 1,119,195.00 kr 1,305,727.50 kr 1,492,260.00 kr National Tax 1 - kr - kr -16,253.00 kr -87,934.38 kr -134,567.50 kr -181,200.63 kr -227,833.75 kr -274,466.88 kr -321,100.00 kr Municipal Tax 1 -22,234.67 kr -55,586.69 kr -111,173.37 kr -166,760.06 kr -222,346.74 kr -277,933.43 kr -333,520.11 kr -389,106.80 kr -444,693.48 kr Wage 2 22,287.00 kr 55,717.50 kr 111,435.00 kr 167,152.50 kr 222,870.00 kr 278,587.50 kr 334,305.00 kr 390,022.50 kr 445,740.00 kr Retirement Savings 2 - kr - kr - kr - kr - kr - kr - kr - kr - kr Taxable Income 2 22,287.00 kr 55,717.50 kr 111,435.00 kr 167,152.50 kr 222,870.00 kr 278,587.50 kr 334,305.00 kr 390,022.50 kr 445,740.00 kr National Tax 2 - kr - kr - kr - kr - kr - kr -8,501.00 kr -19,644.50 kr -59,470.00 kr Municipal Tax 2 -6,641.53 kr -16,603.82 kr -33,207.63 kr -49,811.45 kr -66,415.26 kr -83,019.08 kr -99,622.89 kr -116,226.71 kr -132,830.52 kr Total Tax -28,876.20 kr -72,190.50 kr -160,634.00 kr -304,505.88 kr -423,329.50 kr -542,153.13 kr -669,477.75 kr -799,444.88 kr -958,094.00 kr Net Income 68,023.80 kr 170,059.50 kr 323,866.00 kr 422,244.13 kr 545,670.50 kr 669,096.88 kr 784,022.25 kr 896,305.13 kr 979,906.00 kr Effective Tax Rate 29.8% 29.8% 33.2% 41.9% 43.7% 44.8% 46.1% 47.1% 49.4% Adults 2 1 or 2 Children 2 Municipal Tax 29.80% http://www2.stockholm.se/english/cityofsthlm/gov/budget.htm Wage Split 77% ratio of wage 1 to wage 2 Retirement Savings 0% as a percent of wages Assumptions All retirement savings are tax-deductable (e.g., superannuation) Does not (yet) consider: capital gains, tax credits Retirement saving is estimated and simplistic VAT is included in PPP National Tax Rates income > income < tax is this plus this of amount over source - kr 291,800.00 kr - kr 0% - kr 291,800.00 kr 390,400.00 kr - kr 20% 291,800.00 kr 441,300.00 kr 58,360.00 kr 25% 441,300.00 kr
- 18. $225,000.00 $250,000.00 $275,000.00 $300,000.00 $325,000.00 $350,000.00 2,180,250.00 kr 2,422,500.00 kr 2,664,750.00 kr 2,907,000.00 kr 3,149,250.00 kr 3,391,500.00 kr 2,180,250.00 kr 2,422,500.00 kr 2,664,750.00 kr 2,907,000.00 kr 3,149,250.00 kr 3,391,500.00 kr 1,678,792.50 kr 1,865,325.00 kr 2,051,857.50 kr 2,238,390.00 kr 2,424,922.50 kr 2,611,455.00 kr - kr - kr - kr - kr - kr - kr 1,678,792.50 kr 1,865,325.00 kr 2,051,857.50 kr 2,238,390.00 kr 2,424,922.50 kr 2,611,455.00 kr -367,733.13 kr -414,366.25 kr -460,999.38 kr -507,632.50 kr -554,265.63 kr -600,898.75 kr -500,280.17 kr -555,866.85 kr -611,453.54 kr -667,040.22 kr -722,626.91 kr -778,213.59 kr 501,457.50 kr 557,175.00 kr 612,892.50 kr 668,610.00 kr 724,327.50 kr 780,045.00 kr - kr - kr - kr - kr - kr - kr 501,457.50 kr 557,175.00 kr 612,892.50 kr 668,610.00 kr 724,327.50 kr 780,045.00 kr -73,399.38 kr -87,328.75 kr -101,258.13 kr -115,187.50 kr -129,116.88 kr -143,046.25 kr -149,434.34 kr -166,038.15 kr -182,641.97 kr -199,245.78 kr -215,849.60 kr -232,453.41 kr -1,090,847.00 kr -1,223,600.00 kr -1,356,353.00 kr -1,489,106.00 kr -1,621,859.00 kr -1,754,612.00 kr 1,089,403.00 kr 1,198,900.00 kr 1,308,397.00 kr 1,417,894.00 kr 1,527,391.00 kr 1,636,888.00 kr 50.0% 50.5% 50.9% 51.2% 51.5% 51.7%
- 19. Source
- 20. Country PPP source US 1.000 AU 1.370 UK 0.638 SE 9.690