1. LC-Solutions SOP
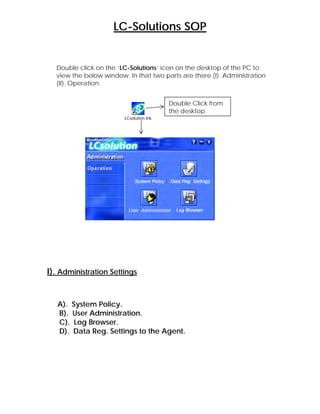
Double click on the ‘LC-Solutions’ icon on the desktop of the PC to
view the below window. In that two parts are there (I). Administration
(II). Operation.
LCsolution.lnk
I). Administration Settings
A). System Policy.
B). User Administration.
C). Log Browser.
D). Data Reg. Settings to the Agent.
Double Click from
the desktop.
2. A). System Policy.
1. When we click on the <Administration>-<System policy> we find the
blow window opens & here we have to enter User Name: Admin (by
default) & Password: none. And then click on OK to display the below
system policy window.
Click ok
Level has to be
selected for the
securities of the
system.
Default window
3. 2. There are 4 levels in the system policy, which an administrator can set
as shown above. Level1 is totally non-compliance mode, Level2 & 3 are
partially-compliance mode & Part 21CFR is totally compliance mode.
Click on any of the levels to set a system policy & click Ok as shown
below.
3. When we select in the system policy window Level 21 CFR we get the
below system policy settings as shown.
Click
Selecting 21 CFR
Level
Window after selecting
the 21 CFR Level
4. B). User Administration.
1. When we click <Administrator>-<User administrator> we get the below
window of User Administrator. Where in we can create users & there
operations what they can perform in On Line & Off line of the instrument.
To Add or
view User’s list
To Add or
view Groups
To change
the
5. 2. Here we can create a new Group & user and we can select the rights
for that particular group & user and assign rights to that particular group.
To Add New
Group.
Available rights for
that particular
group will be listed.
To add new user
6. 3. In the same way if we want to create a User click on User option in the
User Administration window & give User Name as required & allot him
under the group as required.
Give Group
Name.
Available
Rights
Assigned
Rights to
that
group.
Enter the Password
Reconfirm it
Available Groups.
Selected group
for that
particular user.
7. C). Log Browser.
1. When we Click <Administration>-<Log Browser> in the LC-Solutions
Launcher menu we find the below window
Filtering
options
8. D). Data Reg. Settings to the Agent.
1. When we Click <Administration>-<Data Reg Settings> in the LC-Solutions
Launcher menu we find the below window
Select the data base in
which the data to be
collected
This has
to be
selected
for data
transfer
to agent
10. II) Instruments Operation
A). Real time.
B). Offline Editor.
C). Post Run.
D). Browser.
E). Database.
1). Double Click the LC-Solutions Icon on the PC desktop to view the
below window of the LC-Solutions Launcher Menu.
LCsolution.lnk
2). Double click <Analysis 1> icon & click OK as shown in the Above
window.
3). The Real Time Analysis window will open as shown below.
Click
Click for Real Time
Analysis.
Click for Post Run
Analysis.
Click for Quick
Browsing of data
Click for Editing Method
During Online operation
of system.
11. 4). To configure the System click on the <System Configuration > icon in
the Assistant Bar to view the window as shown below.
5). Select the Required COM port in the Above window & click OK to view
the Below window & click <Auto Configure> in the below window to
configure the HPLC system as required configure the HPLC system as
required
Assistant Bar.
Data
Acquisition
Instrument Monitor.
Instrument
parameters
12.
13. 6. To Create a Project folder for Storing the Analysis files (Method, Batch,
Data, and Report Files).Click <File>,<Select Project Folder> to open the
below window & accordingly create the folder as required with required
name as shown below.
7. Click on the below window Assistant Bar on <System Check> to perform
the System Check for the System.
14. 8. The below Window is displayed, Select the Check Level in the option as
shown below & Click on the RUN option to perform the System Check & to
view the result Click on View Results.
9.Click on the <Data Acquisition> option on the Real Time Window ,then
Click on the <Instrument Parameter> option in the Assistant Bar to feed the
System Parameters as required as shown below & save the Method as
required in the selected Project folder.
15. 11. After the Download of the Method, now next is starting single run
analysis to do so, Click in on the <Single Start> in the Assistant Bar as
shown below to open the below Window, Fill the Required Description for
the Particular Analysis Such as Data file name, Sample ID & etc. & Then
click on OK to start the Single run for the sample.
12. After the Download of the Method ,now next is Performing Batch Run
Analysis to do so, Click in on the <Batch Processing> in the Assistant Bar as
shown below to open the below Window, & click <File>,<New Batch file>
as shown below.
Click
16. 13. Click on the Assistant Bar Option called Batch <Wizard> to open the
below windows & fill accordingly to create a Batch for the Batch Run.
Click
Next
Click
Next
18. 14. After the Batch has been created as shown below Save the Batch
with the Required Name as shown below.
Click
Finish
Click to save
the batch.
19. 15. Then the Batch is created as shown in the below Window. And to Run
this Batch Click on the <Batch Start> option on the Assistant Bar as shown
below to Start the
Batch.
16. Once the Single or the Batch Run is completed Report has to be taken
Hence here is the Report Preparation as follows. Click on the below Real
Time Analysis Window, <Report format> in the Assistant bar.
To run this created
Batch Click Start
Batch.
Click to create
Report Format
20. 17. Click on the <Sample Information Properties> icon in below window &
create the Sample description to be incorporated in the Customer Report
& click OK.
18. Click on the <LC/PDA Chromatogram Properties> icon in below
window & create the Chromatogram to be incorporated in the Customer
Report & click OK
Click this
Icon
Click
This Icon
21. 19. Click on the <LC/PDA Peak Table Properties> icon in below window &
create the Peak Table to be incorporated in the Customer Report & click
OK
20. After creating the Report save the Report Format as shown below
<File>, <Save Report Format File> to save the Report as shown below.
Click
This Icon
23. Post Run Operation
1. Double Click the LC-Solutions Icon on the PC desktop to view the below
window of the LC-Solutions Launcher Menu.
2. The Below Window Will open, where in we have to enter Login ID &
Password as mentioned & Click OK.
3. The Below post Run Analysis window
Double Click
on this Icon.
Click OK.
Assistant
Bar
Data
Explorer
Calibration
curve
Compound
Table
Chromatogram
View
24. Calculation of the %RSD
1. The below post run analysis window will open.
2. From the Data explorer, Click on the Batch Icon as shown above. The
below window will open, from this Click & Drag the required Batch File
whose %RSD for Area & RT is to be calculated & drop in the window.
Click On the
Batch Icon.
25. 3. The below window will open.
4. Click on the First run of the batch file ,Right click on the same & Click on
the <Browse Data> as show below.
26. 5. The below Data file will open as shown. Now click on the <Wizard> in
the Assistant Bar to define the Peaks in the datafile.
Click.
27. 6. Click on the next icon in the below window.
7. Select the peaks & Click Next.
Click Next.
Click
Next
28. 8. Click Next in the below window.
9. Click Next in the below window.
Click
Next.
Click
Next.
29. 10. Give the Peak Name in the below window & click Next as Shown
Below.
11. Click in the <Compound Table View> from <Edit> to <View> modeas
shown below to save the Compound table. Then Click on YES.
Peak
Name
Given.
Click
Finish.
Click
View
Mode
Click
YES to
save
table.
30. 12. Click on <Method>,<QA/QC parameters> as shown
below.
13. Give the settings for <Sample Type>, <Report type> as shown below in
the <general> window.
31. 14. Click on the <Criteria> Window as shown above to view below
window give the criteria for Area & RT as shown below.
15. Click <Apply to Method> in the <Assistant Bar> as shown below & save
the method.
Click OK.
Click on
this icon
to save.
Click Save to
Save Method.
32. 16. Click OK as shown below.
17. Open the batch file whose %RSD has to be calculated as shown
below from the <Data Explorer> as shown.
Click
OK.
33. 18.Click on the <Settings> Icon from the <Assistant Bar> as shown to save
the Settings for <QA/QC> as shown below.
19. Select the Batch now & click on the <Batch Start> icon in the Assistant
Bar as shown below.
Click
here.
Then click
OK after
setting
QA/QC.
Click to
Start the
batch.
Then Click
Start.
35. 20. To browse the %RSD Report Click in the <All files> option in the data
explorer as shown in the above fig. Browse the file with what name saved
in the settings of the batch.
Calculation of the Linearity in LC-Solutions.
1. Select the Batch File Whose Linearity is to be calculated from the Data
Explorer window as shown below in the Post Run Analysis Window.
36. 2. Click on the First run of the batch file, Right click on the same & Click on
the <Browse Data> as show below.
3. The Data file opens as shown below, Now click on the <Wizard> Option
in the Assistant Bar in the below window.
Click
Wizard.
37. 4. Click Next in the below window. Keeping Calculated By: Area.
5. Select the Required Peaks & Click Next as shown below.
Click Next.
Click Next.
38. 6. In the below fig select the # of Calibration Levels & Click next.
7. Click next in the below
window.
Click Next
Click
Next.
39. 8. Give the Peak Names as required to the peaks as shown below & Click
Finish.
9. Click in the <Compound Table View> from <Edit> to <View> mode as
shown below to save the Compound table. Then Click on
YES.
Click
Finish
Click YES.
40. 10. Click YES in the below window.
11. Click <Method>, <QA/QC> Parameters as shown below.
41. 12. Select the <Sample Type>,<Report Type>(Calibration) & In the details
select<Co-relation Coefficient> as shown below.
13. Give the criteria for the Co-relation Coefficient in the below window.
Then Click ok .
Click OK.
42. 14. Click on the <Apply to Method> in the Assistant Bar to save the
Method as shown below.
15. Click ok in the below
window.
Click to save the
method.
Click Ok.
43. 16. Click <Settings> in the Assistant Bar in the below window to view the
next window.
17. Give the Name to view the result after calculation of linearity in the
QA/QC in the below Window. Then click OK.
Click
Settings
Click OK.
44. 18. Open the Batch File & Select the Batch & Click <Batch Start> in the
Assistant Bar as shown below. then click Start in the below window.
19. Click OK in the below
window.
Click Start.
45. 20. Click on the YES in the below window.
21. The Batch Start as shown below.
46. 22. After that select the Method Icon in the Data Explorer as shown below.
23. Select the Method Saved for QA/QC Parameter & Click on that, Drag
it & Drop the method on the <Calibration Curve View> to view the result
along with the calibration curve as shown below.
47. 24. To view the result Select the all files in the data explorer & browse the
file which was saved in setting option of the batch in QA/QC Option.as
shown below.
48. Calculation of the LOD LOQ & S/N in LC-Solutions
1. Inject two different known concentrations (linear) of a standard
sample/Unknown. After completion of two injections follow the below operation
procedure for finding the LOD & LOQ concentrations.
Click on Post Run Analysis window and open any one data file which you have injected
in Real time analysis. Select Compound table Wizard to define the peaks and follow the
screen instructions and
In “Quntitation” window select the parameters as per the below window during the
Wizard operation.
Window 1
After selecting the above parameters click on “Next” two times (No change in Wizard
4/5) to enter into wizard 5/5 window and enter the name and concentration of the
standard peak in Conc. 1 and 2 columns for all peaks (follow the below screen).
49. Window 2
After selecting the above parameters click on “Finish” to come out of the screen and
click on “Method” select “QA/QC Parameters”. In that select the “sample type” as
“Standard” and in “General” window and “Report type” as “Calibration”. Select the
Details of Calibration for “S/N, Detection Limit, Quantitation Limit” or follow the below
window3.
50. Window 3
Click on “S/N detail” and set absolute time for noise calculation (Normally select the
area where base line is good) minimum difference should be 1 min or follow the below
window 4.
Window4
After entering the above details click OK to come out of the screen and Click on “DL
Detail” set the parameter as per below window5
51. Window 5
Click on OK to come out of the above screen and select “QL Detail” set the parameter
as per below window6
Window 6
Click on OK for QAQC parameters window and save the data file and select “Apply to
Method” from assistant bar (left side of the window) Overwrite the method and open
batch file select two file with method which are injected for the purpose of LOD LOQ.
Select sample type as standard for both the rows and for the first row select “Initialize
calibration curve” in sample type, for the second row “Add calibration curve Level”.
Enter level 1 in first row & level 2 in 2nd row.
After saving the batch file select “Settings” click on “QAQC” enter the name of out put
result file and follow the below window7.
52. Window 7
Start the Batch Processing open the file in HTML report format file in that you can find the
expected results.