SlideShare a Scribd company logo
1 of 7
________________________________________________________________________
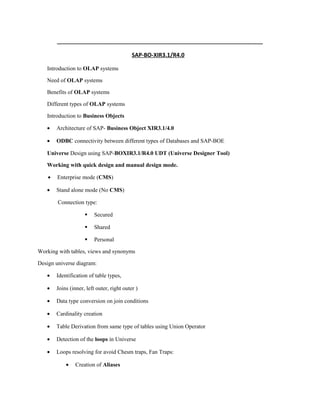
SAP-BO-XIR3.1/R4.0
Introduction to OLAP systems
Need of OLAP systems
Benefits of OLAP systems
Different types of OLAP systems
Introduction to Business Objects
• Architecture of SAP- Business Object XIR3.1/4.0
• ODBC connectivity between different types of Databases and SAP-BOE
Universe Design using SAP-BOXIR3.1/R4.0 UDT (Universe Designer Tool)
Working with quick design and manual design mode.
• Enterprise mode (CMS)
• Stand alone mode (No CMS)
Connection type:
 Secured
 Shared
 Personal
Working with tables, views and synonyms
Design universe diagram:
• Identification of table types,
• Joins (inner, left outer, right outer )
• Data type conversion on join conditions
• Cardinality creation
• Table Derivation from same type of tables using Union Operator
• Detection of the loops in Universe
• Loops resolving for avoid Chesm traps, Fan Traps:
• Creation of Aliases
• Creation of Contexts based on reporting requirements
• Creation of Shortcut joins
Creation of Classes and objects:
• Define the classes for end user requirements
• Creation of objects
 Dimensions for Analysis
 Details with associate Dimensions
 Measures at detail level and summarized level
• Global filters creation at Universe Level
• Working with standalone filters
• @Aggregate awareness for same type of measures
• @concatenation function creation
• @measure function using Measure objects
• Aggregate Navigation for Incompatible Objects
Custom Hierarchies for scope of Analysis
 Check Integrity
 Working with LOV’s
 Working with cascading LOV’s
 Organize the connections
 Working with derived tables
 Working with universe linking
Desktop Intelligence:
Introduction to query panel
Request generation in query panel
Local filter creation at reporting level using List of Values
Cascading filters using Logical Operators like AND, OR
Reports generation:
Ad-hoc reports
Standard reports
Two-dimensional reports
Multidimensional reports
• List reports: Horizontal reports, vertical reports
• Breaks creation on list reports
• Master-Detail reports
• Chart reports
Line chart, bar chart, pie-chart, etc.
• Cross-tab reports
• Group reports
• Defining Rank on report
• Assign Filter on report
• Assign alert on report
• Variables Creation at report level
Slices and dices:
Analysis of business user requirements
Generation of reporting requirements
• Saving reports in different formats: HTML, PDF, Excel, MS Word
• Generate the using predefined templates, user defined templates
• Generate the reports using predefined sql without developing model
• Generate the reports directly from the flat files, Excel sheets
• Formatting the reports
• Internal process explanation at server level
 Drilling Analysis:
• Drill through, drill down, drill up, and drill by
 Post production of the report
 Introduction to web intelligence rich client:
• Generate different types of reports same as like desktop intelligence
 Introduction to Java Info view or BI Launch Pad
• Generate different types of reports using web intelligence document same as like desktop
Intelligence
• Saving Request for end user analysis for one click actions or saving report on PC
 Dashboard Reports for multiple requirements
• My Dashboards
• Corporate Dashboards
• Creation of tabs for multiple Dashboards
• Dashboards using free form, docking, predefined templates.
• Post production of the reports
• Working with crystal reports enterprise.
Crystal Reports:
 Introduction to Crystal Reports
 Working with different data sources like Oracle, MS-Access, ADO.net, Excel, etc
 Explanation on Design view
 Report header
 Page header
 Page detail
 Report footer
 Page footer
 Selection of the Database
 Define relationship between tables
 Report generation
 Blank report:
List report, cross tab report, chart reports
 Report wizard:
List report, cross tab report, chart reports
 Cross tab wizard:
 Cross tab reports
 Chart reports: Line chart, Bar chart, Pie-chart
 Mailing Label wizard
 OLAP cube report wizard
 Organizing the report:
• Adding filters, sorting the data, grouping the data
• Cascading filters creation using logical operators
• Chart reports: Line chart, Bar chart, Pie-chart
 work shop
• Formulas creation
• SQL Expression Development
• Parameters Creation (static, dynamic)
• Special field’s utilization
• Woking with alerters
• Saving reports in different formats like PDF, HTML, Excel Sheet, etc.
• Generates the reports from Business Objects environment
• Export Crystal Reports To Java Infoview
Xcelcius:
 Introduction to Xcelcius
• Generate the reports in different types of the chart formats using Excel sheet data
• Generate Flash player repots using Shock wave flash player (SWF) for analysis
• Chart reports using dimensions and measures
 Line chart, bar chart, pie-chart, 3d-chart, etc.
• Formatting the reports in different styles
• Defining the ranges for labels
• Creation of the container for multiple requests
• Creation of tabs on containers.
• Generate the requests for containers
• Post production of the reports
 Project Explanation with real time requirements
• Development of business requirements specifications(BRS)
• Development of reporting requirement specifications(RRS)
 Working with Live Office in Excel sheet from Crystal Reports and Web intelligent Reports in
Xcelcius
 Generate reports in MS-Office tools using Live Office.
 SAP Integration:
 Connect BO administrator to SAP BIW.
 Import dimensions and key figures to BOE.
 Create Global filters in Universe Designer.
 Introduction to Java Infoview.
 Generate reports from Web Intelligent Document.
 Generate reports from Web Rich client
 Introduction to Analytics.
 Query Scheduling and Optimization.
 Introduction to Corporate Analytics.
 Develop my Dashboards and Corporate Dashboards.
 Integrate SAP BIW with Crystal Reports.
 Develop Cross Tab Reports and Chart Reports.
 Working with analytics
 Working with central management console (CMC)
 create users and user groups
 set privileges to the users
 create servers and administer them
 working with CCM( central configuration managers)
 Introduction to Business View Manager.
 Introduction to Query as a Webservice.
 Working with crystal reports enterprise

More Related Content

What's hot

Day 8.1 system_admin_tasks
Day 8.1 system_admin_tasksDay 8.1 system_admin_tasks
Day 8.1 system_admin_taskstovetrivel
 
Test Data Transfer Tool
Test Data Transfer ToolTest Data Transfer Tool
Test Data Transfer ToolHai Nguyen
 
Introduction To Pentaho Analysis
Introduction To Pentaho AnalysisIntroduction To Pentaho Analysis
Introduction To Pentaho Analysispentaho Content
 
P6 enhancement requests opsig - Oracle Primavera P6 Collaborate 14
P6 enhancement requests opsig - Oracle Primavera P6 Collaborate 14P6 enhancement requests opsig - Oracle Primavera P6 Collaborate 14
P6 enhancement requests opsig - Oracle Primavera P6 Collaborate 14p6academy
 
MongoDB.local Sydney: Bringing Data to Life with MongoDB Charts
MongoDB.local Sydney: Bringing Data to Life with MongoDB ChartsMongoDB.local Sydney: Bringing Data to Life with MongoDB Charts
MongoDB.local Sydney: Bringing Data to Life with MongoDB ChartsMongoDB
 
Oracle BI Publsiher Using Data Template
Oracle BI Publsiher Using Data TemplateOracle BI Publsiher Using Data Template
Oracle BI Publsiher Using Data TemplateEdi Yanto
 
Day 6.4 extraction__lo
Day 6.4 extraction__loDay 6.4 extraction__lo
Day 6.4 extraction__lotovetrivel
 
XMLPublisher
XMLPublisherXMLPublisher
XMLPublisherJAYAARC
 
Day 6.1 and_6.2__flat_files_and_service_api
Day 6.1 and_6.2__flat_files_and_service_apiDay 6.1 and_6.2__flat_files_and_service_api
Day 6.1 and_6.2__flat_files_and_service_apitovetrivel
 
Day 6.3 extraction_business_content_and_generic
Day 6.3 extraction_business_content_and_genericDay 6.3 extraction_business_content_and_generic
Day 6.3 extraction_business_content_and_generictovetrivel
 
BI Publisher Data model design document
BI Publisher Data model design documentBI Publisher Data model design document
BI Publisher Data model design documentadivasoft
 
Quo vadis Power BI?
Quo vadis Power BI?Quo vadis Power BI?
Quo vadis Power BI?Trivadis
 
MongoDB.local Seattle 2019: Bringing Data to Life with MongoDB Charts
MongoDB.local Seattle 2019: Bringing Data to Life with MongoDB Charts MongoDB.local Seattle 2019: Bringing Data to Life with MongoDB Charts
MongoDB.local Seattle 2019: Bringing Data to Life with MongoDB Charts MongoDB
 
Beyond OData: Introducing the XML/A model for ui5
Beyond OData: Introducing the XML/A model for ui5Beyond OData: Introducing the XML/A model for ui5
Beyond OData: Introducing the XML/A model for ui5Roland Bouman
 
Sap business intelligence 4.0 report basic
Sap business intelligence 4.0   report basicSap business intelligence 4.0   report basic
Sap business intelligence 4.0 report basictovetrivel
 
Annette BI Portfolio
Annette BI PortfolioAnnette BI Portfolio
Annette BI Portfolioatako
 

What's hot (19)

Day 8.1 system_admin_tasks
Day 8.1 system_admin_tasksDay 8.1 system_admin_tasks
Day 8.1 system_admin_tasks
 
Test Data Transfer Tool
Test Data Transfer ToolTest Data Transfer Tool
Test Data Transfer Tool
 
Introduction To Pentaho Analysis
Introduction To Pentaho AnalysisIntroduction To Pentaho Analysis
Introduction To Pentaho Analysis
 
P6 enhancement requests opsig - Oracle Primavera P6 Collaborate 14
P6 enhancement requests opsig - Oracle Primavera P6 Collaborate 14P6 enhancement requests opsig - Oracle Primavera P6 Collaborate 14
P6 enhancement requests opsig - Oracle Primavera P6 Collaborate 14
 
MongoDB.local Sydney: Bringing Data to Life with MongoDB Charts
MongoDB.local Sydney: Bringing Data to Life with MongoDB ChartsMongoDB.local Sydney: Bringing Data to Life with MongoDB Charts
MongoDB.local Sydney: Bringing Data to Life with MongoDB Charts
 
Oracle BI Publsiher Using Data Template
Oracle BI Publsiher Using Data TemplateOracle BI Publsiher Using Data Template
Oracle BI Publsiher Using Data Template
 
Day 6.4 extraction__lo
Day 6.4 extraction__loDay 6.4 extraction__lo
Day 6.4 extraction__lo
 
XMLPublisher
XMLPublisherXMLPublisher
XMLPublisher
 
Day 6.1 and_6.2__flat_files_and_service_api
Day 6.1 and_6.2__flat_files_and_service_apiDay 6.1 and_6.2__flat_files_and_service_api
Day 6.1 and_6.2__flat_files_and_service_api
 
Day 6.3 extraction_business_content_and_generic
Day 6.3 extraction_business_content_and_genericDay 6.3 extraction_business_content_and_generic
Day 6.3 extraction_business_content_and_generic
 
BI Publisher Data model design document
BI Publisher Data model design documentBI Publisher Data model design document
BI Publisher Data model design document
 
Data2Ontology
Data2OntologyData2Ontology
Data2Ontology
 
Quo vadis Power BI?
Quo vadis Power BI?Quo vadis Power BI?
Quo vadis Power BI?
 
MongoDB.local Seattle 2019: Bringing Data to Life with MongoDB Charts
MongoDB.local Seattle 2019: Bringing Data to Life with MongoDB Charts MongoDB.local Seattle 2019: Bringing Data to Life with MongoDB Charts
MongoDB.local Seattle 2019: Bringing Data to Life with MongoDB Charts
 
Beyond OData: Introducing the XML/A model for ui5
Beyond OData: Introducing the XML/A model for ui5Beyond OData: Introducing the XML/A model for ui5
Beyond OData: Introducing the XML/A model for ui5
 
Sap business intelligence 4.0 report basic
Sap business intelligence 4.0   report basicSap business intelligence 4.0   report basic
Sap business intelligence 4.0 report basic
 
124 excelrest
124 excelrest124 excelrest
124 excelrest
 
Xml Publisher
Xml PublisherXml Publisher
Xml Publisher
 
Annette BI Portfolio
Annette BI PortfolioAnnette BI Portfolio
Annette BI Portfolio
 

Viewers also liked

Grafica de la funcion logarítmica
Grafica de la funcion logarítmicaGrafica de la funcion logarítmica
Grafica de la funcion logarítmicajuan leal
 
PHPWomen Asia WooCommerce Workshop 2016
PHPWomen Asia WooCommerce Workshop 2016PHPWomen Asia WooCommerce Workshop 2016
PHPWomen Asia WooCommerce Workshop 2016Britta Alex
 
Enc times october 08,2016
Enc times october 08,2016Enc times october 08,2016
Enc times october 08,2016ENC
 
Urogenital masculino
Urogenital masculinoUrogenital masculino
Urogenital masculinoGALOMAR
 
A/B Testing: Concept != Execution
A/B Testing: Concept != ExecutionA/B Testing: Concept != Execution
A/B Testing: Concept != ExecutionErin Weigel
 
Skp global expansion_updates_august_2016
Skp global expansion_updates_august_2016Skp global expansion_updates_august_2016
Skp global expansion_updates_august_2016Partha Pant
 
Open access and Benguet State University's dark web, repository, and open jou...
Open access and Benguet State University's dark web, repository, and open jou...Open access and Benguet State University's dark web, repository, and open jou...
Open access and Benguet State University's dark web, repository, and open jou...Lauren Kipaan
 

Viewers also liked (9)

Grafica de la funcion logarítmica
Grafica de la funcion logarítmicaGrafica de la funcion logarítmica
Grafica de la funcion logarítmica
 
PHPWomen Asia WooCommerce Workshop 2016
PHPWomen Asia WooCommerce Workshop 2016PHPWomen Asia WooCommerce Workshop 2016
PHPWomen Asia WooCommerce Workshop 2016
 
Enc times october 08,2016
Enc times october 08,2016Enc times october 08,2016
Enc times october 08,2016
 
новый мп
новый мпновый мп
новый мп
 
Urogenital masculino
Urogenital masculinoUrogenital masculino
Urogenital masculino
 
A/B Testing: Concept != Execution
A/B Testing: Concept != ExecutionA/B Testing: Concept != Execution
A/B Testing: Concept != Execution
 
ACTIVIDADES EDUCATIVAS SOFTWARE
ACTIVIDADES EDUCATIVAS SOFTWAREACTIVIDADES EDUCATIVAS SOFTWARE
ACTIVIDADES EDUCATIVAS SOFTWARE
 
Skp global expansion_updates_august_2016
Skp global expansion_updates_august_2016Skp global expansion_updates_august_2016
Skp global expansion_updates_august_2016
 
Open access and Benguet State University's dark web, repository, and open jou...
Open access and Benguet State University's dark web, repository, and open jou...Open access and Benguet State University's dark web, repository, and open jou...
Open access and Benguet State University's dark web, repository, and open jou...
 

Similar to BOBJ

OBIEE 11g Online Training
OBIEE 11g Online TrainingOBIEE 11g Online Training
OBIEE 11g Online TrainingRao Rao
 
new_obiee_1
new_obiee_1new_obiee_1
new_obiee_1rao dpr
 
SAP BW BI BO Pereyaslov jun17_short
SAP BW BI BO Pereyaslov jun17_shortSAP BW BI BO Pereyaslov jun17_short
SAP BW BI BO Pereyaslov jun17_shortStanislav Pereyaslov
 
CubeView is a browser based Business Analytical reporting tool OLAP Dashboard
CubeView is a browser based Business Analytical reporting tool OLAP DashboardCubeView is a browser based Business Analytical reporting tool OLAP Dashboard
CubeView is a browser based Business Analytical reporting tool OLAP Dashboardhitforseo
 
Microsoft PowerPivot & Power View in Excel 2013
Microsoft PowerPivot & Power View in Excel 2013Microsoft PowerPivot & Power View in Excel 2013
Microsoft PowerPivot & Power View in Excel 2013Mark Ginnebaugh
 
Building your first Analysis Services Tabular BI Semantic model with SQL Serv...
Building your first Analysis Services Tabular BI Semantic model with SQL Serv...Building your first Analysis Services Tabular BI Semantic model with SQL Serv...
Building your first Analysis Services Tabular BI Semantic model with SQL Serv...Microsoft TechNet - Belgium and Luxembourg
 
Oracle Business Intelligence Enterprise Edition
Oracle Business Intelligence Enterprise EditionOracle Business Intelligence Enterprise Edition
Oracle Business Intelligence Enterprise EditionESRI Bulgaria
 
Microsoft BI reporting capabilities (on-prem solutions) Presentation
Microsoft BI reporting capabilities (on-prem solutions) PresentationMicrosoft BI reporting capabilities (on-prem solutions) Presentation
Microsoft BI reporting capabilities (on-prem solutions) Presentationjeromedoyen
 

Similar to BOBJ (20)

OBIEE 11g Online Training
OBIEE 11g Online TrainingOBIEE 11g Online Training
OBIEE 11g Online Training
 
new_obiee_1
new_obiee_1new_obiee_1
new_obiee_1
 
SAP Business Objects Trianing
SAP Business Objects TrianingSAP Business Objects Trianing
SAP Business Objects Trianing
 
Micro strategy 7i
Micro strategy 7iMicro strategy 7i
Micro strategy 7i
 
SAP BW BI BO Pereyaslov jun17_short
SAP BW BI BO Pereyaslov jun17_shortSAP BW BI BO Pereyaslov jun17_short
SAP BW BI BO Pereyaslov jun17_short
 
CubeView is a browser based Business Analytical reporting tool OLAP Dashboard
CubeView is a browser based Business Analytical reporting tool OLAP DashboardCubeView is a browser based Business Analytical reporting tool OLAP Dashboard
CubeView is a browser based Business Analytical reporting tool OLAP Dashboard
 
Microsoft PowerPivot & Power View in Excel 2013
Microsoft PowerPivot & Power View in Excel 2013Microsoft PowerPivot & Power View in Excel 2013
Microsoft PowerPivot & Power View in Excel 2013
 
Building your first Analysis Services Tabular BI Semantic model with SQL Serv...
Building your first Analysis Services Tabular BI Semantic model with SQL Serv...Building your first Analysis Services Tabular BI Semantic model with SQL Serv...
Building your first Analysis Services Tabular BI Semantic model with SQL Serv...
 
Oracle Business Intelligence Enterprise Edition
Oracle Business Intelligence Enterprise EditionOracle Business Intelligence Enterprise Edition
Oracle Business Intelligence Enterprise Edition
 
Sap business objects bobi training
Sap business objects bobi trainingSap business objects bobi training
Sap business objects bobi training
 
MSBI_MSSQL_Bhrath
MSBI_MSSQL_BhrathMSBI_MSSQL_Bhrath
MSBI_MSSQL_Bhrath
 
Sap bo xi r4.0
Sap bo xi r4.0Sap bo xi r4.0
Sap bo xi r4.0
 
Sap bo xi r4.0
Sap bo xi r4.0Sap bo xi r4.0
Sap bo xi r4.0
 
Sap bo xi r4.0
Sap bo xi r4.0Sap bo xi r4.0
Sap bo xi r4.0
 
Sap bo xi r4.0
Sap bo xi r4.0Sap bo xi r4.0
Sap bo xi r4.0
 
Microsoft BI reporting capabilities (on-prem solutions) Presentation
Microsoft BI reporting capabilities (on-prem solutions) PresentationMicrosoft BI reporting capabilities (on-prem solutions) Presentation
Microsoft BI reporting capabilities (on-prem solutions) Presentation
 
Sap bo xi r4.0
Sap bo xi r4.0Sap bo xi r4.0
Sap bo xi r4.0
 
Sap bo xi r4.0 short
Sap bo xi r4.0  shortSap bo xi r4.0  short
Sap bo xi r4.0 short
 
Sap bo xi r4.0 short
Sap bo xi r4.0  shortSap bo xi r4.0  short
Sap bo xi r4.0 short
 
Sap bo xi r4.0 short
Sap bo xi r4.0  shortSap bo xi r4.0  short
Sap bo xi r4.0 short
 

BOBJ

  • 1. ________________________________________________________________________ SAP-BO-XIR3.1/R4.0 Introduction to OLAP systems Need of OLAP systems Benefits of OLAP systems Different types of OLAP systems Introduction to Business Objects • Architecture of SAP- Business Object XIR3.1/4.0 • ODBC connectivity between different types of Databases and SAP-BOE Universe Design using SAP-BOXIR3.1/R4.0 UDT (Universe Designer Tool) Working with quick design and manual design mode. • Enterprise mode (CMS) • Stand alone mode (No CMS) Connection type:  Secured  Shared  Personal Working with tables, views and synonyms Design universe diagram: • Identification of table types, • Joins (inner, left outer, right outer ) • Data type conversion on join conditions • Cardinality creation • Table Derivation from same type of tables using Union Operator • Detection of the loops in Universe • Loops resolving for avoid Chesm traps, Fan Traps: • Creation of Aliases
  • 2. • Creation of Contexts based on reporting requirements • Creation of Shortcut joins Creation of Classes and objects: • Define the classes for end user requirements • Creation of objects  Dimensions for Analysis  Details with associate Dimensions  Measures at detail level and summarized level • Global filters creation at Universe Level • Working with standalone filters • @Aggregate awareness for same type of measures • @concatenation function creation • @measure function using Measure objects • Aggregate Navigation for Incompatible Objects Custom Hierarchies for scope of Analysis  Check Integrity  Working with LOV’s  Working with cascading LOV’s  Organize the connections  Working with derived tables  Working with universe linking Desktop Intelligence: Introduction to query panel Request generation in query panel Local filter creation at reporting level using List of Values Cascading filters using Logical Operators like AND, OR
  • 3. Reports generation: Ad-hoc reports Standard reports Two-dimensional reports Multidimensional reports • List reports: Horizontal reports, vertical reports • Breaks creation on list reports • Master-Detail reports • Chart reports Line chart, bar chart, pie-chart, etc. • Cross-tab reports • Group reports • Defining Rank on report • Assign Filter on report • Assign alert on report • Variables Creation at report level Slices and dices: Analysis of business user requirements Generation of reporting requirements • Saving reports in different formats: HTML, PDF, Excel, MS Word • Generate the using predefined templates, user defined templates • Generate the reports using predefined sql without developing model • Generate the reports directly from the flat files, Excel sheets • Formatting the reports • Internal process explanation at server level  Drilling Analysis: • Drill through, drill down, drill up, and drill by
  • 4.  Post production of the report  Introduction to web intelligence rich client: • Generate different types of reports same as like desktop intelligence  Introduction to Java Info view or BI Launch Pad • Generate different types of reports using web intelligence document same as like desktop Intelligence • Saving Request for end user analysis for one click actions or saving report on PC  Dashboard Reports for multiple requirements • My Dashboards • Corporate Dashboards • Creation of tabs for multiple Dashboards • Dashboards using free form, docking, predefined templates. • Post production of the reports • Working with crystal reports enterprise. Crystal Reports:  Introduction to Crystal Reports  Working with different data sources like Oracle, MS-Access, ADO.net, Excel, etc  Explanation on Design view  Report header  Page header  Page detail  Report footer  Page footer  Selection of the Database  Define relationship between tables  Report generation  Blank report:
  • 5. List report, cross tab report, chart reports  Report wizard: List report, cross tab report, chart reports  Cross tab wizard:  Cross tab reports  Chart reports: Line chart, Bar chart, Pie-chart  Mailing Label wizard  OLAP cube report wizard  Organizing the report: • Adding filters, sorting the data, grouping the data • Cascading filters creation using logical operators • Chart reports: Line chart, Bar chart, Pie-chart  work shop • Formulas creation • SQL Expression Development • Parameters Creation (static, dynamic) • Special field’s utilization • Woking with alerters • Saving reports in different formats like PDF, HTML, Excel Sheet, etc. • Generates the reports from Business Objects environment • Export Crystal Reports To Java Infoview Xcelcius:  Introduction to Xcelcius • Generate the reports in different types of the chart formats using Excel sheet data • Generate Flash player repots using Shock wave flash player (SWF) for analysis • Chart reports using dimensions and measures  Line chart, bar chart, pie-chart, 3d-chart, etc.
  • 6. • Formatting the reports in different styles • Defining the ranges for labels • Creation of the container for multiple requests • Creation of tabs on containers. • Generate the requests for containers • Post production of the reports  Project Explanation with real time requirements • Development of business requirements specifications(BRS) • Development of reporting requirement specifications(RRS)  Working with Live Office in Excel sheet from Crystal Reports and Web intelligent Reports in Xcelcius  Generate reports in MS-Office tools using Live Office.  SAP Integration:  Connect BO administrator to SAP BIW.  Import dimensions and key figures to BOE.  Create Global filters in Universe Designer.  Introduction to Java Infoview.  Generate reports from Web Intelligent Document.  Generate reports from Web Rich client  Introduction to Analytics.  Query Scheduling and Optimization.  Introduction to Corporate Analytics.  Develop my Dashboards and Corporate Dashboards.  Integrate SAP BIW with Crystal Reports.  Develop Cross Tab Reports and Chart Reports.  Working with analytics  Working with central management console (CMC)
  • 7.  create users and user groups  set privileges to the users  create servers and administer them  working with CCM( central configuration managers)  Introduction to Business View Manager.  Introduction to Query as a Webservice.  Working with crystal reports enterprise