Mult scler 1352458514521888, figure 1
•
0 likes•168 views

This document is a figure showing laboratory and medical imaging findings for a patient before and after Epstein-Barr virus (EBV)-specific adoptive immunotherapy. The figure compares the patient's MRI brain scans, lymphocyte counts, and EBV DNA levels prior to treatment and at various time points following treatment.
Report
Share
Report
Share
Recommended
Multiple SclerosisFingolimod the path from a fungal metabolite to fda approved drug-biom255-sp...
Fingolimod the path from a fungal metabolite to fda approved drug-biom255-sp...People with Multiple Sclerosis (Vic) Inc.
Multiple SclerosisMultiple sclerosis current and emerging treatments personalized strategies
Multiple sclerosis current and emerging treatments personalized strategiesPeople with Multiple Sclerosis (Vic) Inc.
🌹Attapur⬅️ Vip Call Girls Hyderabad 📱9352852248 Book Well Trand Call Girls In Hyderabad Escorts Service
Escorts Service Available
Whatsapp Chaya ☎️ : [+91-9352852248 ]
Escorts Service Hyderabad are always ready to make their clients happy. Their exotic looks and sexy personalities are sure to turn heads. You can enjoy with them, including massages and erotic encounters.#P12Our area Escorts are young and sexy, so you can expect to have an exotic time with them. They are trained to satiate your naughty nerves and they can handle anything that you want. They are also intelligent, so they know how to make you feel comfortable and relaxed
SERVICE ✅ ❣️
⭐➡️HOT & SEXY MODELS // COLLEGE GIRLS HOUSE WIFE RUSSIAN , AIR HOSTES ,VIP MODELS .
AVAILABLE FOR COMPLETE ENJOYMENT WITH HIGH PROFILE INDIAN MODEL AVAILABLE HOTEL & HOME
★ SAFE AND SECURE HIGH CLASS SERVICE AFFORDABLE RATE
★
SATISFACTION,UNLIMITED ENJOYMENT.
★ All Meetings are confidential and no information is provided to any one at any cost.
★ EXCLUSIVE PROFILes Are Safe and Consensual with Most Limits Respected
★ Service Available In: - HOME & HOTEL Star Hotel Service .In Call & Out call
SeRvIcEs :
★ A-Level (star escort)
★ Strip-tease
★ BBBJ (Bareback Blowjob)Receive advanced sexual techniques in different mode make their life more pleasurable.
★ Spending time in hotel rooms
★ BJ (Blowjob Without a Condom)
★ Completion (Oral to completion)
★ Covered (Covered blowjob Without condom
★ANAL SERVICES.
🌹Attapur⬅️ Vip Call Girls Hyderabad 📱9352852248 Book Well Trand Call Girls In...
🌹Attapur⬅️ Vip Call Girls Hyderabad 📱9352852248 Book Well Trand Call Girls In...Call Girls In Delhi Whatsup 9873940964 Enjoy Unlimited Pleasure
Models Call Girls In Hyderabad 9630942363 Hyderabad Call Girl & Hyderabad Escort ServiceModels Call Girls In Hyderabad 9630942363 Hyderabad Call Girl & Hyderabad Esc...
Models Call Girls In Hyderabad 9630942363 Hyderabad Call Girl & Hyderabad Esc...GENUINE ESCORT AGENCY
More Related Content
Recently uploaded
🌹Attapur⬅️ Vip Call Girls Hyderabad 📱9352852248 Book Well Trand Call Girls In Hyderabad Escorts Service
Escorts Service Available
Whatsapp Chaya ☎️ : [+91-9352852248 ]
Escorts Service Hyderabad are always ready to make their clients happy. Their exotic looks and sexy personalities are sure to turn heads. You can enjoy with them, including massages and erotic encounters.#P12Our area Escorts are young and sexy, so you can expect to have an exotic time with them. They are trained to satiate your naughty nerves and they can handle anything that you want. They are also intelligent, so they know how to make you feel comfortable and relaxed
SERVICE ✅ ❣️
⭐➡️HOT & SEXY MODELS // COLLEGE GIRLS HOUSE WIFE RUSSIAN , AIR HOSTES ,VIP MODELS .
AVAILABLE FOR COMPLETE ENJOYMENT WITH HIGH PROFILE INDIAN MODEL AVAILABLE HOTEL & HOME
★ SAFE AND SECURE HIGH CLASS SERVICE AFFORDABLE RATE
★
SATISFACTION,UNLIMITED ENJOYMENT.
★ All Meetings are confidential and no information is provided to any one at any cost.
★ EXCLUSIVE PROFILes Are Safe and Consensual with Most Limits Respected
★ Service Available In: - HOME & HOTEL Star Hotel Service .In Call & Out call
SeRvIcEs :
★ A-Level (star escort)
★ Strip-tease
★ BBBJ (Bareback Blowjob)Receive advanced sexual techniques in different mode make their life more pleasurable.
★ Spending time in hotel rooms
★ BJ (Blowjob Without a Condom)
★ Completion (Oral to completion)
★ Covered (Covered blowjob Without condom
★ANAL SERVICES.
🌹Attapur⬅️ Vip Call Girls Hyderabad 📱9352852248 Book Well Trand Call Girls In...
🌹Attapur⬅️ Vip Call Girls Hyderabad 📱9352852248 Book Well Trand Call Girls In...Call Girls In Delhi Whatsup 9873940964 Enjoy Unlimited Pleasure
Models Call Girls In Hyderabad 9630942363 Hyderabad Call Girl & Hyderabad Escort ServiceModels Call Girls In Hyderabad 9630942363 Hyderabad Call Girl & Hyderabad Esc...
Models Call Girls In Hyderabad 9630942363 Hyderabad Call Girl & Hyderabad Esc...GENUINE ESCORT AGENCY
Recently uploaded (20)
Top Quality Call Girl Service Kalyanpur 6378878445 Available Call Girls Any Time
Top Quality Call Girl Service Kalyanpur 6378878445 Available Call Girls Any Time
Call Girls Madurai Just Call 9630942363 Top Class Call Girl Service Available
Call Girls Madurai Just Call 9630942363 Top Class Call Girl Service Available
Independent Call Girls Service Mohali Sector 116 | 6367187148 | Call Girl Ser...
Independent Call Girls Service Mohali Sector 116 | 6367187148 | Call Girl Ser...
Call Girls Rishikesh Just Call 8250077686 Top Class Call Girl Service Available
Call Girls Rishikesh Just Call 8250077686 Top Class Call Girl Service Available
Jogeshwari ! Call Girls Service Mumbai - 450+ Call Girl Cash Payment 90042684...
Jogeshwari ! Call Girls Service Mumbai - 450+ Call Girl Cash Payment 90042684...
Call Girls Service Jaipur {8445551418} ❤️VVIP BHAWNA Call Girl in Jaipur Raja...
Call Girls Service Jaipur {8445551418} ❤️VVIP BHAWNA Call Girl in Jaipur Raja...
Most Beautiful Call Girl in Bangalore Contact on Whatsapp
Most Beautiful Call Girl in Bangalore Contact on Whatsapp
Call Girl In Pune 👉 Just CALL ME: 9352988975 💋 Call Out Call Both With High p...
Call Girl In Pune 👉 Just CALL ME: 9352988975 💋 Call Out Call Both With High p...
Call Girls Kolkata Kalikapur 💯Call Us 🔝 8005736733 🔝 💃 Top Class Call Girl Se...
Call Girls Kolkata Kalikapur 💯Call Us 🔝 8005736733 🔝 💃 Top Class Call Girl Se...
🌹Attapur⬅️ Vip Call Girls Hyderabad 📱9352852248 Book Well Trand Call Girls In...
🌹Attapur⬅️ Vip Call Girls Hyderabad 📱9352852248 Book Well Trand Call Girls In...
9630942363 Genuine Call Girls In Ahmedabad Gujarat Call Girls Service
9630942363 Genuine Call Girls In Ahmedabad Gujarat Call Girls Service
VIP Hyderabad Call Girls Bahadurpally 7877925207 ₹5000 To 25K With AC Room 💚😋
VIP Hyderabad Call Girls Bahadurpally 7877925207 ₹5000 To 25K With AC Room 💚😋
Models Call Girls In Hyderabad 9630942363 Hyderabad Call Girl & Hyderabad Esc...
Models Call Girls In Hyderabad 9630942363 Hyderabad Call Girl & Hyderabad Esc...
Call Girls Service Jaipur {9521753030 } ❤️VVIP BHAWNA Call Girl in Jaipur Raj...
Call Girls Service Jaipur {9521753030 } ❤️VVIP BHAWNA Call Girl in Jaipur Raj...
Andheri East ^ (Genuine) Escort Service Mumbai ₹7.5k Pick Up & Drop With Cash...
Andheri East ^ (Genuine) Escort Service Mumbai ₹7.5k Pick Up & Drop With Cash...
(Low Rate RASHMI ) Rate Of Call Girls Jaipur ❣ 8445551418 ❣ Elite Models & Ce...
(Low Rate RASHMI ) Rate Of Call Girls Jaipur ❣ 8445551418 ❣ Elite Models & Ce...
Call Girls in Delhi Triveni Complex Escort Service(🔝))/WhatsApp 97111⇛47426
Call Girls in Delhi Triveni Complex Escort Service(🔝))/WhatsApp 97111⇛47426
Dehradun Call Girls Service {8854095900} ❤️VVIP ROCKY Call Girl in Dehradun U...
Dehradun Call Girls Service {8854095900} ❤️VVIP ROCKY Call Girl in Dehradun U...
Call Girls Amritsar Just Call 8250077686 Top Class Call Girl Service Available
Call Girls Amritsar Just Call 8250077686 Top Class Call Girl Service Available
Featured
Featured (20)
Product Design Trends in 2024 | Teenage Engineerings
Product Design Trends in 2024 | Teenage Engineerings
How Race, Age and Gender Shape Attitudes Towards Mental Health
How Race, Age and Gender Shape Attitudes Towards Mental Health
AI Trends in Creative Operations 2024 by Artwork Flow.pdf
AI Trends in Creative Operations 2024 by Artwork Flow.pdf
Content Methodology: A Best Practices Report (Webinar)
Content Methodology: A Best Practices Report (Webinar)
How to Prepare For a Successful Job Search for 2024
How to Prepare For a Successful Job Search for 2024
Social Media Marketing Trends 2024 // The Global Indie Insights
Social Media Marketing Trends 2024 // The Global Indie Insights
Trends In Paid Search: Navigating The Digital Landscape In 2024
Trends In Paid Search: Navigating The Digital Landscape In 2024
5 Public speaking tips from TED - Visualized summary
5 Public speaking tips from TED - Visualized summary
Google's Just Not That Into You: Understanding Core Updates & Search Intent
Google's Just Not That Into You: Understanding Core Updates & Search Intent
The six step guide to practical project management
The six step guide to practical project management
Beginners Guide to TikTok for Search - Rachel Pearson - We are Tilt __ Bright...
Beginners Guide to TikTok for Search - Rachel Pearson - We are Tilt __ Bright...
Mult scler 1352458514521888, figure 1
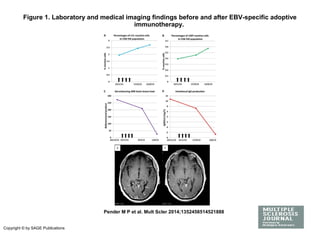
- 1. Figure 1. Laboratory and medical imaging findings before and after EBV-specific adoptive immunotherapy. Pender M P et al. Mult Scler 2014;1352458514521888 Copyright © by SAGE Publications
Editor's Notes
- Laboratory and medical imaging findings before and after EBV-specific adoptive immunotherapy. Panels A and B show the frequencies of T cells in the peripheral blood reactive to an EBV-infected autologous B cell lymphoblastoid cell line (LCL) (Panel A) and to a pool of the LMP1 and LMP2A (LMP) peptides contained within AdE1-LMPpoly (Panel B). T-cell reactivity to EBV was measured by flow cytometry and intracellular interferon-γ staining and is shown as the percentages of reactive cells within the CD8+ effector memory (EM; CD45RA–CD62L–) T-cell population. Vertical arrows indicate successive T-cell infusions of 5 × 10⁶, 1 × 10⁷, 1.5 × 10⁷ and 2 × 10⁷ cells. Panel C shows the total gadolinium(Gd)-enhancing brain lesion load, as measured by the bidimensional product, which was calculated as the sum of the product (maximum diameter of a lesion multiplied by the largest diameter perpendicular to this maximum diameter) of each lesion. Panel D shows the quantity of intrathecal IgG production (IgG(loc)) which was calculated by the formula of Reiber and Felgenhauer:10 IgG(loc) (mg/L) = {(CSF IgG ÷ serum IgG) − [0.8 × (√((CSF albumin ÷ serum albumin)2 + 15))] + 1.8} × serum IgG. Panels E and F show axial plane T1-weighted images at the level of the posterior horns of the lateral ventricles 5 minutes after the IV injection of gadolinium. Panel E demonstrates three periventricular gadolinium-enhancing lesions (arrows) 5 weeks before the commencement of therapy whereas Panel F shows no enhancing lesions 9 weeks after the completion of therapy.