NOVEL NUMERICAL PROCEDURES FOR LIMIT ANALYSIS OF STRUCTURES: MESH-FREE METHODS
Access Panel Design Optimization
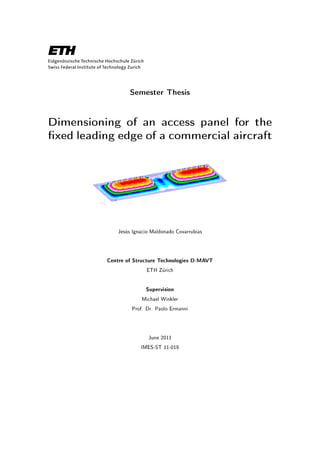
1. Semester Thesis
Dimensioning of an access panel for the
xed leading edge of a commercial aircraft
Jesús Ignacio Maldonado Covarrubias
Centre of Structure Technologies D-MAVT
ETH Zürich
Supervision
Michael Winkler
Prof. Dr. Paolo Ermanni
June 2011
IMES-ST 11-019
2. Department of Mechanical and Process Engineering
Centre of Structure Technologies
ETH Zurich
Leonhardstrasse 27
CH-8092 Zurich
IMES-ST/SA Maldonado.docx Page 1
Eidgenössische Technische Hochschule Zürich
Swiss Federal Institute of Technology Zurich
Student:
Maldonado, Jesús
ETH-Nr: 10-937-241 Departement: MAVT
Hochschule (if external student):
Thesis:
Title: Dimensioning of an access panel for the fixed leading edge of an
commercial aircraft
Kind of Thesis: SA Semester: FS 2011
Supervisor: Prof. Dr P. Ermanni
Advisor: Winkler, Michael
Start of the work: 21/02/2011
Intermediate presentation (Zwischenpräsentation): 24/03/2011
Final presentation (Endpräsentation): 19/05/2011
Deadline delivery final report: 03/06/2011
Introduction
Within the framework of the EU-project COALESCE2 new concepts for fixed leading edges
of commercial aircrafts on the basis of the A320 are under investigation. The project focuses
on new technologies and materials which shall reduce the manufacturing costs for the wing
leading edge. Among other things the access panels are analyzed. Composites and
aluminum is considered as potential material for the panels. Due to high material cost for
composite solutions a high speed machined aluminum design with blade stiffeners will be
investigated as a low cost option within this student thesis. The dimensioning of this panel for
defined loads and to fulfill certain criteria has not been made so far. The thesis will be done
in cooperation with the according project partners.
Figure 1: Fixed leading edge
3. IMES-ST/SA Maldonado.docx Page 2
Objectives
The first goal of the thesis is to investigate a given initial design of an access panel. One
panel will be investigated in detail with the help of finite element analyses. The finite element
model and a suitable definition of the boundary conditions have to be developed. The exact
number and direction of stiffeners is thereby not defined so far. Only the shape of the
stiffeners is defined due to manufacturing restrictions. Wing bending and differential pressure
will be considered as loads. Regarding the criteria air tolerances, strength, stability of the
stiffeners and strength of the connections will be investigated. The criteria will be evaluated
with the help of the simulation results and with the help of analytical considerations. First of
all, it has to be investigated whether chordwise, spanwise or combined chordwise/spanwise
stiffeners are preferable.
After the decision of the alignment of the stiffeners, the second goal is to find a solution with
a reduced mass. This will be done by parameter studies. Within these studies, the number,
thickness, height, length and position of the stiffeners can be changed in order reduce the
mass. At the end a lightweight solution has to be available which is fulfils the requirements.
Work breakdown
The work will be mainly subdivided in the following tasks:
1. Surface model: A surface model as a preparation for the FE simulations has to be built.
2. FE model: A FE model has to be built which considers the load cases of wing bending
and pressure and all relevant boundary conditions. Afterwards, several criteria have to
be fulfilled by the panel. In detail air tolerances, strength, stability of the stiffeners and
strength of the connections will be considered. The model includes the different
possibilities of stiffeners alignment.
3. Design Improvement: The decision concerning the stiffeners alignment will be made.
Afterwards, the design has to be improved in order to reduce the mass. This will be
made by parameter studies.
The organization of the work is depicted in following table. The estimated deadlines are also
shown.
Date
21.Feb
28.Feb
07.Mrz
14.Mrz
21.Mrz
28.Mrz
04.Apr
11.Apr
18.Apr
25.Apr
02.Mai
09.Mai
16.Mai
23.Mai
30.Mai
Task Week 8 9 10 11 12 13 14 15 16 17 18 19 20 21 22
Literature Research
Surface model
FE model
Mid-Term Presentation X
Design Improvement
Final Presentation X
Writing of the report
4.
5. Abstract
The dimensioning of an aluminum access panel is the main goal of this semester thesis.
The problem is solved by means of three dierent approaches. An adaptive analytical plate
model is built to describe the orthotropic stiened access panel deections. A nite element
analysis is used to prove in detail that the structure fullls all design criteria. The structural
optimization algorithm ensures a reduction of mass to a minimum. Design improvements
from every phase of the study are included in the nal model. The main programs used are
Patran, CATIA, Nastran, ANSYS and MATLAB.
The nite element analysis reveals local eects that increase deection, which the analytical
model is unable to consider with its current formulation. An increased number of stieners
with optimized dimensions increase the local skin stiening and provide compliance of all
requirements. Design observed criteria are: strength, air tolerances, fastener strength and
buckling load. The balance is found between isotropic and orthotropic designs, neither a thick
panel skin nor a few large stieners will provide the best solution.
i
6. Zusammenfassung
Die Dimensionierung eines Access Panels ist das Ziel dieser Semesterarbeit. Das Problem
wird mit drei verschiedenen Ansätzen gelöst. Eine adaptives orthotropes Plattenmodell wird
verwendet, um die Verformung der versteiften Platte zu beschreiben. Eine Finite-Elemente-
Analyse wird anschliessend durchgeführt, um im Detail zu zeigen, dass die Struktur alle
Anforderungen erfüllt. Zudem wird ein Strukturoptimierungsalgorithmus angewendet, um
die Masse der Platte zu reduzieren. Design Verbesserungen jeder Phase der Studie werden
schliesslich in das endgültige Modell aufgenommen. Die wichtigsten verwendeten Programme
sind CATIA, Nastran, ANSYS und MATLAB.
Die Finite Elemente Analyse zeigt, dass lokale Eekte die Verformung erhöhen, die das
analytische Modell mit seiner derzeitigen Formulierung nicht berücksichtigt. Eine grössere
Anzahl von Versteifungen mit optimierten Abmessungen erhöht die lokale Versteifung der
Platte, so dass alle Anforderungen erfüllt werden. Das Gleichgewicht wird zwischen isotropen
und orthotropen Konstruktionen gefunden, das heisst, dass weder eine dicke Platte noch eine
Platte mit wenigen grossen Versteifungen die beste Lösung ergibt.
ii
9. Nomenclature
AISI American Iron and Steel Institute
ANSYS Analysis System
CATIA Computer Aided Three-Dimensional Interactive Application
CC Cruise Conditions
COALESCE2 Cost Ecient Advanced Leading Edge Structure 2
FE Finite Element
FLE Fixed Leading Edge
GOF Global Objective Function
LL Limit Load
MATLAB Matrix Laboratory
UL Ultimate Load
v
10. List of Figures
1.1 Structure of thesis work . . . . . . . . . . . . . . . . . . . . . . . . . . . . . 3
3.1 Air tolerances denition from [13] . . . . . . . . . . . . . . . . . . . . . . . . 13
3.2 Conventions for pressure from [12] . . . . . . . . . . . . . . . . . . . . . . . 14
4.1 Cross-sections considered in the iterative beam model. . . . . . . . . . . . . . 16
4.2 Prole of deection, beam model with variable cross-section. . . . . . . . . . 17
4.3 Adaptive orthotropic plate model regions. . . . . . . . . . . . . . . . . . . . 19
4.4 Prole of deection, adaptive orthotropic plate model. . . . . . . . . . . . . . 21
4.5 Sensitivity analysis graphs . . . . . . . . . . . . . . . . . . . . . . . . . . . 22
5.1 Surface model extracted from solid geometry . . . . . . . . . . . . . . . . . . 23
5.2 Beam and bush elements . . . . . . . . . . . . . . . . . . . . . . . . . . . . 25
5.3 Illustration of prying eect, as taken from [14]. . . . . . . . . . . . . . . . . . 25
5.4 Position of middle ribs above access panel, halfway along the spanwise length. 26
5.5 Tria6 mid-node elements shown in the triangular extremity of the stieners . . 27
5.6 Local deection eects from inner skin of access panel. . . . . . . . . . . . . 29
5.7 Stress distribution on LC-0-1. . . . . . . . . . . . . . . . . . . . . . . . . . . 29
6.1 Real constants denition for ANSYS automatic model. . . . . . . . . . . . . 31
6.2 Iteration graph from GOF in run 27. . . . . . . . . . . . . . . . . . . . . . . 34
7.1 Optimal mass search results . . . . . . . . . . . . . . . . . . . . . . . . . . . 36
7.2 Final optimized CATIA model . . . . . . . . . . . . . . . . . . . . . . . . . . 36
7.3 Region where one node causes a reserve factor Rstress = 0.99 for LC-1-1. . . 38
7.4 Extraction of maximum stiener stresses for buckling considerations. . . . . . 38
7.5 LC-1-0, the largest deection contribution to all load cases. . . . . . . . . . . 39
vi
11. List of Tables
3.1 List of load cases . . . . . . . . . . . . . . . . . . . . . . . . . . . . . . . . 15
5.1 Wing bending information extracted from [1]. . . . . . . . . . . . . . . . . . 28
5.2 Comparison of error magnitudes of analytical model vs. FE model. . . . . . . 29
6.1 Design parameters in optimization vector. . . . . . . . . . . . . . . . . . . . 31
6.2 Constraints for the Global objective function . . . . . . . . . . . . . . . . . . 33
7.1 Comparison of mass between models . . . . . . . . . . . . . . . . . . . . . . 37
7.2 Reserve factors for the nal access panel dimensions . . . . . . . . . . . . . 38
vii
12. 1 Introduction
1.1 Motivation
The following semester thesis is product of working under the framework of Cost Ecient
Advanced Leading Edge Structure 2 (COALESCE2) project, a collaboration of ETH Zürich
and other academic and industrial partners. Within the framework of the EU-project CO-
ALESCE2, new concepts for xed leading edges of commercial aircraft on the basis of the
A320 are under investigation. The project focuses on new technologies and materials which
shall reduce the manufacturing costs for the wing xed leading edge (FLE).The objectives of
the project are:
ˆ Development of a xed leading edge structure which is over 30% more cost ecient
than state-of-the-art structures
ˆ Examination of conventional and alternative leading edge ight control mechanisms
ˆ Simulation of assembly process and structural performance
During the accomplishment of these objectives, a more specic need is found, setting the
goals for the following study. Composites and aluminum is considered as potential material
for the panels. Nevertheless, due to high material cost for composite solutions a high speed
machined aluminum design with blade stieners will be investigated as a low cost option.
Thus, this work is focused on the dimensioning and denition of design criteria for the access
panels.
1.2 Objectives
The thesis is divided into chapters which show the work structure mainly based on chrono-
logical order. Nevertheless, a general structure will be useful to have a clear idea of the whole
design process.
Initial objectives of the semester thesis, as derived from the semester thesis agreement, are:
1. Literature research and software familiarization
a) Obtain sources of information and collect all relevant data, equations and consid-
erations regarding the semester thesis.
b) Learn to use the software required by the industry partners, and evaluate all results
on it. Relevant software packages are:
i. Dassault Systèmes' CATIA
1
13. ii. MSC's Nastran and Patran
2. Analytical model of access panel
a) Use the available literature to characterize the panel deection.
b) Should the literature be insucient, adapt the existing models for the best ap-
proximation.
3. Solid and surface model
a) Generate a modied CATIA model from the original one provided by existing
project les.
b) Extract an adapted surface model to simplify mesh construction on Patran.
4. Finite element model
a) Take advantage of surface model to create corresponding mesh of the access panel.
b) Set all boundary conditions and load cases for analysis.
5. Design improvement
a) Perform parametric studies on access panel to determine relevant design variables.
b) Improve design to nd a low mass solution.
1.3 Structure of work
During the course of the semester thesis, the possibility of applying optimization algorithms
was obtained, therefore the nal initial objective of design improvement changed from para-
metric studies into structural optimization. Figure 1.1 depicts the approach at objectives.
This scheme was used throughout course of the work, and all chapters on this thesis are
based on it.
Chapter 2 provides an overview of the state-of-the-art in the relevant elds. This back-
ground is divided in the three dierent elds from gure 1.1. The design problem is dened
in chapter 3, where all preliminary conditions are described. The rst approach is contained
in chapter 4, with a full description of the analytical model. All information regarding the
nite element modeling is included in chapter 5. The nal stage, explaining an optimization
algorithm construction, is located in chapter 6. Important sections of the code from chapters
4 and 6 are included as appendix.
The results are presented in chapter 7, where the nal design and details are listed. Chapter
8 contains the conclusions derived from this thesis. An outlook is also included in chapter 9.
2
15. 2 State-of-the-art
This chapter provides necessary knowledge and latest methods to address the design problem
of this thesis. All topics are grouped according to the previously mentioned structure of the
thesis work in gure 1.1.
2.1 Literature review
As preparation step, dierent sources were investigated to obtain an insight in the relevant
elds.
Buckling and strength of stieners have been a major consideration ever since before the
days of ight. Since the 18th century, engineers have been tasked with creating structures
to withstand enormous loads, such as stiened bridges shown in [11]. An increasing number
of orthotropic plate theories have arisen, beginning with Huber (1914), later perfected by
Massonet (1950) (all examined in [18]), and nally reaching the models by Cusens and Pama
[11], which are used in this thesis.
Several sources provide an approach to deection modeling of stiened plates and beams.
While some authors prefer to skip all development of the equations and fall straight into
generalized (rather empirical) models for stiened plate design, such as Michael C. Niu in
[10], others prefer a more analytical approach. Troitsky's analysis in [18] begins with a suited
chronological development of the equations, explaining important events that trigger their
advance. In the last chapters about orthotropic integral stieners plate theory, he recognizes
the most used and practical set of equations from Cusens and Pama [11]. They provide a
comprehensive collection of the most precise equations, with comments on any addition or
correction to the models, assessing their applicability as well.
The FEM Guideline in [3] from the COALESCE2 project provides specic approaches for
the design, from the element selection, to modeling specics, and software usage recommen-
dations. Another useful source is the documentation les from MSC software, specically the
part 3 of the Reference manual: Finite element modeling [9].
Finite Element (FE) analysis is a powerful engineering tool widely used in the modern world.
Clearly stated by G. Kress in [6], they provide a notorious advantage through the capability
of nding approximations to true solutions that are not accessible to exact analytical solution
methods.
The foundation strength of all review models is considered as a selection criteria for including
them in the numerical programs.
4
16. 2.2 Analytical models
2.2.1 Isotropic plate
For the considerations of this thesis, a plate is a thin-layered isotropic linear element, whose
thickness is relatively small compared to its width and length. This element is loaded with lin-
early distributed loads (Qx, Qy), moments (Mx, My, Mxy) and a surface load in the direction
of z. The isotropic plate follows the theory as introduced by E. Mazza in [8].
The displacements are considered with the following approach, similar to beam theory:
uz = w(x, y) + f (x, y, z)
ux = −z · w x (2.1)
uy = −z · w y
Where w is the vertical displacement of the plate middle-plane. Strains are derived from
the kinematic relations.
εxx = −z · w xx εzz = f z
εyy = −z · w yy εxz = 1
2 · f x (2.2)
εxy = −z · w xy εyz = 1
2 · f y
The function f is selected to comply with:
σzz = (2µ + λ) · f z + λ(−zw xx − zw yy) = 0 (2.3)
Where µ and λ are Lamé constants. Plate stiness is dened as:
D =
Et3
12(1 − ν2)
(2.4)
After deriving the moment equations and making a balance of forces, the nal plate equation
comes to light:
D · (w xxxx + 2w xxyy + w yyyy) = p(x, y) (2.5)
w =
p(x, y)
D
(2.6)
In the case of a simply supported plate, the deection can be describe with a mathematical
approach as a double sum of trigonometric functions, as presented in [17] and [8], like:
w(x, y) =
∞
m
∞
n
wmn · sin
mπ
a
x · sin
nπ
b
y (2.7)
5
17. The load is also a sum of terms in the following manner:
p(x, y) =
∞
m
∞
n
pmn · sin
mπ
a
x · sin
nπ
b
y (2.8)
Where Pmn denes the force which loads the plate. An even pressure sets this coecient
as:
pmn=
16p0
π2mn
for m, n = 1, 3, 5... (2.9)
Equations (2.7), (2.8) and (2.9) are set into equation (2.6) and solved to obtain wmn.
Now w(x, y) can be obtained, and if x and y are set to
1
2, the maximum deection can be
found. Further denitions for the load, and a solution example for a specic width/length
ratio can be found in [8].
2.2.2 Orthotropic plate
The orthotropic approach denes plate stiness to be dependent upon dierent variables in x
or y direction. Dierent plate stiness coecients mainly aect the general plate equations
(2.5) and (2.6). The bending rigidities are dened in [11] as Dxx and Dyy, the coupling
rigidities by D1 and D2, and the torsional rigidities as Dxy and Dyx. The result leads to:
Dx
∂4w
∂x4
+ 2H
∂4w
∂x2∂y2
+ Dy
∂4w
∂y4
= p(x, y) (2.10)
Where:
2H = (Dxy + Dyx + D1 + D2) (2.11)
Following Cusens' and Pama's model for slab stiened with solid ribs, the plate is considered
with dierent heights and thicknesses on the stieners, and to some extent considers also the
eect of the Poisson's ratio in the intersection areas of them. Since the value of 2H can only
be noticeably high when the stiener's eccentricities ex and ey are large, a recommended and
simplied equation is also provided. The resultant collection of equations is:
Dxx = D +
E∗tx
6bx
hx − ex −
t
2
2
· (2hx + ex + t) − ex −
t
2
2
(ex + t)
(2.12)
Dyy = D +
E∗ty
6by
hy − ey −
t
2
2
· (2hy + ey + t) − ey −
t
2
2
(ey + t)
(2.13)
2H = Bxy + Byx + 2D (2.14)
6
18. Where Bxy, Byx and E∗ are dened as:
Bxy =
Gkt3
xh
bx
(2.15)
Byx =
Gkt3
yh
by
(2.16)
E∗
=
E
1 − ν2
txty
bxby
(2.17)
2.2.3 Plate stability
For considerations on stiener stability, a relevant approach used by Mazza in [8], which
considers a plate simply supported in three sides, with one free side. The approach for
deection is:
w = y · sin
mπx
a
(2.18)
After denition of the potential energy and the displacement of the load introduction point,
the critical distribute force is:
Q = Ncrit
x =
π2D
b2
6(1 − ν)
π2
+ m2
λ−2
λ =
a
b
(2.19)
Where D is the plate stiness as expressed in (2.4), a is the length of the free side, and b
the remaining perpendicular sides. The variable m indicates the buckling forms, and should
be considered as m = 1 for conservative analysis.
2.3 Finite Element Analysis
The main steps of a structural FE analysis, from [6], can be summarized as follows:
1. Preprocessing
a) Importing of data
b) Construction of geometry
c) Binding of geometry
d) Element equations
e) System of equations
f) Boundary conditions
7
19. 2. Main processing
a) Equation system solution
3. Postprocessing
a) Element displacements
b) Stress outputs
c) Strength criteria
d) Visualization
While the mentioned steps are fully valid for a structural analysis, the FE specic outputs
may dier from uid FE analyses, thermal analyses, and many others.
The 2008r1 version of Patran software is mainly divided into the following modules:
Geometry Provides commands to work with geometry, considering this as a broad group of
all model data which are not nite elements.
Elements A preliminary step is required for any surface or solid: a mesh seed is created
to guide the construction of a mesh, which can also be governed by a mesh control
command. The user must create isolated mesh seeds for every surface. Once the mesh
is ready to be created, selection of element type, mesher, topology, target geometry list
and properties are the next step. The equivalence command (targeted only to nodes)
is a powerful and easy way to bind elements into a single FE model.
Loads/Boundary Here the user is able to create, modify, tabulate, plot or delete boundary
conditions in the model.
Materials In this module the user can input material properties. Materials may be isotropic,
orthotropic, uids, among others. It is recommended to input only elastic modulus
and poisson ratio on isotropic materials, as the software will calculate shear modulus
automatically.
Properties This module provides specic property input options for all created elements,
and creates a list for each one indicating the application region. 2D element's thickness
and material can be changed here. 1D element's cross-section may be also dened
here. Orientation of the cross-section can be shown with the menu command: Display,
Load/BC/Elem props; and setting Beam Display options to 3D. Further details are
provided in the Patran software documentation.
Load Cases All relevant Load cases are built here, considering dierent combinations of sets
previously established in the Loads/Boundary module.
Analysis In this module the main processing is executed. When the action option Analyze is
selected, the desired load cases can be specied and turned into sub cases, which will
be used for the analysis. The Nastran solver will not run if the Conguration Utility is
not correctly modied to locate the executable le. The action option Access Results is
8
20. used to select the output le from the solver. For a new analysis, the user must delete
the existing job solution le with the corresponding command.
Results Here the results can be displayed by means of a deformed model, or by using a
fringe which maps the selected criteria using a colored scale. Fringe, deformed plot,
and animation options are also available.
The specics regarding element formulation, systems of equations, shape functions and others
FE concepts are very problem-dependent. Further details are found on [6]. Modern FE
programs like MSC Patran provide a useful graphic user interface, skipping all detailed problem
formulations.
2.4 Optimization
2.4.1 General notions
Optimization is a relatively modern discipline, nevertheless the nature of it dates way back
from the beginning of engineering. Once a satisfactory solution for a determined problem is
found, the designer is driven by logical sense to minimize the consumption of resources to the
lowest minimum possible, achieving the same solution at a higher eciency. This translates
into lower manufacturing costs, increased production volumes, and ultimately larger prot
margins for the involved parties.
Optimization can be expressed as algorithms which examine a search space of variables
and analyze a given problem with them, nding a minimum of an established function. The
algorithm formulation can be mathematical or evolutionary, as described by G. Kress in [5]:
Mathematical programming: These ...assume the optimization objective to be formulated
in terms of continuous and, often, at least twice dierentiable functions that should
also be convex.[5]. Mathematical programs usually take less numerical eort that their
counterparts, the evolutionary.
Evolutionary algorithms: Such types of programs are assisted by stochastic or heuristic
methodologies, succeeding on discrete search spaces where discontinuities cause math-
ematical analyses to fail. This is the situation for many practical applications, where
solution spectrum can only consider predetermined shapes or proles.
A useful approach at programming optimization problems from Eschenauer is also presented
and described in [5], and consists of the three following columns:
Structural model: The problem is translated into a structural formulation, which must be
solved to obtain the desired output variables. These can then be evaluated to assess
the status of the current iteration. Usually an FE solution software will handle these
calculations.
Optimization Algorithm: This column comprises the iteration control system, which im-
ports an initial variable vector x0 and computes the required results. The algorithm
9
21. keeps analyzing the resulting improved vector xi in each iteration, creating an objective
function whose minimum is adjusted to reect the optimized solution.
Optimization model: The bridge between the results of the structural model in every iter-
ation and the optimized solution is created by this column. Respecting all constraints
will be complicated without a systematic approach. At this point, constructing a Global
Objective Function (GOF) will require transforming all constraints and structural results
into one continuous function.
2.4.2 Global objective function formulation
There are several aspects to be considered while formulating a GOF.
Local optimality: For structural models, failure is a local concern, and minimizing the peaks
of the governing failure criteria is always the main task. This is expressed as:
min{max{σeqv(spatial position)}} (2.20)
The statement (2.20) may also be aected by constraints on the input design variables
of the structural model, in which case a function to continuously describe the behavior
is required, namely the Global Objective Function, or GOF.
Constraints: These are classied into equality constraining functions hj(x) or inequality
constraining functions gi(x), whose behavior must be:
gi(x) ≤ 0 i = 1, 2, ..., m
hj(x) = 0 j = 1, 2, ..., n
Where m and n are the amount of corresponding constraints. They dene a feasi-
ble region where the function evaluates to the structural results, but when violated,
a penalty term is included in the GOF, providing a higher function evaluation, and
therefore causing the optimization algorithm to avoid current x input values.
Pseudo objective function: Since the GOF is now actively linked with the constraints, it is
also named Pseudo function Ω. Interior or exterior point penalty methods are used to
introduce these constraints into the function. Using exterior point penalty methods,
the Pseudo function converts to (2.21).
Ω(x,R) = R
m
i=1
{max[0, gi(x)]}2
+ R
n
j=1
{hj(x)}2
(2.21)
Further useful denitions are found in [5].
10
22. 3 Problem denition
3.1 Conventions
For the following study, these conventions are considered:
ˆ The radix symbol, namely the decimal mark, will be represented by a point. Example:
93.45 Pa.
ˆ Three-digit grouping symbol will be represented by a comma. Example: 1,240.05 m.
ˆ The units along the document will be expressed in the International system of units
(SI).
ˆ The Coordinate system for FE modeling is similar to the front spar system: X =facing
port side, Y =facing tail, Z =facing upwards.
3.2 Project requirements
Even if the objectives for this thesis are focused on compliance of design criteria and mass
reduction, the overall cost reduction objective of the project is always kept in mind. COA-
LESCE2 project documents provide a detailed denition of all requirements and considerations
for this dimensioning study, further details can be found on [13]. Main aspects are described
in the following sections.
3.2.1 Operating conditions
Three main operating conditions are considered:
Cruise Conditions (CC): These are the basic operating conditions.
Limit Load (LL): These load conditions are dened as: LL = 2.5 × CC
Ultimate Load (UL): Equivalent to UL = 1.5 × LL = 3.75 × CC
All design criteria are scaled and considered accordingly throughout the thesis.
3.2.2 Design factors
Factor of safety This factor corresponds to the category of the FLE component. Any Cate-
gory C structure is dened in [13] as a structure whose failure does not aect the UL
capability of the aircraft, i.e. structure may detach. Access panels are considered into
this category. These factors refer to CC, LL and UL, as previously dened.
11
23. Defects and damage Consideration is given to defects and damage should they occur during
manufacturing and assembly processes. For stress analysis, a guideline of Rdd = 1.1 is
used in the design to allow for likely damage and defects.
Damage tolerance and fatigue As a Category C structure, a reserve factor of 1 will be used
to account for in-service fatigue and damage tolerance, as specied in [13].
Variability The design considers variability of the material. For unqualied materials the
design incorporates some conservatism, and for stress analysis in metallic structures the
reserve factor is set as Rvar = 1.06.
3.2.3 Repair Philosophy
Easiness of repair is also a concern in all stages of the project. Integral stieners examined
in this thesis provide a low cost solution, but also have the advantage of fully visible surfaces
which can be inspected without further complications. Further nal considerations of the
project will determine if the structure is repairable by means of a permanent repair; or if the
damage is outside allowable damage limits, then the damaged component is either replaced
before next ight or a simple temporary repair is applied and the component is replaced at
the next scheduled maintenance check.
3.3 Access panel requirements
For the access panel, a set of requirements was established, all listed in [13].
3.3.1 Air tolerances
Deection limits on the FLE skin are also an important consideration. The aircraft's aero-
dynamic variability on performance and reliability will be proportional to the variations on
the outside skin prole. Therefore, a ±δ tolerance on this variation is determined in the
requirements document [13], as shown in the gure 3.1.
These tolerances apply to cruise conditions.
3.3.2 Panel strength
Failure criteria is dependent of material. The considered aluminum alloy Al 7475T7351 has
the following properties at room temperature:
ˆ E = 71,000 MPa
ˆ Poisson ratio ν = 0.33
ˆ Ultimate tensile strength: Ftu = 450 MPa
ˆ Ultimate bearing strength: Fbru =710 MPa
ˆ Ultimate shear strength: Fsu = 290 MPa
12
24. Figure 3.1: Air tolerances denition from [13]
ˆ Tensile yield strength: Fty = 365 MPa
ˆ Bearing yield strength: Fbry = 565 MPa
ˆ Compressive yield strength: Fcy = 415 MPa
3.3.3 Stieners' stability
Stability is considered individually for spanwise and chordwise stieners. The operating loads
are compared to the buckling loads: the stieners are not allowed to have a reserve factor
lower than 1 for LL, as dened in [13]. The formula (2.19) is adjusted to obtain the critical
stress in the stiener:
σcrit
=
π2Et2
12b2(1 − ν2)
6(1 − ν)
π2
+
b2
a2
(3.1)
The free side dimension is considered as the top side of the stieners. All remaining sides
are analyzed as simply supported, allowing for some conservativity, since they are integral
stieners completely xed to the panel. All terms of σcrit are dened in chapter 2.
3.3.4 Connections strength
Fasteners are considered as annealed AISI 302 stainless steel screws, with Young's modulus
E = 190 GPa, ultimate strength Ftu = 655 MPa and tensile yield strength: Fty = 260 MPa.
13
25. Figure 3.2: Conventions for pressure from [12]
3.4 Loads
The panel is subjected to two main operating loads, described in the following subsections.
3.4.1 Aerodynamic pressure
Loads come from the ight envelope, as shown in the COALESCE2 baseline loads document
[12]. Pressures are expressed in Pascals and dened as positive if they tend to explode the
D-nose outwards and negative if the D-nose tends to collapse inwards, as shown in gure 3.2.
The access panels are located in the η position between 0.667 and 0.811, which dene
in a unitary scale the distance from aircraft center coordinate frame to the wing tip. More
details on wing sections can be found on [12]. There are two access panels installed in these
positions, however for the study of this semester thesis, only the access panel with the largest
dierential pressure is selected:
ˆ Maximum average dierential pressure between η positions [0.667,0.714] is: Pmax =
9, 490 Pa
ˆ Minimum average dierential pressure between η positions [0.667,0.714] is: Pmin =
−22, 360 Pa .
ˆ Pmax and Pmin are given as UL.
ˆ In any analysis, these loads are multiplied by Rdd and Rvar factors.
3.4.2 Wing bending
Wing bending must also be considered. The information regarding the displacements of
the landings is obtained from the excel spreadsheet [1] for the COALESCE2 Project which
contains details about the front spar deection. The lower area from this spar is geometrically
located in the same zone as the access panels, making the deformation prole valid for its
use.
14
26. Load Case Name Description
LC-1-0 Minimum Pressure
LC-2-0 Maximum Pressure
LC-0-1 Upward Bending
LC-0-2 Downward Bending
LC-1-1 Minimum Pressure and Upward Bending
LC-1-2 Minimum Pressure and Downward Bending
LC-2-1 Maximum Pressure and Upward Bending
LC-2-2 Maximum Pressure and Downward Bending
Table 3.1: List of load cases
3.5 Load cases
Load Cases are constructed and identied with: LC-X-Y, where
X letter: Pressure denition, which can take values of 1 for minimum pressure or 2 for
maximum pressure.
Y letter: Bending denition, which can be 1 for upward bending, or 2 for downward bending.
A value of 0 indicates no load in the corresponding letter. The table (3.1) shows a short
description for each load case. This information is placed into the load cases module on
Patran.
15
27. 4 Analytical modeling
For describing the deection of the access panel, and following the work structure of this thesis
presented in 1.1, the rst approach was an analytical model. There were two initial approaches
until a nal adaptive model was obtained, which considers isotropic and orthotropic plate
behavior. The reason for this analytical phase was to nd a good estimate for all dimensions
by means of an initial parametric study. In a simplied and conservative approach for the
analytical modeling, the panel is considered as simply supported.
4.1 Initial approaches
4.1.1 Beam model
The problem was initially addressed as a beam bending simplication, where only a section
with one stiener was considered. The model considers a variability of the second moment of
inertia, namely the cross section, along the length of the equivalent simply supported beam
being deected. The dierent cross-sections and their position in the access panel are shown
in gure 4.1. The height of the cross-section, where there is an angle in the extremity of the
stiener, also changes with every step along the analysis. The iteration begins from the left
of gure 4.1 and ends on its right side. An equivalent beam is constructed considering only
one stiener, with stiener height and stiener pitch as relevant dimensions. As the iteration
position shifts through the beam, cross-section dimensions are changed.
This model obeys the equation of elastic curve for a simply supported beam, as explained
by P. Beer in [4] and shown in equation (4.1).
d2y
dx2
=
M(x)
EI
(4.1)
Figure 4.1: Cross-sections considered in the iterative beam model.
16
28. Figure 4.2: Prole of deection, beam model with variable cross-section.
As the cross-section changes from the thickened outer plate, to the skin plate and the
stiener dimensions, the moment of inertia is adjusted accordingly. This is done using the
Parallel-axis theorem, shown in (4.2).
Ix =
ˆ
A
y2
dA = Ix + Ad2
(4.2)
The equations were programmed with iterations on MATLAB. The resultant prole from
the beam deection can be seen in gure 4.2.
Deections obtained with this model obtained a realistic accuracy. Nevertheless, such a
simplied model is useful mainly as a reference for later examinations, as it carried several
assumptions that diered from reality, such as:
ˆ Simply supported spanwise edges
ˆ Unsupported chordwise edges
ˆ Ability to consider only chordwise stieners
4.1.2 Isolated orthotropic model
An orthotropic plate model was sought as an approach to obtain more realistic solutions.
Models and derivation process from [8] proved themselves quite useful at this stage. After
literature research, consideration of stieners in a plate was found to be wide subject, treated
by many authors. A useful understanding on the matter was provided by [18], and deeper
details were presented in [11].
The equations for orthotropic balance (2.10) and torsional coupling (2.11) are set into
the general plate equation (2.6) to generate a new equation that describes an orthotropic
behavior.
Moment denition gives:
17
29. Mxx = D11
− ∂w0
∂x2
+ D11ν21
− ∂w0
∂y2
Myy = D22
− ∂w0
∂y2
+ D22ν21
− ∂w0
∂x2
Mxy = D66
− ∂w0
∂x∂y
After the balance, the pressure is found to be dened as:
P = D11
∂4w0
∂x4
+ D22
∂4w
∂y4
+ ν21(D11 + D22)
∂4w
∂x2∂y2
+ 4D66
∂4w
∂x2∂y2
(4.3)
At this point, equations from [8] have an identical plate stiness D coecient, leading to
Eq. (2.5). Deection follows the mathematical approach of fourier series from Eq. (2.7), but
adjusted to the orthotropic terms. The nal transformation of the general isotropic plate Eq.
(2.6) to orthotropic yields:
0 =
∞
m
∞
n
wmn D11
mπ
a
4
+ (ν21(D11 + D22) + 4D66) (4.4)
·
mπ
a
2
nπ
b
2
+ D22
nπ
a
4
− Pmn · sin
mπ
a
x · sin
nπ
b
y
An abbreviation is introduced:
2H = ν21(D11 + D22) + 4D66 (4.5)
And the unknown wmn, part of the double sum approach (2.7), is now equal to:
wmn =
Pmn
D11
mπ
a
4
+ 2H ·
mπ
a
2
nπ
b
2
+ D22
nπ
a
4
(4.6)
Pmn is selected depending on the type of pressure. For the case of this study, a uniform
pressure over the plate is dened as:
Pmn =
16p0
π2mn
for m, n = 1, 3, 5, 7...
To nd the maximum deection at the middle point, x and y positions are set, and a new
variable is introduced:
18
30. Figure 4.3: Adaptive orthotropic plate model regions.
x =
a
2
, y =
b
2
, ψ =
b
a
The maximum deection is then found as:
wmax =
16p0
π6
a4
·
k
m
k
n
ψ4
mn · (D11m4ψ4 + 2H · m2n2ψ2 + D22n4)
·sin
mπ
2
·sin
nπ
2
(4.7)
This equation is programmed on MATLAB to obtain values. In this program, for compu-
tational time reasons, ∞ from the sum in Eq. (4.4) is only iterated up to a k value. Best
approximations are achieved with value ranges of k = [150, 200]. Large values only result in
excessive computation time without substantial gain on accuracy.
4.2 Adaptive orthotropic model
A full orthotropic model was constructed which considered specic areas of the panel, applying
plate equations to isotropic and orthotropic regions correspondingly. The access panel was
split into these regions for the model, as depicted in gure 4.3.
The iterative numerical models built before had worked suciently good, therefore the
same approach was considered. The new model is able to:
ˆ Distinguish from isotropic and orthotropic areas automatically. (Feasible and unfeasible
areas for each set of equations)
ˆ Build separate stiness constants for each section.
ˆ Scale the equation boundaries to each area size.
19
31. ˆ Be always actively analyzing the Fourier series, but neglecting plate deformations in the
unfeasible areas.
ˆ Create a nal deformation plot for examination and sensitivity analysis.
The model was adjusted according to the requirements, and programmed in MATLAB. For
accurately describing the deection of the access panel of the FLE, the analytical model was
dened as:
w(x, y) =
Ω
i
wi
xi, yi ∈ Ω : wi = wmn
xi, yi /∈ Ω : wi = wxp
(4.8)
Where Ω refers to the dened number of access panel regions, namely the isotropic outer
and inner skin, and orthotropic stiened area. Deection wmn comes from the Fourier series
when the xi, yi coordinates correspond to the desired area. Otherwise, wxp is calculated as
an extrapolation from previous deections, neglecting the plate formula from feasible areas
and describing a prole that describes no contribution to deection on the unfeasible areas.
The deection alternatives are described as:
wxp = w(xi−1, yi) + [w(xi, yi−1) − w(xi−1, yi−1)] (4.9)
wmn =
∞
m
∞
n
Pmn · a4
i
ψ4
mn · (Dxxim4ψ4 + 2Hi · m2n2ψ2 + Dyyin4)
(4.10)
·sin
mπ
ai
(xi − uxi) · sin
nπ
ψiai
(yi − uyi) for m, n = 1, 3, 5...
Chordwise plate length is ai, and Pmn is taken as previously dened. All orthotropic plate
constants are obtained from [11], and are adjusted dierently in every iteration when the area
regions require them to be so. They are dened as:
Dxxi =
D +
E ∗ tx
6bx
hx − ex −
t
2
2
· (2hx + ex + t) − ex −
t
2
2
(ex + t)
i
(4.11)
Dyyi =
D +
E ∗ ty
6by
hy − ey −
t
2
2
· (2hy + ey + t) − ey −
t
2
2
(ey + t)
i
(4.12)
2Hi = Bxyi + Byxi + 2Di (4.13)
20
32. Figure 4.4: Prole of deection, adaptive orthotropic plate model.
Di =
Et3
i
12(1 − ν2)
(4.14)
Other required variables like Bxy, Byx, E∗are also adjusted accordingly to each iteration.
Chosen variables for the model are:
ψi =
bi
ai
(4.15)
uxi = x1(Ωi) − x1(Ω1) (4.16)
uyi = y1(Ωi) − y1(Ω1) (4.17)
The introduced ψ factor helps simplify the equation, and the uyi and uxi factors shift the
initial boundaries for the plate equations. Figure 4.4 shows a deformation prole created by the
model. Notice the dierent change of deformations from coordinates to others, demonstrating
isotropic and orthotropic (stiened) deection.
4.3 Sensitivity Analysis
Once the model was complete, it was tested with dierent congurations to investigate the
inuence of several variables. Some of them proved to be relevant, as shown in 4.5. While
the stieners have indeed an inuence on deection, the most important role is taken by the
skin thickness. Nevertheless, it cannot be changed easily, because its eect on mass is high.
All variables have a linear impact on mass. The height of the chordwise stieners has more
21
33. Figure 4.5: Sensitivity analysis graphs
inuence than the amount of stieners as well. Spanwise stieners seem to be unnecessary,
but later approaches will reveal their importance. At this stage of the work, there is a clear
impression of trade-os between variables, where parametric studies or optimizations are the
best option.
22
34. 5 Finite element modeling
For the results regarding this project, MSC's Patran was the software of choice, in which a
good estimation obtained from the sensitivity analysis was modeled. This is the following
stage in the semester thesis according to the work structure in gure 1.1.
5.1 CAD surface model
The CAD geometry required by COALESCE2 has a complex curvature along the plate skin,
and even if it can barely be seen at rst sight, the model should take it into account. Therefore
the nal results must be based in the skin plate as extracted from the aerodynamic proles
determined by industry partners.
An initial CATIA solid model was provided from start, out of which this skin curvature
features could be extracted. The model required adjustments, as the integral stieners were
modeled from scratch.
As import le for Patran, a surface geometry was required. Surfaces were then extracted
from the solid model for this purpose, including panel skin and stieners. The nal model is
shown in gure 5.1.
Later attempts to generate a mesh revealed that element distortion was proportional to
individual surface complexity. The surface model had to be adjusted a few times, until all
shapes were mostly reduced to single rectangular splits. The mesh seed could then be easily
placed on the sides of the squares, and the mesh is created uniformly.
5.2 Modeling considerations
The access panel is split into dierent areas:
ˆ Edge skin thickness
Figure 5.1: Surface model extracted from solid geometry
23
35. ˆ Inner skin thickness
ˆ Chordwise stieners
ˆ Spanwise stieners
ˆ Equivalent middle rib contact zones
Each area was congured with its corresponding skin thickness.
5.2.1 Fasteners modeling
Fasteners were modeled according to a suggestion from M. Brethouwer in [2]. The goal of his
approach was to accurately obtain the deection of the panel during the analyzed conditions.
In previous works [7], the fasteners have been modeled as MPC, which indeed served to
transfer displacements and rotations, however it doesn't provide any information about the
fasteners. Another eect had to be considered, namely the prying eect, which causes stress
on the edges of the panel. The latter is addressed in the next subsection.
To model fasteners, bush and beam elements were set into the model. Bush elements
represent the fasteners, and they can only be loaded in compression. They work with a spring
constant, which was determined from:
K =
F
uz
(5.1)
uz =
ˆ
L
εz =
ˆ
L
F
AE
(5.2)
The fasteners are considered as annealed AISI 302 stainless steel, with E = 190 GPa,
length of 1.8 mm (half of skin thickness in fastener area), and diameter Ø = 6.35mm. The
result was K = 3, 342, 861.84 N/mm. The beams were set with a square cross-section of side
length l = 3mm, merely to provide enough support to consider the prying eect.
Figure 5.2a depicts the location of fasteners in the model, while gure 5.2b shows the
beam and bush elements in vertical position, connecting upper and lower elements, which
correspond to the landings and access panel.
5.2.2 Prying-eect considerations
As previously said, boundary conditions on the access panel are fully modeled with fasteners
and prying-contact zones, as suggested in [2]. When the bush elements are subject to tension,
the beam elements absorb the stress, transferring it to the panel. Nonetheless, partners of
this project have regarded these criteria as non-critical, due to the redistribution of loads all
over the contact zones between the panel and the landings.
Figure 5.3 from [14] shows an example of prying eect.
24
36. (a) Location of fasteners (b) Zoomed view to
bush elements
Figure 5.2: Beam and bush elements
Figure 5.3: Illustration of prying eect, as taken from [14].
25
37. Figure 5.4: Position of middle ribs above access panel, halfway along the spanwise length.
5.2.3 Rotational constraints on rib zones
The area corresponds to contact zones with equivalent properties set to simulate the con-
straints imposed by the middle ribs. These limit the rotations of the contacting surfaces, as
the ribs are considered to be notoriously stable compared to the bare panel skin. The middle
ribs can be seen as reference in gure 5.4. Because of their stiened construction, they are
considered to constrain rotations of Y and X axis on the contacting elements.
5.2.4 Element selection
To describe the behavior of the access panel, Quad4 shell elements were set all over the model.
Prior to the beginning of this study, a conclusion was made between academic and industrial
partners to employ shell elements instead of oset beams for modeling the stieners. This
procedure was decided due to the benets of higher accuracy from the results that could be
obtained with this element, and also because stieners were no longer a secondary priority
but the main focus of the work. A better mapping of stress on the stiener was also an
advantage.
On the extremities of the stieners, a triangle section was cut at a determinate angle to
eliminate excessive material, which in turn resulted in triangular surfaces. As mentioned in
section 4.6 of [6], standard 3-node triangular shell elements are unable to map bending stress
and deformations accurately by nearly half. Since the introduction of bending from the plate
into the stieners takes place in these elements, this issue could not be left out. Therefore the
selection on these areas was changed to Tria6 elements, or middle-node triangular elements,
which have increased precision for bending applications. Figure 5.5 shows one side of stieners
with tria6 elements in dierent color.
5.2.5 Support landings
An area above the outer skin was modeled to simulate the landings, or surfaces where the
access panel is connected. In this areas, there are connections to the fasteners and beam
26
38. Figure 5.5: Tria6 mid-node elements shown in the triangular extremity of the stieners
elements for prying-eect. This area is given a thickness of 8mm, and its edges are constrained
in rotations and displacements. This way the landings hold their place when the loadcase
does not include wing bending. Corresponding displacements can be introduced if the load
case also includes wing bending.
5.2.6 Wing bending
Introducing the wing bending into the access panel was another important condition. This
could be done in a simple manner by setting displacement on the edges of the access panel,
but a more realistic approach was suggested and chosen, using important input from a wing-
bending calculation le provided by the project partners [1].
The purpose of this le was characterizing the deection of the front spar regarding the
wing bending, and the results could also be extracted since the access panel rests on the lower
edge of the front spar. The le also accounts for osets in Z direction.
Displacements are dependent upon the mentioned oset. A measure from the spar coor-
dinate system to the panel surface equals to 41 mm. Category C structures like the access
panel are not UL critical, therefore a LL should be sustained. Oset is then selected as:
Zoffset = −41 mm · LL = −102.5 mm
The oset is taken as −100 mm. This data is typed into the excel spreadsheet, which
calculates the x and z for the selected node. A row of nodes was selected every 100mm,
as shown in table 5.1a. The resulting displacements per row are shown in 5.1b.
5.3 Comparison to analytical model
The load cases previously dened were programmed and introduced in the solver. For this
study, MSC Software's Nastran was used during all runs. There were no complications using
the software, other than correctly setting the conguration utility from Patran.
27
39. X position Y position Z position
0.0 0.00 -100.00
100.00 0.00 -100.00
200.00 0.00 -100.00
300.00 0.00 -100.00
400.00 0.00 -100.00
500.00 0.00 -100.00
600.00 0.00 -100.00
700.00 0.00 -100.00
800.00 0.00 -100.00
900.00 0.00 -100.00
1000.00 0.00 -100.00
1100.00 0.00 -100.00
1200.00 0.00 -100.00
1300.00 0.00 -100.00
1400.00 0.00 -100.00
(a) Position of nodes for bending calculation
X Step Z
0.0 0 0.0
-0.15567 1 -0.0178
-0.31135 2 -0.07122
-0.46705 3 -0.16024
-0.62279 4 -0.28487
-0.77859 5 -0.44512
-0.93445 6 -0.64097
-1.09038 7 -0.87243
-1.2464 8 -1.1395
-1.40253 9 -1.44218
-1.55876 10 -1.78046
-1.71513 11 -2.15436
-1.87164 12 -2.56387
-2.02829 13 -3.00898
-2.18512 14 -3.4897
(b) displacement deltas on specic
nodes due to wing bending
Table 5.1: Wing bending information extracted from [1].
Results were obtained for tested load cases, examined on both stress and displacement re-
quirements. An initial result indicated compliance with requirements, however an optimization
was still part of the approach, and from those results a nal adjustment is made.
The local eects resulting from excessively thick stieners and large areas between them
is depicted in gure (5.6). The upper cut-section shows how the deection forms a wave
and the areas aected will no longer fully obey the analytical model. The areas close to the
stieners will follow the predicted deection prole by the orthotropic model, as shown in
the lower cut-section. This demonstrates the utility of the FE analysis to validate analytical
results.
Figure 5.7 illustrates a deformation plot obtained when analyzing loadcase LC-0-1, already
with an improved conguration. A comparison of accuracy of the analytical model with the
FE model is shown in table 5.2. The columns analytical and Nastran show the total
deection corresponding to their test congurations. The Variance 1 shows the increase
of each conguration with respect to conguration a. The Variance 2 shows the variation
of deection values between analytical model and Nastran, with regard to each single test
congurations, from a to g. These error values exist due to the local eects in the plate.
28
40. Figure 5.6: Local deection eects from inner skin of access panel.
Figure 5.7: Stress distribution on LC-0-1.
Test congurations Max deection [m] Variance 1 Variance 2
Chord-S Span-S Inner Skin Edge skin Analytical Nastran Analyt FE Analyt:FE
a 2 2 2 4 5.88E-04 4.89E-04 16%
b 4 4 2 4 5.88E-04 4.18E-04 0.00% -0.01% 28%
c 6 6 2 4 5.88E-04 3.91E-04 0.00% -6.42% 33%
d 2 2 4 4 5.88E-04 1.80E-04 0.00% -63% 69%
e 2 2 6 4 5.88E-04 1.19E-04 0.00% -34% 79%
f 2 2 2 6 1.74E-04 4.21E-04 -70% -14% -141%
g 2 2 2 8 7.35E-05 3.55E-04 -58% -16% -383%
Table 5.2: Comparison of error magnitudes of analytical model vs. FE model.
29
41. 6 Optimization
Once the rst stage of FE model and analysis was ready, it was time for design improvement.
As stated in the agreement, parametric studies were initially intended for this purpose. How-
ever, the ability to proceed with optimization algorithms was obtained and a program was
elaborated for this purpose.
An approach with mathematical programming was chosen for simplicity and time-eciency.
Constraints were provided by manufacturing, safety and the sensitivity analysis. Three
columns method was used, as described before in chapter 2. The model only considers
the most critical conditions for stiener placements, namely the maximum and minimum
pressure. It is also simply supported on the edges, and therefore only considers load cases
without wing bending (LC-1-0 and LC-2-0). More options for complexity can be added if the
project requires them, and a sucient timespan is determined to work on this.
6.1 Structural model
The problem was translated into a structural formulation using ANSYS software. The program
was written on the Mechanical APDL interface, where the whole structure is automatically
built using the inputs from the MATLAB algorithm. The program is written with all loads
and design criteria scaled to UL, also including Rdd and Rvar factors. When the ANSYS code
is executed, the following operations take place:
1. Parameter and variables denition.
2. Material, element properties and real constants denition (Isotropic, aluminum alloy,
thicknesses).
3. Cyclic keypoint construction according to number of chordwise and spanwise stieners
(*DO cycles).
4. Cyclic areas construction according to amount and position of keypoints.
5. Binding of areas with dierent thicknesses according to region.
6. Meshing with shell181 elements, with controlled numeration for all stieners and mesh
renement on triangular stiener extremities (Bending introduction).
7. Denition of boundary conditions, loads and constraints, as dened for LC-1-0.
8. Static solution, with storing of stress and deection data.
30
42. Figure 6.1: Real constants denition for ANSYS automatic model.
Vector variables Design parameters
stx_hi Chordwise stiener height
stx_th Chordwise stiener thickness
sty_hi Spanwise stiener height
sty_th Spanwise stiener thickness
Skt Skin thickness
Sa Stiener extremity angle
Table 6.1: Design parameters in optimization vector.
9. Localized comparison of spanwise and chordwise stieners to analyze buckling, with
data storage.
10. Global instability solution, with buckload analysis and data storage.
11. Cycle repeat from steps to 7 to 10, changing the loadcase to LC-2-0.
12. Writing of results le.
Figure 6.1 depicts step 5 of the operations, showing a specic property for each area according
to the region. The complete code can build automatically any panel geometry as required,
but the number of chordwise stieners is restricted to Nsx = [1, 20] , and chordwise stieners
are also restricted to Nsy = [0, 9].
6.2 Optimization Algorithm
The algorithm is controlled by MATLAB by a preset function called fminsearch, which nds
the minimum of an unconstrained multivariable function using the derivative free Simplex
method. The function starts with an initial estimate x0 and continues the search with xi
values as obtained from the simplex construction. The selected variables are shown in table
6.1.
Properties of chordwise and spanwise stieners (height and thickness), skin thickness, and
extremity angle of every stiener. The resulting variable vector was:
design parameters : x = { stx_hi , stx_th , sty_hi , sty_th , Skt , Sa } (6.1)
31
43. The clear advantage of this MATLAB algorithm was the time eciency due to the otherwise
required time for programming the simplex. The code was structured taking B. Schläpfer's
[16] as a general guide. All relevant commands were adjusted to the thesis requirements,
variables and constraints were added or deleted as necessary.
6.3 Optimization model
In order to create a continuous function including all constraints, the Pseudo-function ap-
proach for a GOF was used, as described in [5]. This method integrates penalty terms for
violation of constraints. The GOF analyzes terms with regard to:
Geometry There were manufacturing limitations to the geometry that could be created due
to the stability of the cutting tools, therefore a minimum thickness of 1.8 mm was
set for the stieners. Inner skin is also subjected to lightning safety standards, and a
minimum thickness of 2.0 mm is necessary. The sensitivity analysis from the analytical
model also provided useful information: additional constraints helped to reduce the
search space of the variables for the GOF. A good initial vector was also obtained from
the analytical approach. Any violation of these constraints activates a penalty term.
Design The access panel must withstand any buckling in either direction of the stieners,
as well as global instability. Utilization factors were established, which must not exceed
a unitary value. Also the displacement was subject to a tolerance, namely the ±δ air
tolerance described before. The stress distribution in the panel should also remain under
the UL admissible stress.
Mass The term regarding mass of the panel is always actively analyzed and minimized.
6.3.1 Constraints
A detailed table of constraints for the GOF is shown in table 6.2, where chordwise stieners
are referred as (x), and spanwise stieners as (y). If none of the constraints are violated, the
search for minimum of mass is the only active term. Mass and design terms were normalized,
and geometry terms scaled individually. ANSYS code transforms the scaled geometric terms
into International System units. Since the original air tolerance for the FLE is considered from
CC, they have to be adjusted in the optimization, which considers UL for both load cases.
±δnew = (±δ@CC)(LL)(UL) = (0.8mm)(2.5)(1.5) = 3.0mm
The nal GOF is introduced as:
Ω(M, di, gj, R, Rj) = R(M/Mexpected) +
i
1
R{max[0, di]}2
+
j
1
Rj{max[0, gj]}2
(6.2)
Where di are the design constraints, gj are the geometrical constraints, and Rj the penalty
factors. The expected mass was set to 3kg, value that has no relevant inuence on the result,
32
44. Constraint GOF term formulation Term type
min{mass} R(M/Mexpected) Mass
displacement ≤ 3mm R{max[0, (D − Dadmissible)]}2 Design
yield utilization ≤ 1.0 R{max[0, ((kY/kYadmissible) − 1)]}2 Design
Instability utilization ≤ 1.0 R{max[0, ((kI/kIadmissible) − 1)]}2 Design
Buckling(x) utilization ≤ 1.0 R{max[0, ((kBx/kBxadmissible) − 1)]}2 Design
Buckling(y) utilization ≤ 1.0 R{max[0, ((kBy/kByadmissible) − 1)]}2 Design
stiffener angle ≥ π/4 g1=0.785-Sa; R1{max[0, g1]}2 Geometry
stiffener angle ≤ π/2 g2=Sa-1.57; R2{max[0, g2]}2 Geometry
Height(x) ≥ height(y) g3=sty_hi-stx_hi; R3{max[0, g3]}2 Geometry
Height(x) ≥ 10mm g4=1-stx_hi; R4{max[0, g4]}2 Geometry
Height(x) ≤ 60mm g5=stx_hi-6; R5{max[0, g5]}2 Geometry
Height(y) ≥ 0mm g6=-sty_hi; R6{max[0, g6]}2 Geometry
Height(y) ≤ 30mm g7=sty_hi-3; R7{max[0, g7]}2 Geometry
Thickness(x) ≥ 1.8mm g8=1.8-stx_th; R8{max[0, g8]}2 Geometry
Thickness(y) ≥ 1.8mm g9=1.8-sty_th; R9{max[0, g9]}2 Geometry
Skin Thickness ≥ 2.0mm g10=2-Skt; R10{max[0, g10]}2 Geometry
Table 6.2: Constraints for the Global objective function
but had to correspond on magnitude to a real estimation. More details can be found among
the MATLAB code created for this thesis.
6.3.2 Algorithm execution
Figure 6.2 illustrates the behavior of the last execution of the optimization program running
with pseudo-function (6.2). The top plot from shows the GOF diminishing as the simplex
algorithm from fminsearch evaluates and nds the unconstrained minimum; the lower plot
shows the evolution of the design constraints: a value above 1.0 equals a violation and there-
fore a penalty in the GOF. The understanding of behavior and tendencies of the optimization
algorithm is improved in every run.
After the rst dozen of runs, it was evident that the algorithm was very sensitive to local
minima. The simplex then rarely changes the stiener quantities: Nsx (chordwise stieners)
and Nsy(spanwise stieners), which were originally part of the vector variables in table 6.1.
If it did change, since the current thickness and height setups were optimal for the starting
Nsx, Nsy conguration, a higher GOF value is found just across the border of the new
Nsx, Nsy conguration.
A selection of congurations was made, and several local minima were investigated. Since
the initial estimate was already compliant to requirements, a factor was include to cause an
aggressive behavior of the algorithm. This factor causes the optimization model to marginally
meet already violated design constraints in order to nd the best conguration. It also
accounts for a small safety margin for initial boundary slopes that come from accurately
modeling the fasteners, which is important because the ANSYS model considers a simply
33
45. Figure 6.2: Iteration graph from GOF in run 27.
supported plate. Since all runs have the same conditions, the chosen optimum is taken from
these results collection, and a nal adjustment of the Patran FE model is done afterward with
the selected conguration. The design terms variate freely over their feasible areas in order
to accommodate an optimal solution, nding the minimum mass for many possible stiener
congurations, namely the amounts of chordwise and spanwise stieners. Execution times
until a minimum is found last between 6 and 8 hours.
34
46. 7 Results
The work was initially addressed as a bending problem: directly following beam theory. The
possibility of adding stringers was considered due to the benecial beam bending properties,
even though it added complexity to the panel. The mass also increases due to the added
material on the stringers, thus the number of stieners had to be limited.
The obtained data from the sensitivity analysis clearly indicated that large stieners had a
clear eect on total mass. The trade-o between performance and mass had to be addressed,
which was the later purpose of optimization.
Figure 7.1 illustrates the results obtained from running the algorithm, investigating several
relevant local minima. The center of the pentagon represents a low mass solution, radially
increasing its value. Chordwise stiener congurations are represented with dierent lines,
which coincide with certain spanwise stiener congurations on the pentagon's vertexes.
The real problem is the local phenomena, where thin skin deformation is proportional to
area size between stieners. Increasing the close-to-skin stiness is the main concern, rather
than looking simplistically into moment of areas. Ultimately, skin deection will be mostly
unaected by stringers or relatively tall stieners.
The height and thickness ratios should be optimized for this purpose, as one variable is
strongly dependent from the other in terms of design constraints evaluation. They should
not be addressed individually, but rather with an optimization approach, or at the very least,
with a complete multidimensional parametric study.
From gure 7.1, the global minimum for the investigated dimensioning congurations is
selected:
Nsx = 8, Nsy = 1
The algorithms and models construct the panel with this conguration in each side of the
middle ribs, therefore the CATIA solid model has a total of 16 chordwise ribs and one single
spanwise rib, which is split in the middle due to the ribs. Figure 7.2 presents the nal CATIA
solid model.
The FE model was adjusted according to the latest optimization run. Table 7.1 shows
a comparison of mass reduction. The initial model was provided at the beginning of this
semester thesis. The improved model is obtained from the sensitivity analysis. The optimized
model is the result of the optimization algorithm. The initial model is taken from the rst
suggestion for this study (which did not fulll design criteria), and it's then adapted to
marginally comply with requirements. The cost reduction is obtained from COALESCE2
metallic versus composite le [15], where it can be seen that the integral stiener access
panel takes around 63% less time to be manufactured, and since adding or removing stieners
from the design only alters the path of the CNC machining, the inuence on the cost can be
35
47. Figure 7.1: Optimal mass search results
Figure 7.2: Final optimized CATIA model
36
48. Design type Initial design Improved design Optimized design Composite
Origin Airbus UK Sensitivity analysis Algorithm COALESCE2
Total mass 2.4518 2.3237 2.1137 1.475
Decrease of mass
from Initial design
0% 5.2% 13.7% 39.8%
Increase of mass
from composite
66.2% 57.5% 43.3% 0%
Cost reduction approx. 70% approx. 70% approx. 70% 0%
Table 7.1: Comparison of mass between models
neglected. It may even reduce it a little, since smaller stieners mean a thinner initial block
of aluminium for machining.
Table 7.2 depicts the obtained reserve factors for the required design criteria. Using linear
static analysis, the results obtained from the rst four load are summed to be valid for the
combinations of the remaining load cases. Requirements are given with regard to dierent
operating conditions in the documents, and even if they were adjusted accordingly during
the analysis, they are presented in the same operating conditions as they were given in
the documentation, namely CC, LL or UL. This way they can be directly compared to the
document requirements without further factor transformations. Factors from defects, damage
and variability are always considered. Buckling and Instability considerations are extracted
from ANSYS. Reserve factors for stress are given in LL and UL because the ratio of governing
stress criteria on them is not the same as the factor, therefore they cannot be scaled. The
relevant reserve factors are related to:
ˆ Rdisp: Maximum air tolerance
ˆ Rslope: Maximum mean slope (waviness)
ˆ Rstress: Maximum stress criteria
ˆ Rfast: Maximum fasteners strength
ˆ Rbuck−x: Buckling load of chordwise stieners
ˆ Rbuck−y: Buckling load of spanwise stieners
Factors indicated as N/R are not relevant to buckling considerations because on the given
load case, the stiener is under tension. The most critical reseve factor shown is Rstress =
0.99 at UL in LC-1-1, but is not considered critical due to the fact that only one node reaches
the stress level that contributes to that factor, as shown in gure 7.3. Moreover, this node
is located exactly at the base of a spanwise stiener, where the manufacturing radius cannot
be considered in the FE model. Therefore, in reality it would have lower stress values in the
zone.
Figure 7.4 illustrates how the stress in the stieners is isolated and extracted for buckling
analysis. Figure 7.5 shows a plot with the largest deformation from all four basic load cases,
namely LC-1-0.
37
49. Load case Rdisp Rslope Rstress Rfast Rbuck−x Rbuck−y
Operating
conditions
CC CC LL UL LL UL LL LL
LC-1-0 3.36 1.86 4.38 3.60 603.72 1013.93 N/R N/R
LC-2-0 8.80 4.88 11.45 9.41 1585.37 2662.60 29.94 549.35
LC-0-1 3.33 1.85 1.65 1.36 398.77 669.73 6.24 25.59
LC-0-2 7.69 4.27 3.34 2.74 955.88 1605.39 15.09 61.86
LC-1-1 2.15 1.19 1.20 0.99 240.15 403.33 13.80 29.14
LC-1-2 2.72 1.51 1.89 1.56 370.02 621.44 N/R 87.68
LC-2-1 3.57 1.98 1.45 1.19 318.63 535.13 5.17 24.45
LC-2-2 5.44 3.02 2.58 2.12 596.33 1001.53 10.03 55.60
Table 7.2: Reserve factors for the nal access panel dimensions
Figure 7.3: Region where one node causes a reserve factor Rstress = 0.99 for LC-1-1.
Figure 7.4: Extraction of maximum stiener stresses for buckling considerations.
38
51. 8 Conclusions
After analyzing the results, several concluding statements arisen:
Increased amount of Chordwise stieners Chordwise stieners do not act as beam ele-
ments in the panel, but rather as plate stiening components, providing additional
orthotropic properties to the access panel.
Reduce height/thickness ratio The material function is mostly used by limiting thin inner
skin deformations, therefore an increased height is unnecessary. Thickness of the sti-
eners shall also be kept to a minimum, but allowing stable operation risk-free from
buckling.
Inclusion of spanwise stieners If the orthotropic properties are improved, relevant defor-
mations will still arise from local phenomena. The small rectangular sections between
the stieners will act as single thin plate regions, increasing total deection. By includ-
ing spanwise stieners, these area sizes are easily reduced, and so is their inuence.
Find a balance: Orthotropic Isotropic The best design will usually lay between complete
isotropy and orthotropy. A thick unstiened plate, as isotropic solution, will still have
large deections. On the contrary, large and thick stieners will provide good orthotropy,
but their mass will also be large. If the number of stieners are reduced for lower
mass, large local phenomena will arise, yet again contributing to large deections. The
optimum often rests on a balance between both.
Meeting of requirements The achieved solution fullls all design requirement in the most
ecient way.
Optimum mass solution The mass is optimized within an acceptable range. The reserve
factors indicate ecient use of the material for limiting deformations and stress.
Cost ecient The resources saved from the manufacturing costs could be relocated to re-
duce weight in more critical parts of the aircraft. Nonetheless, integral stiened panels
are a cost and mass ecient solution for this dimensioning study.
40
52. 9 Outlook
The work done with this semester thesis opens possibilities for future engagements:
Advantage of optimization algorithm the optimization algorithm is ready to be used with
any geometrical model as desired. It is matter of modifying the FE program code and
changing variables as required. Other components may be also analyzed, taking full
advantage from the work done.
Bird strike requirement While the consideration of these requirements was not inside the
scope of the thesis, safety requirements are important for the FLE. The approach
would be dierent as well, with possibilities for kinematic and non- impact analysis.
Optimization opportunities may also be found on this topic.
Adapt to nal FLE design The access panel was dimensioned according to the latest CAD
specications. Should the FLE models be modied, the must be take into considera-
tions. Drive shafts and stiening nerves in ribs may require minor adjustments to the
nal access panel dimensions.
Advantage of analytical model The generated model is applicable to any stiened or un-
stiened plate. It could be applied to similar deection problems, using the latest
approach models available.
Expansion of analytical model Local eects and wing bending displacements are not eval-
uated in the analytical model. The applicability of the model would benet from
modifying it to consider these aspects.
41
53. Appendix A
MATLAB relevant code lines for the adaptive orthotropic plate model.
1 % BEGIN OF PROGRAM − SEMESTER THESIS 11−019
2 % PRELIMINARY DATA VARIABLES
3
4 % Material Input Properties:
5
6 v= 0.33;
7 E= 71e9; % Pa
8 G= 26.9e9; % Pa
9 rho= 2650; % density, [kg/m^3], KO8242
10 Rp02= 300e6; % Pa, KO8242
11 Rm= 390e6; % Pa, KO8242
12
13 % Stiffener Plate Configuration (raw variables, input data here)
14
15 sh= 0.020; % Stiffener height (x, Chordwise stiffener)
16 st= 0.0018; % Stiffener thickness (x, Chordwise stiffener)
17 shy= 0.010; % Stiffener height (y, Spanwise stiffener)
18 sty= 0.0018; % Stiffener thickness (y, Spanwise stiffener)
19 Ots=0.10403; % Offset to Starboard
20 Otp=0.12319; % Offset to Port
21 Otr=0.11889; % Offset to ribs
22 Ote= 0.000; % Offset to thickened edges
23 Dtm= 0.69; % Distance to middle plane of ribs [m]
24 Drs= 0.142; % Distance of Rib minimum spacing
25 Gh =sym('Gh'); % Girder height
26 Gl =sym('Gl'); % Girder lenght
27 Skt= 0.002; % Skin thickness [m]
28 Ste= 0.008; % Skin thickness on edges
29 Etw= 0.0274; % Expanded thickness width
30 Fo =0.016875; % Fasteners −centerline to perimeter− offset [m]
31 Sa =(pi()/4); % Stiffener borders angle [rad]
32 CL =0.204886; % Chordwise Stiffened Panel Lenght
33 SL =1.384; % Spanwise Stiffened Panel Lenght
34 L =0.1776; % Effective pin−ended plate lenght
35 Nsp= 7; % Number of stiffeners in Port side (x) Direction
36 Nss= 7; % Number of stiffeners in Starboard side (x) Direction
37 Nsy= 1; % Number of stiffeners in Spanwise (y) Direction
38
39 % Cusens, Pama 1975; for solid ribs stiffened slab, all following lines
40 Bxy= G*0.3*st^3*sh/sp;
41 Byx= G*0.3*sty^3*shy/spy;
42 H2= Bxy + Byx + E*(Skt^3/(6*(1−v^2))); % Cusens, Pama
43 Estar= E/(1− (v^2*st^2*sty^2/sp/spy));
44 Eprime= E/(1−v^2);
45 ex= (st*sh*(sh+Skt))/(2*Eprime/Estar*Skt*sp + st*sh); % excentricity from plate neutral plane to stiffened ...
plate neutral plane
46 Dxx= E*(Skt^3/(12*(1−v^2))) + Estar*st/6/sp*((sh−(ex−Skt/2))^2 *(2*sh+ex+Skt)−(ex−Skt/2)^2*(ex+Skt)); ...
%Cusens, Pama
47 ey= (sty*shy*(shy+Skt))/(2*Eprime/Estar*Skt*spy + sty*shy); % excentricity from plate neutral plane to ...
stiffened plate neutral plane
48 Dyy= E*(Skt^3/(12*(1−v^2))) + Estar*sty/6/spy*((shy−(ey−Skt/2))^2 *(2*shy+ey+Skt)−(ey−Skt/2)^2*(ey+Skt));
49 % End of Cusens, Pama
50
51 % GENERAL PLATE DEFORMATION, WHOLE STIFFENED PANEL (X,Y)
52
53 psi=(SL−2*Ote−2*Etw)/(CL−2*Ote−2*Etw);
54 jx=50; % segmentation in X direction, even number
55 jy=338; % segmentation in Y direction, even number
56 j3=39; % Set number of summations, odd number for even pressure distribution on Lagrange plate.
57 a=(CL−2*Ote−2*Etw);
58 y=zeros(jy+1,1);
59 x=zeros(jx+1,1);
60 whole=zeros(jx+1,jy+1);
61 plate1=zeros(jx+1,jy+1);
62 wxy=0;
63 last=zeros(1,jy+1);
64 maxlast=0;
42
54. 65 nx=0;
66 ny=0;
67 wstep_x=zeros(jx+1,jy+1);
68 wstep_y=zeros(jx+1,jy+1);
69 whole_fixa=zeros(jx+1,jy+1);
70 whole_fixb=zeros(jx+1,jy+1);
71 whole_fixc=zeros(jx+1,jy+1);
72 for nx=0:jx
73 x(nx+1)=nx*CL/jx;
74 for ny=0:jy
75 y(ny+1)=ny*SL/jy;
76
77 if ((0=x(nx+1) x(nx+1)=Etw) || ((CL−Etw)=x(nx+1) x(nx+1)=CL)) || ((0=y(ny+1) ...
y(ny+1)=Etw) || ((SL−Etw)=y(ny+1) y(ny+1)=SL))
78 plate1(nx+1,ny+1)=1;
79
80 % Fourier cycles for Etw plate section (outer thickened plate)
81
82 H2_a= E*(Ste^3/(6*(1−v^2))); % Cusens, Pama
83 D_a= E*(Ste^3/(12*(1−v^2)));
84 psi_a=SL/CL;
85 a_a=CL;
86
87 fourier_a=0;
88 for m=1:j3
89 if mod(m,2)~=0;
90 for n=1:j3
91 if mod(n,2)~=0;
92 % Sample from Mazza's S−Analysis
93 % f=1/(m*n*(m^2+ (n^2)/4)^2)*sin(m*pi()/2)*sin(n*pi()/2);
94 % fourier_a= fourier_a+f;
95 f_a=(psi_a^4)/(m*n*(D_a*m^4*(psi_a^4)+ H2_a*(psi_a^2)*m^2*n^2+ D_a*n^4)) ...
*sin(m*pi()*(x(nx+1))/a_a) *sin(n*pi()*(y(ny+1))/(psi_a*a_a));
96 fourier_a= fourier_a+f_a;
97 end
98 end
99 end
100 end
101
102 % End of Fourier cycles for Etw plate section (outer thickened plate)
103 whole_fixa(nx+1,ny+1)= −16*a_a^4*p0/(pi()^6)*fourier_a;
104
105 if 0x(nx+1) 0y(ny+1)
106 ystep_0=whole_fixa(nx+1,ny);
107 ystep_1=whole_fixa(nx+1,ny+1);
108 xstep_0=whole_fixa(nx,ny+1);
109 xstep_1=whole_fixa(nx+1,ny+1);
110 end
111 else
112 whole_fixa(nx+1,ny+1)=whole_fixa(nx,ny+1) + (whole_fixa(nx+1,ny) − whole_fixa(nx,ny)); % The magic ...
is here
113
114 if ((Etwx(nx+1) x(nx+1)=(Etw+Ote)) || ((CL−Etw−Ote)=x(nx+1) x(nx+1)(CL−Etw))) || ...
((Etwy(ny+1) y(ny+1)=(Etw+Ote)) || ((SL−Etw−Ote)=y(ny+1) y(ny+1)(SL−Etw)))
115 plate1(nx+1,ny+1)=2;
116
117 H2_b= E*(Skt^3/(6*(1−v^2))); % Cusens, Pama
118 D_b= E*(Skt^3/(12*(1−v^2)));
119 psi_b=(SL−2*Etw)/(CL−2*Etw);
120 a_b=(CL−2*Etw);
121
122 % Fourier cycles for Ote plate section (inner skin−only plate)
123
124 fourier_b=0;
125 for m=1:j3
126 if mod(m,2)~=0;
127 for n=1:j3
128 if mod(n,2)~=0;
129 % Sample from Mazza's S−Analysis
130 % f=1/(m*n*(m^2+ (n^2)/4)^2)*sin(m*pi()/2)*sin(n*pi()/2);
131 % fourier_b= fourier_b+f;
132 f_b=(psi_b^4)/(m*n*(D_b*m^4*(psi_b^4)+ H2_b*(psi_b^2)*m^2*n^2+ D_b*n^4)) ...
*sin(m*pi()*(x(nx+1)−Etw)/(a_b)) *sin(n*pi()*(y(ny+1)−Etw)/(psi_b*a_b));
133 fourier_b= fourier_b+f_b;
134 end
135 end
136 end
137 end
138
139 % End of Fourier cycles for Ote plate section (inner skin−only plate)
140 whole_fixb(nx+1,ny+1)= −16*a_b^4*p0/(pi()^6)*fourier_b;
141
142 if 0x(nx+1) 0y(ny+1)
143 ystep_0=whole_fixb(nx+1,ny);
43
55. 144 ystep_1=whole_fixb(nx+1,ny+1);
145 xstep_0=whole_fixb(nx,ny+1);
146 xstep_1=whole_fixb(nx+1,ny+1);
147 end
148 else
149 whole_fixb(nx+1,ny+1)=whole_fixb(nx,ny+1) + (whole_fixb(nx+1,ny) − whole_fixb(nx,ny));
150
151 if ((Etw+Ote)x(nx+1) x(nx+1)(CL−Etw−Ote)) || ((Etw+Ote)y(ny+1) y(ny+1)(SL−Etw+Ote))
152 plate1(nx+1,ny+1)=3;
153
154 fourier_c=0;
155 for m=1:j3
156 if mod(m,2)~=0;
157 for n=1:j3
158 if mod(n,2)~=0;
159 % Sample from Mazza's S−Analysis
160 % f_c=1/(m*n*(m^2+ (n^2)/4)^2)*sin(m*pi()/2)*sin(n*pi()/2);
161 % fourier_c= fourier_c+f_c;
162 % f_c=(psi^4)/(m*n*(Dxx*m^4*(psi^4)+ H2*(psi^2)*m^2*n^2+ Dyy*n^4)) ...
*sin(m*pi()*(x(nx+1)−Etw−Ote)/(CL−2*Etw−2*Ote)) *sin(n*pi()*(y(ny+1)−Etw−Ote)/(SL−2*Etw−2*Ote));
163 f_c=(psi^4)/(m*n*(Dxx*m^4*(psi^4)+ H2*(psi^2)*m^2*n^2+ Dyy*n^4)) ...
*sin(m*pi()*(x(nx+1)−Etw−Ote)/a) *sin(n*pi()*(y(ny+1)−Etw−Ote)/(psi*a));
164 fourier_c= fourier_c+f_c;
165 end
166 end
167 end
168 end
169
170 whole_fixc(nx+1,ny+1)= −16*a^4*p0/(pi()^6)*fourier_c;
171
172 if 0x(nx+1) 0y(ny+1)
173 ystep_0=whole_fixc(nx+1,ny);
174 ystep_1=whole_fixc(nx+1,ny+1);
175 xstep_0=whole_fixc(nx,ny+1);
176 xstep_1=whole_fixc(nx+1,ny+1);
177 end
178 end
179 end
180 end
181
182 whole(nx+1,ny+1)= whole_fixa(nx+1,ny+1)+whole_fixb(nx+1,ny+1)+whole_fixc(nx+1,ny+1);
183
184 end
185 end
186
187 figure(8);
188 subplot(1,1,1); surf(y,x,whole);
189 axis([0 CL 0 SL])
190 axis tight
191 title('Deformation of Access panel as orthotropic and isotropic plate','fontsize',13,'fontweight','b')
192 ylabel({'Length of Panel in ';'Chordwise direction [m]'},'fontsize',13,'fontweight','b')
193 xlabel({'Length of Panel in ';'Spanwise direction [m]'},'fontsize',13,'fontweight','b')
194 zlabel('Deformation profile [m]','fontsize',13,'fontweight','b')
195
196 % Made by: Jesus I. Maldonado C. Diverse source citations for equations
197 % can be found among on code.
198 % March of 2011, ETHZ.
44
61. Bibliography
[1] Michel Brethouwer. Wing bending deformation lower boom. Technical report, Fokker
Aerostructures B.V., 2010.
[2] Michel Brethouwer. Fokker proposal fem access panel. Fokker Aerostructures B.V. -
COALESCE2 Project, 2011.
[3] Oliver Häfner. Coalesce2 fem guideline. Technical report, COALESCE Consortium, 2010.
[4] Ferdinand P. Beer; R. Johnston. Mechanics of Materials. McGraw-Hill, 1992.
[5] G. Kress. Structural Optimization. IMES-ST-ETH Zürich, 2007.
[6] G. Kress. Strukturanalyse mit FEM. Zentrum für Strukturtechnologien-ETH Zürich,
2009.
[7] Andreas Lang. Rib to spar connection concepts in a wing leading edge. Master's thesis,
ETH Zürich, 2010.
[8] E. Mazza. Methoden der Strukturanalyse. IMES-ETH Zürich, 2010.
[9] MSC Software. Patran 2008r1 Reference Manual Part 3: Finite Element Modeling, 2008.
[10] Michael Chung-Yung Niu. Airframe structural design: practical design information and
data on aircraft structures. Hong Kong : Conmilit Press, 2006.
[11] A.R. Cusens; R.P. Pama. Bridge Deck Analysis. Wiley-Interscience, 1975.
[12] Luke Pearse. Coalesce2 wp1 - baseline loading. Technical report, COALESCE Consor-
tium, 2010.
[13] Luke Pearse. Requirements document. Technical report, COALESCE Consortium, 2010.
[14] Prof. S. R. Satish Kumar Prof. A. R. Shantha Kumar. Design of steel structures 1.
Indian Institute of Technology Madras.
[15] Ross Salisbury. Metallic versus composite access panel study. Technical report, AIRBUS
UK, 2010.
[16] Benjamin Schläpfer. Strukturoptimierung computer-Übung: Kuppel, teil 1. Course
exercise, 2011.
[17] Stephen P. Timoshenko. Theory of elastic stability. McGraw-Hill, 1961.
[18] M.S. Troitsky. Stiened plates : bending, stability and vibrations. Amsterdam a.o. :
Elsevier, 1976.
50