AcademyHealth 2012 Identify Rural Hospital Quality
•Download as PPTX, PDF•
2 likes•261 views

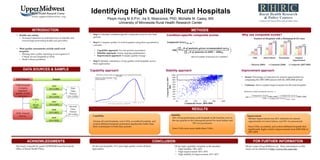
This study illustrated three methodological approaches to identify high quality rural hospitals: capability, stability, and relative improvement.

Recommended
Recommended
More Related Content
What's hot
What's hot (20)
Viewers also liked
Similar to AcademyHealth 2012 Identify Rural Hospital Quality
Similar to AcademyHealth 2012 Identify Rural Hospital Quality (20)
Recently uploaded
Recently uploaded (20)
AcademyHealth 2012 Identify Rural Hospital Quality
- 1. Peiyin Hung MS PhD student Division of Health Policy and Management School of Public Health, University of Minnesota Identifying High Quality Rural Hospitals Peiyin Hung, MS; Ira S. Moscovice, PhD, Michelle M. Casey, MS
- 2. INTRODUCTION METHODS RESULTS CONCLUSION Acknowledgements The study is funded by grant U27RH0180 from the Federal Office of Rural Health Policy. January 14, 2015 2
- 3. INTRODUCTION METHODS RESULTS CONCLUSION Agenda • Introduction • Data sources and sample • Methods • Results • Conclusion January 14, 2015 3
- 4. INTRODUCTION METHODS RESULTS CONCLUSION Introduction • Health care reform – Increased attention on potential ways to identify and reward high performing health care providers • Most quality assessments excluded small rural hospitals – Missing data (public reporting is not required of Critical Access Hospitals) – Small volume problems January 14, 2015 4INTRODUCTION
- 5. INTRODUCTION METHODS RESULTS CONCLUSION Data Sources & Sample January 14, 2015 5METHODS CMS Hospital Compare Inpatient quality of care measures AHA Annual Survey 2005 (N=1,686) 2006 (N=1,815) 2007 (N=1,883) 2008 (N=1,887) 2009 (N=1,902) First Time Period (N=1,830) Second Time Period (N=1,961) CAHs + Rural PPS *Hospitals reporting data on ANY measure with 1 or more patients are included. Data Sources Sample
- 6. INTRODUCTION METHODS RESULTS CONCLUSION Methods • Step 1: Calculate condition-specific composite scores in two time periods • Step 2: Compare quality of rural hospitals using three quantitative concepts – Capability – Stability – Improvement • Step 3: Identify consistency of top quality rural hospitals across three approaches 6January 14, 2015 METHODS
- 7. INTRODUCTION METHODS RESULTS CONCLUSION Condition-Specific Composite Score • By condition • Score: Percentage of opportunities given recommended care in a period • Example: 72/16/2012 𝑪𝒐𝒎𝒑𝒐𝒔𝒊𝒕𝒆 𝑺𝒄𝒐𝒓𝒆𝒊 𝟎𝟓−𝟎𝟔 = 𝟏𝟎𝟎 𝑵 𝒐𝒇 𝒑𝒂𝒕𝒊𝒆𝒏𝒕𝒔 𝒈𝒊𝒗𝒆𝒏 𝒓𝒆𝒄𝒐𝒎𝒎𝒆𝒏𝒅𝒆𝒅 𝒄𝒂𝒓𝒆𝒊𝒌 𝑲 𝒌=𝟏 𝑵 𝒐𝒇 𝒑𝒂𝒕𝒊𝒆𝒏𝒕𝒔 𝒊𝒏 𝟐𝟎𝟎𝟓 − 𝟐𝟎𝟎𝟔𝒊𝒌 𝑲 𝒌=𝟏 𝒘𝒉𝒆𝒓𝒆 𝑲 𝒊𝒔 𝒏𝒖𝒎𝒃𝒆𝒓 𝒐𝒇 𝒎𝒆𝒂𝒔𝒖𝒓𝒆𝒔 𝒇𝒐𝒓 𝒂 𝒄𝒐𝒏𝒅𝒊𝒕𝒊𝒐𝒏 𝒊 METHODS
- 8. INTRODUCTION METHODS RESULTS CONCLUSION Why Use Composite Scores? AMI Heart Failure Pneumonia Surgical Improvement 163 747 1167 922 613 1509 1757 1043 1079 1770 1893 1205 Number of Hospitals with a Minimum 25 Cases Measure (2009) Composite (2009) Composite (2007-2009) January 14, 2015 8METHODS
- 9. 9INTRODUCTION METHODS RESULTS CONCLUSION Methods-Capability •Score: Time-period condition-specific composite scores •Criterion: Rural hospitals in the top quartile of each condition-specific composite score in a period 9January 14, 2015 METHODS
- 10. INTRODUCTION METHODS RESULTS CONCLUSION Methods-Stability • Score: Condition-specific composite scores in both 2005-2006 and 2007-2009 period • Criterion: Composite scores in the top quartile in both periods January 14, 2015 10METHODS
- 11. INTRODUCTION METHODS RESULTS CONCLUSION 0% 10% 20% 30% 40% 50% 60% 70% 80% 90% 100% 0% 10% 20% 30% 40% 50% 60% 70% 80% 90% 100% CompositeScore2007-2009 Distribution of Heart Failure Scores 112/16/2012 Composite Score 2005-2006 METHODS
- 12. 12INTRODUCTION METHODS RESULTS CONCLUSION Methods- Relative Improvement Scores: Percentage of reduction for missed opportunities by comparing the 2007-2009 period with the 2005-2006 period. Criterion: Above median improvements for all rural hospitals 12January 14, 2015 METHODS 𝑅𝑒𝑙𝑎𝑡𝑖𝑣𝑒 𝐼𝑚𝑝𝑟𝑜𝑣𝑒𝑚𝑒𝑛𝑡 𝑆𝑐𝑜𝑟𝑒𝑖 = 100 × 𝐶𝑜𝑚𝑝𝑜𝑠𝑖𝑡𝑒 𝑆𝑐𝑜𝑟𝑒𝑖2007−2009 − 𝐶𝑜𝑚𝑝𝑜𝑠𝑖𝑡𝑒 𝑆𝑐𝑜𝑟𝑒𝑖2005−2006 100 − 𝐶𝑜𝑚𝑝𝑜𝑠𝑖𝑡𝑒 𝑆𝑐𝑜𝑟𝑒𝑖2005−2006
- 13. INTRODUCTION METHODS RESULTS CONCLUSION -80% -60% -40% -20% 0% 20% 40% 60% 80% 100% 0% 10% 20% 30% 40% 50% 60% 70% 80% 90% 100% RelativeImprovementScore Distribution of Heart Failure Scores 132/16/2012 Composite Score 2005-2006 METHODS
- 14. 14INTRODUCTION METHODS RESULTS CONCLUSION RESULTS January 14, 2015 14RESULTS
- 15. INTRODUCTION METHODS RESULTS CONCLUSION Capability Approach Among all rural hospitals, non-CAHs, accredited hospitals, and system- affiliated hospitals performed significantly better than their counterparts in both time periods. January 14, 2015 15RESULTS
- 16. INTRODUCTION METHODS RESULTS CONCLUSION Stability Approach 64% of top-performing rural hospitals in the baseline were in the top quartile in the subsequent period for heart failure and 58% for pneumonia. Non-CAHs were more stable than CAHs. January 14, 2015 16RESULTS
- 17. INTRODUCTION METHODS RESULTS CONCLUSION Relative Improvements Approach Median improvement was 42% reduction for missed opportunities for heart failure, and 50% for pneumonia. Non-CAHs, accredited, and system- affiliated hospitals had significantly higher relative improvements from 2005- 2006 to 2007-2009. January 14, 2015 17RESULTS
- 18. INTRODUCTION METHODS RESULTS CONCLUSION Conclusion • Consistency across three approaches – Of all rural hospitals, 11% were high quality across three approaches. – Of the high capability hospitals in the baseline •High stability: 58%~64% •High improvement: 45%~50% •High stability & improvement: 43%~45% January 14, 2015 18CONCLUSION
- 19. Q&A Additional information please contact: Peiyin Hung: hungx068@umn.edu 19
- 20. INTRODUCTION METHODS RESULTS CONCLUSION Measures Used • Heart Failure (4 measures) – Discharge instructions – Evaluation of left ventricular systolic function – ACE inhibitor or ARB for left ventricular systolic dysfunction – Smoking cessation advice/counseling • Pneumonia (5 measures) – Assessed and given pneumococcal vaccination – Patients whose initial emergency room blood culture was performed prior to the administration of the first hospital dose of antibiotics – Smoking cessation advice/counseling – Given initial antibiotics within 4/6 hours after arrival – Given the most appropriate initial antibiotic 202/16/2012
- 21. INTRODUCTION METHODS RESULTS CONCLUSION Measures Used • AMI (6 measures) – Heart attack patients given aspirin at arrival – Heart attack patients given aspirin at discharge – Heart attack patients given ACE inhibitor or ARB for left ventricular systolic dysfunction – Heart attack patients given smoking cessation advice/counseling – Heart attack patients given beta blocker at discharge – Heart attack patients given fibrinolytic medication within 30 mins of arrival • Surgical Improvement (2 measures) – Given an antibiotic at the right time to help prevent infection – Preventive antibiotics were stopped at the right time 212/16/2012
- 22. 22INTRODUCTION METHODS RESULTS CONCLUSION -30% -20% -10% 0% 10% 20% 30% 40% 50% 60% 70% 80% 90% 100% 80% 85% 90% 95% 100% CompositeScore2007-2009/ RelativeImprovement Composite Score 2005-2006 Heart Failure Scores & Relative Improvements Among Baseline High Capable Rural Hospitals 222/16/2012 RESULTS
- 23. 23INTRODUCTION METHODS RESULTS CONCLUSION Heart Failure Composite Scores Among High Stable Rural Hospitals 232/16/2012 80% 85% 90% 95% 100% 80% 85% 90% 95% 100% CompositeScore2007-2009 Composite Score 2005-2006 RESULTS
- 24. 24INTRODUCTION METHODS RESULTS CONCLUSION Heart Failure: Composite Scores & Relative Improvements Among High Stable Rural Hospitals 242/16/2012 -30% -20% -10% 0% 10% 20% 30% 40% 50% 60% 70% 80% 90% 100% 80% 85% 90% 95% 100% CompositeScore2007-2009/ RelativeImprovements Composite Score 2005-2006 RESULTS
Editor's Notes
- Thank you all for coming today. Today, I am going to talk about identifying high quality rural hospitals.
- This study is a project in the University of Minnesota rural health research center. The key people for this study are my supervisors, Ira Moscovice and Michelle Casey. Without them, this project is not possible. Also, this is granted by federal office of rural health policy to the flex monitoring team.
- This is the sections I will go through today.
- Nowadays, health care reform has increased the focus on potential ways to identify and reward high performing hospitals. However, many quality examinations in the previous studies excluded small rural hospitals while only providers with a minimum of 25 cases are eligible to be assessed. The critical access hospitals, on the one hand, not required to report the quality measures, on the other hand, have very small volume of visits, mostly excluded from the report or rewarding list.
- So, in this study, we merged CMS hospital compare inpatient quality of care measures with AHA annual survey for hospital characteristics. We focused on critical access hospitals and rural PPS hospitals. In order to include as many hospitals as we could, we created time-period quality scores, given 2005-2006 data in the first time period and 2007-2009 in the second.
- After calculation of condition-specific composite scores in the time periods, we compared the quality of rural hospitals in three approaches: capability is the performance in a period; stability is to see if hospitals stay on the top in the second time period; the improvement approach is to see the relative change in quality scores. I will talk in more detail in a minute. After the three-approach comparison, we identified if top quality rural hospitals is consistent across three approaches. Among three approaches Capability approach: For one-period assessment Stability approach: Assess ongoing performance Improvement approach: Evaluate quality change
- Then, you may ask what is a condition-specific composite score? We basically summed up the number of patients given recommended care for all corresponding measures of a condition and divided by the total patients for the same measures in a time period. So, the composite score is defined as a percentage of opportunities given recommended care in a period.
- The reason why we used composite scores is to increase our sample size for quality assessments. If we used traditional method of quality scores by measure, there were these amount of average hospitals with a minimum 25 cases per measure. When we used composite scores in a year, the sample size increased a lot more, about half more for heart failure and about 600 hospitals. Using time-period score would increase even more. The average hospitals with minimum 25 cases in measures of AMI, Heart Failure, Pneumonia, and Surgery are 163, 747, 1167, and 922 hospitals, respectively. In this study, in order not to penalize low volume hospitals and includes as many rural hospitals as we could, we used composite scores because this method increases number of hospitals significantly. When we added multiple years of data to include hospitals for adequate quality scores, we found that it increases even more, especially for AMI scores. In this presentation, I am going to talk about the findings for heart failure and pneumonia since AMI and surgery are not popular in rural hospitals. calculating multiple year composite scores for each condition warrants 1,079, 1770, 1893, 1205 hositals in the sample for AMI, HF, PN, and SUR quality report, respectively.
- Of the first approach-capability, we used composite scores in a period to identify rural hospitals on the top quartile among all rural hosptials for a condition. For example, in the first time period, the threshold for heart failure top quartile is 83%. In such case, hospitals with 83 or more scores are called high capable hospitals for heart failure.
- Of the second approach-stability, we used scores in both time period to see which hospitals performed on the top quartile for both periods.
- For example, we have identified high capable hospitals in the first time period-05 to 06, they are blue Xs in the yellow area. And also the blue Xs in the yellow area above the horizontal line. It is clear that high stable hospitals are the blue Xs in the darker yellow areas. But you may see among top-performing hospitals in the second time period, many hospitals were not identified as good quality in the stability approach. We are therefore interested in the quality change of the hospitals from the baseline. It drives an importance to identify continuous improving hospitals.
- For this relative improvement approach, we calculated percentage of reduction in missed opportunities for recommended care by comparing the second period with the baseline. It is like the equation shown below. We first subtracted a composite score in 2007-2009 from the score in 2005-2006 and then divided by how many opportunities they could have improved from the baseline.
- For example, we have identified high capable hospitals in the first time period-05 to 06, they are blue Xs in the yellow area. And also the blue Xs in the yellow area above the horizontal line. It is clear that high stable hospitals are the blue Xs in the darker yellow areas. But you may see the blue Xs are pretty scattered. We are therefore interested in the quality change of the hospitals from the baseline. We can see for hospitals performing on the top quartile show very scattered distribution of relative improvements. It drives an importance to identify continuous improving hospitals.
- After identifying high capable rural hospitals for heart failure and pneumonia, we found that rural PPS hospitals, and hospitals with accreditation or in a hospital system were more likely to be on the top quartile then critical access hospitals, non-accredited hospitals, and non system-affiliated hospitals, respectively. These are not surprising according to previous studies. Larger rural hospitals, hospitals with accreditation or in a system tend to have more resources to use quality techniques.
- For stability, we found that there were about 60% of top-performing rural hospitals in the 2005-2006 period also in the top quartile in 2007-2009 for the heart failure and pneumonia. When we did annual composite scores, there were only about 24% of top performing hospitals in 2005 also in the top quartile in the rest of years. And, among top-performing rural hospitals, rural PPS were more stable than CAHs.
- Of the three approaches, the capability is good for cross-sectional quality examination. the stability approach is the best for over-time evaluation to investigate ongoing performance; the relative improvement approach, measuring the change of the current performance from the baseline performance, is the best for evaluating quality improvement. Unfortunately, we did not find strong consistency across the three approaches. Besides the high stability among high capable hospitals in the baseline, high stable rural hospitals did not improve in the top over the two periods. Overall, composite scores helped us to identify quality performance among rural hospitals more fairly than measure scores. Low patient volume has limited measurement of quality performance in small rural hospitals. These approaches would allow the quality of small rural hospitals to be investigated. Yet, to our knowledge, so far, few studies discussed about performance stability over time and the relative improvements using composite scores.