SlideShare a Scribd company logo
1 of 13
Download to read offline
Acid rock drainage prediction: A critical review
Bernhard Dold
Division of Geosciences and Environmental Engineering, Luleå University of Technology (LTU), Luleå, Sweden
a b s t r a c t
a r t i c l e i n f o
Article history:
Received 2 February 2016
Revised 25 September 2016
Accepted 30 September 2016
Available online 6 October 2016
Acid rock drainage (ARD) prediction is a very important issue in order to predict and prevent environmental pol-
lution associated with mining activities. Nowadays, simple tests are widely applied and established in the mining
and consulting business for ARD prediction. These tests have many known errors and problems, as that they do
not account for the complexity of the mineral assemblage of an ore deposit, and therefore are not able to predict
the geochemical behavior accurately. This critical review has the aim of first, highlighting the geochemical pro-
cesses associated to the problems of ARD prediction. Secondly, the errors and limitations of the standard static
and kinetic tests are highlighted. The currently applied calculation factor of 31.25 for sulfide acid potential calcu-
lation overestimates the carbonate neutralization potential by 100% in its geochemical assumptions. Thus, the
calculation factor 62.5, based on the effective carbonate speciation at neutral pH, is recommended. Additionally,
standard ABA procedure ignore the acid potential of Fe(III) hydroxides and/or sulfates and do not distinguish be-
tween different carbonate minerals. This can be critical, as for example siderite can be a net acid producing car-
bonate. Therefore, it is crucial to count on accurate quantitative mineral data in order to be able to accurately
predict ARD formation and potential liberation of hazardous trace elements to the environment.
In many modern mining operations, quantitative mineral data is nowadays produced in order to enhance the re-
covery of the extraction process by the incorporation of geometallurgical information (e.g. quantitative mineral-
ogy, mineral liberation, textural information, grain size distribution). Thus, the use of this very same existing data
for ARD prediction can increase importantly the precision of ARD prediction, often without additional costs and
testing. The only requirement is the interdisciplinary collaboration between the different divisions and data ex-
change in a modern mining operation.
© 2016 Elsevier B.V. All rights reserved.
Keywords:
Acid mine drainage
Prediction
Static and kinetic test
Acid-Base Accounting (ABA)
Mining
Pollution
Sustainability
Contents
1. Introduction . . . . . . . . . . . . . . . . . . . . . . . . . . . . . . . . . . . . . . . . . . . . . . . . . . . . . . . . . . . . . . 121
2. Acid rock drainage and the importance of mineralogy. . . . . . . . . . . . . . . . . . . . . . . . . . . . . . . . . . . . . . . . . . . . 122
3. Acid rock drainage (ARD) formation . . . . . . . . . . . . . . . . . . . . . . . . . . . . . . . . . . . . . . . . . . . . . . . . . . . 123
3.1. Acid liberation . . . . . . . . . . . . . . . . . . . . . . . . . . . . . . . . . . . . . . . . . . . . . . . . . . . . . . . . . . 123
3.2. Acid neutralization . . . . . . . . . . . . . . . . . . . . . . . . . . . . . . . . . . . . . . . . . . . . . . . . . . . . . . . . 124
3.2.1. Silicates . . . . . . . . . . . . . . . . . . . . . . . . . . . . . . . . . . . . . . . . . . . . . . . . . . . . . . . . . 124
3.2.2. Hydroxides and hydroxide sulfates. . . . . . . . . . . . . . . . . . . . . . . . . . . . . . . . . . . . . . . . . . . . . 124
3.2.3. Carbonates . . . . . . . . . . . . . . . . . . . . . . . . . . . . . . . . . . . . . . . . . . . . . . . . . . . . . . . 124
4. Standard ARD prediction and its limitations . . . . . . . . . . . . . . . . . . . . . . . . . . . . . . . . . . . . . . . . . . . . . . . . 126
4.1. A historical background and mineralogical considerations . . . . . . . . . . . . . . . . . . . . . . . . . . . . . . . . . . . . . . 126
4.2. ABA calculation. . . . . . . . . . . . . . . . . . . . . . . . . . . . . . . . . . . . . . . . . . . . . . . . . . . . . . . . . . 126
4.3. Kinetic testing . . . . . . . . . . . . . . . . . . . . . . . . . . . . . . . . . . . . . . . . . . . . . . . . . . . . . . . . . . 127
5. Sample selection criteria for ARD prediction . . . . . . . . . . . . . . . . . . . . . . . . . . . . . . . . . . . . . . . . . . . . . . . . 128
6. Suggested characterization methodology for ARD prediction. . . . . . . . . . . . . . . . . . . . . . . . . . . . . . . . . . . . . . . . . 129
7. Conclusions. . . . . . . . . . . . . . . . . . . . . . . . . . . . . . . . . . . . . . . . . . . . . . . . . . . . . . . . . . . . . . . 130
Acknowledgements . . . . . . . . . . . . . . . . . . . . . . . . . . . . . . . . . . . . . . . . . . . . . . . . . . . . . . . . . . . . . 131
References. . . . . . . . . . . . . . . . . . . . . . . . . . . . . . . . . . . . . . . . . . . . . . . . . . . . . . . . . . . . . . . . . . 131
Journal of Geochemical Exploration 172 (2017) 120–132
E-mail address: Bernhard.Dold@ltu.se.
http://dx.doi.org/10.1016/j.gexplo.2016.09.014
0375-6742/© 2016 Elsevier B.V. All rights reserved.
Contents lists available at ScienceDirect
Journal of Geochemical Exploration
journal homepage: www.elsevier.com/locate/gexplo
1. Introduction
Human history is an accumulation of conflicts about geo-resources
(e.g. land, soil, water, metal, oil-gas). Therefore, mining has always
had an essential role in the development of human history since the
Neolithic Period. This has not changed today and most of the conflicts
we observe nowadays have essentially the very same origin. Mining
provides the metal supply of modern high-tech society. Although in
daily life it is not very evident for most of the world's population, mining
industry is the basis of economic wealth and technological development
(Matsumoto et al., 2016), as can be observed in the industrial revolution
in Europe (late 17th century) and the current information and energetic
revolution world-wide. Although doubtless an essential industry,
today's mining is facing severe problems for development, as the nega-
tive aspects of the mining activity are perceived to affect more and more
people in a globalized world. Thus, the mining industry is struggling to
obtain the social license in many parts of the world in order to develop
new projects (Owen and Kemp, 2013). This is mainly due to the fact that
most stakeholders, without direct benefit from the mining activity, per-
ceive mining as a threat for their health and the environment, as for ex-
ample by the formation of acid mine drainage (AMD) or more general
acid rock drainage (ARD) and subsequent water pollution (Fig. 1). As
metal extraction technologies have evolved, the amounts of mine
wastes produced have increased tremendously, a trend, which will in-
crease even more in the future. Hence, more precise ARD prediction
methods are required to tackle this problem. ARD is the result of the ox-
idation sulfide-rich rocks, exposed by natural or anthropogenic process-
es to the atmosphere, process, which leads to high element
concentrations in and acidification of the water. This process can result
in a pollution of surface and groundwater resources. In this review the
more general term ARD is used, as this applies also for any sulfide con-
taining material extracted and deposited to oxidizing conditions, like for
example in road, tunnel, or construction activities, or in natural oxida-
tion processes.
In ancient times the metal supply was ensured by oxide ore deposits
exposed on the surface of the earth crust (e.g. the gossan in the Iberian
Pyritic belt from Roman time, or the silver gossans at Cerro de Pasco,
Peru and Potosi, Bolivia pre-Inca and during the Spanish conquistador
era (Abbott and Wolfe, 2003). Since the development of the flotation
technique in the early 20th century (Bergh and Yianatos, 2011), it be-
came possible to extract and separate metal sulfides from the primary
zone of the ore deposit. This technological change, increased the dimen-
sion of mining, as now low-grade ores could be economically exploited.
As a consequence, the amount of the waste material produced increased
dramatically. Additionally, the phenomena of sulfide oxidation associat-
ed with the mining process could be first observed with the formation of
acid mine drainage in coal mining (Colmer and Hinkle, 1947), which
now is the main environmental challenge of the metal mining industry
today (Dold, 2014).
As in the last decades environmental pollution has reached levels,
which are directly critical for human health in some parts of the world
(Rockstrom et al., 2009), the environmental and sustainable aspects
have gained an important role in the last decades.
In order to get the dimension of the problem, the world production
of some base metals through the importance of each exploited ore de-
posit type is analyzed (Laznicka, 1999, 2014; Singer, 1995). Plumlee
(1999) highlighted the relationship between ore deposit type and
final ARD composition, which allows the behavioral prediction for
most deposit types with respect to ARD formation, assuming that a
good knowledge of their mineralogical composition is available.
Giant (and super-giant) metallic ore deposits supply between 60
and 95% of global metallic resources on land, with several individual de-
posits monopolizing the supply (Laznicka, 2014), from which Cu has the
highest number of super-accumulations followed by Au, Pb, Mo, Sb, and
Sn (Laznicka, 1999). This is mainly due to the geochemical behavior of
the different metals during enrichment processes in the earth crust.
Cu, Au and Mo are mainly extracted from porphyry systems (60% of
the world copper production is from porphyry Cu-Mo and Cu-Au de-
posits), and therefore the extraction of these elements is mainly done
in huge mining operations (Gerst, 2008; Mudd et al., 2013). Thus,
when considering these elements and the other ore deposit types,
which host them (Fig. 1), it can be stated that most of the giant or
super-giant deposits (except some carbonate hosted, skarn or placer de-
posits) will be very prone to produce ARD (Fig. 1).
ARD prediction is therefore an important issue due to the fact that
ARD is one the principal environmental issue facing the mining industry
nowadays (Fig. 2). Due to the increasing social pressure, governments
and state agencies increasingly implement new regulations and laws
to regulate mine waste management around the world, like for example
the new mine closure law in Chile (in place since November 2012). Con-
sequently, an accurate characterization of mine waste is required in
order to evaluate the geochemical stability and predict if ARD might
be an issue in the future that needs to be addressed and mitigated in
time.
There are mainly two types of tests applied to predict the behavior of
a rock sample concerning ARD production: The static tests, which eval-
uates if or not a sample will produce an acidic environment; and the ki-
netic tests, which evaluates, when the acidification will take place and
which elements are liberated from the sample. In order to obtain this in-
formation, there are several tests widely used in the consulting and
mining business and some are seen as standard methods.
The standard methods applied in ARD prediction are listed, ex-
plained and reviewed in several reports, books, and papers
(Bouzahzah et al., 2014; Chotpantarat, 2011; Jacobs et al., 2014;
Lottermoser, 2010; Parbhakar-Fox and Lottermoser, 2015; White and
Jeffers, 1994; White et al., 1999) and will therefore not be all listed
and addressed again in this review. It is also widely accepted that
these tests have several limitations and sources of errors
(Parbhakar-Fox and Lottermoser, 2015; White et al., 1999).
Parbhakar-Fox and Lottermoser (2015) have recently highlighted
many of these problems associated with ARD prediction in an excellent
review of ARD prediction. Here I will focus on some additional, funda-
mental errors (calculation factors) and limitations (only sulfides as pro-
ton source) of the current standard approaches. Most of these
fundamental problems and errors are known and some were highlight-
ed 25 years ago (Norecol Environmental Consultants Ltd., 1991). How-
ever, many of these errors and problems have been tolerated or
ignored through time and it has reached a point where these test
methods are established as standards in the mining and consultant
Fig. 1. Percentage of the different giant copper deposits by ore types to global copper
production (n = 221). Giant Cu-Mo and Cu-Au porphyry deposits represent about 60%
of the world copper production. The in yellowish to reddish colored ore types tend to
produce ARD, while the bluish colored skarn and carbonate hosted deposits might have
enough carbonates to neutralize the acid potential of the ore (modified after Laznicka,
2014).
121
B. Dold / Journal of Geochemical Exploration 172 (2017) 120–132
industries. They appear in guidelines and regulations, making it difficult
to argue against them and promote new, more powerful approaches.
Therefore, it is important to summarize these drawbacks once more in
a comprehensive review and promote a modern use of mineralogical
and geochemical data for ARD prediction.
In modern mining operations the importance of quantitative miner-
alogical characterization to increase the extraction efficiency by daily in-
corporation of mineralogical data for decision making in the mining
process has been recently shown (Cruz et al., 2012), and together with
the development of automated quantitative mineralogy gives nowa-
days new tools to improve the mining process (Gottlieb et al., 2000). Al-
though this data exists in many modern, advanced mining operations,
only sporadically it is also used for ARD prediction.
This review has the aim of summarizing and explaining the main
problem of standard ARD prediction and convince the reader that the
use of the often existing quantitative mineralogy used originally for
geometallurgical purpose in a mining operation, could improve impor-
tantly also the ARD prediction, often without additional costs and
testing.
2. Acid rock drainage and the importance of mineralogy
The goal of acid rock drainage prediction is very simple. It deals with
the mineralogical composition of a geological sample (Fig. 3). This sam-
ple can contain different ratios of different minerals or mineral groups
(e.g. silicates, carbonates, sulfides, sulfates, oxides). There are minerals
which can produce acidity (e.g. sulfides through oxidation or
Fe(III)hydroxides and/or sulfates through equilibrium reactions),
which means they liberate protons (H+
) into solution and elements,
which can hydrolyze to complexes (e.g. Fe, Al, Mn) in solution and by
doing so deprotonize water, resulting also in a liberation of protons
into solution; i.e. resulting in an acidification. If a solution is acidic it in-
creases the mobility of heavy metals (e.g. divalent cations Cu2+
, Zn2+
,
Cd2+
, Pb2+
among others), which can pollute water resources, rivers,
lakes, sea, or groundwater.
On the other hand, there are minerals in a rock, which can neutralize
these protons (e.g. carbonates, hydroxides, and silicates) and control
Fig. 2. Some examples of acid mine drainage. Above left: AMD pond with schwertmannite/goethite precipitating as sediment, Quiulacocha tailings impoundment, Cerro de Pasco, Peru.
Above right: Collection channel for the AMD solutions from Excelsior Waste Rock Dump, Cerro de Pasco, Peru. Below left: Solid AMD in form of efflorescent salts precipitating at Pan
de Azúcar tailings impoundments, Argentina. Below right: Schwertmannite terraces forming in the AMD effluent from Rio Tinto mine, Spain.
sulfides (SAP) sulfates carbonates (CaNP) feldspars (FNP)
metal-hydroxides (sulfates)
py
cp
gn
gy
sfs
ca
sd
fh-gt
sh
jt
an
pls
kfs
Fig. 3. Schematic mineral composition of a rock samples and the different minerals and
mineral group producing acidity or neutralizing protons. Yellow colors indicate acid
potential (AP), blue neutralization potential (NP), grey and white, none of both.
Abbreviations: py = pyrite; cp = chalcopyrite; gn = galena; fh = ferrihydrite; gt =
goethite; sh = schwertmannite; jt = jarosite; gy = gypsum; sfs = sulfo-salts; ca =
calcite; sd = siderite; an = anorthite; pls = plagioclase; kfs = K-feldspar. SAP =
sulfide acid potential; CaNP = carbonate neutralization potential; FNP = feldspar
neutralization potential.
122 B. Dold / Journal of Geochemical Exploration 172 (2017) 120–132
the pH as buffers at certain values (Langmuir, 1997; Stumm and
Morgan, 1996). If a solution is alkaline, the mobility of elements,
which are stable as oxyanions for example SO4
2−
, AsO4
3−
, MoO4
2−
,
CrO4
2−
among others, is increased (Langmuir, 1997; Stumm and
Morgan, 1996).
In order to predict if a rock (sample) will produce an acid, neutral or
alkaline environment and/or liberate and possibly mobilize certain ele-
ments, it is necessary to know as exact as possible how much of each
mineral is present in the sample (and its composition; i.e. the trace ele-
ment composition). Thus, any prediction technique has the goal to
quantify the reactive minerals in the sample. From an analytical point
of view, this is a very difficult task. There exist only two traditional ana-
lytical techniques to characterize a mineral properly (i.e. define it's crys-
talline parameters): Optical microscopy and X-ray diffraction (XRD).
Both techniques have strong limitation for quantification. In case of op-
tical microscopy, a semi-quantification can be done by point counting,
which is a very slow and labor intensive technique by highly qualified
mineralogist, thus very expensive. X-ray diffraction has a high detection
limit (2–5%), so that it is not suitable for detection of trace minerals.
There are techniques available to lower this detection limit like differen-
tial XRD (Dold, 2003a), but are difficult to apply. Trace minerals can be
most relevant for the environmental impact prediction, as clearly
shown in the case of marine pollution associated to the tailings deposi-
tion in fjords at the Black Angel mine, Greenland (Elberling et al., 2002;
Perner et al., 2010; Poling and Ellis, 1995).
The development of mineral quantification by the Rietveld method
with XRD (Epp, 2016), give today the possibility of a semi-quantifica-
tion of the mayor mineral phases in an mineral assemblage.
Do to these drawbacks for mineralogical quantifications; alternative
faster and cheaper methods were needed for mineral quantification,
specifically for ARD prediction. Subsequently, geochemical methods
based on quantification of element concentrations in the sample and as-
sumption for their mineral association in order to quantify indirectly the
mineral content, were developed (e.g. Acid-Base Accounting (ABA);
(Sobek et al., 1978), with modifications (Lawrence et al., 1989;
Skousen et al., 1997), or correlations for quantification by the reactivity
of the mineral assemblage (e.g. paste-pH, Fizz test, NAG) were drawn
(White et al., 1999).
Parallel to this development of ARD prediction methods, due to the
mentioned analytical limitations of the mineralogical techniques, a
technique was needed for geosciences in general to quantify the mineral
content of a sample in an automated and fast way, with higher accuracy
and lower detection limit. This breakthrough was reached with the de-
velopment of the SEM-EDX based automated quantitative mineralogy
technique, also known as QEMSCAN® or Mineral Liberation Analysis
(MLA) (Gottlieb et al., 2000).
In order to predict ARD for a rock sample, it is necessary to quantify
the acid liberating minerals and calculate the moles of protons poten-
tially liberated, which is called the Acid Potential (AP). On the other
hand, the amount of minerals, which can neutralize the produced pro-
tons, are quantified, the so called Neutralization Potential (NP). The dif-
ference between both indicates if the sample has enough buffer capacity
to neutralize all protons potentially produced (i.e. stays circum-neu-
tral), or it will produce more protons than it can neutralize, which
means that it will ultimately produce acidic conditions. This is called
the Acid-Base Accounting (ABA). If there is a lack of acid buffer to main-
tain the system neutral, this buffer can be added, usually in form of car-
bonates (e.g. calcite or dolomite or sometime as lime). Therefore, the
calculations are done as tCaCO3/1000 t, in order to know how much car-
bonates are needed to maintain the material neutral.
As a result traditional, widely used standard prediction methods are
applied, with many drawback and problems, and on the other hand,
high-tech analytical techniques are available at a competitive price for
the end-user. Thus, it can be predicted that it will be just a matter of
time, when this change in the approach of ARD prediction will be ac-
cepted as new standard.
3. Acid rock drainage (ARD) formation
In this section, the geochemical and mineralogical basics necessary
to understand the ARD prediction methodology are revised. For a
more comprehensive review of the geochemical processes leading to
ARD formation in mine waste, the reader is referred to the two open ac-
cess publications (Dold, 2010, 2014) or other reference therein (Jambor
and Blowes, 1994; Plumlee and Logsdon, 1999).
3.1. Acid liberation
Sulfide minerals form and are stable under reducing conditions. Dur-
ing mining these minerals can be exposed to oxidizing conditions, and
subsequent, these minerals will undergo oxidation. This is usually
highlighted in the literature with the example of pyrite oxidation, as
this mineral is the most common sulfide and the one, which produces
4 mol of protons through its oxidation process (Colmer and Hinkle,
1947; Dold, 2014; Nordstrom, 2000; Singer and Stumm, 1970). This as-
sumption is used in most ARD prediction method. Following Eq. (1), py-
rite will oxidize in the presence of atmospheric oxygen and water,
producing Fe(III)hydroxides, sulfate and 4 mol of protons per mole of
pyrite oxidized by oxygen. Other sulfide minerals will produce different
amounts of protons during oxidation under different geochemical con-
ditions (Table 1). It can also be observed that mainly sulfide minerals
containing iron produce net acidity via its oxidation, with exception of
some lesser common sulfides like molybdenite, enargite, and stibnite.
The liberated Fe2+
can oxidize automatically at pH N 4 or when cata-
lyzed by bacterial activity at pH b 4 (e.g. Acidithiobacillus spp. or
Leptospirillum spp.), a proton neutralizing process (Eq. (2)). The
Table 1
Overview of the oxidation reactions of the most relevant sulfide minerals via atmospheric
oxygen, considering the hydrolysis of ferric iron and the final amount of protons liberated.
Below, the oxidation via ferric iron is shown with the liberated amounts of protons. The
equations have to be seen as idealized and partial reactions with different end products
and amounts of protons liberated may occur in nature.
Sulfide mineral Formula Moles H+
Oxidation via oxygen + hydrolisis of Fe3+
Pyrite (FeS2) FeS2 + 3.75O2 + 3.5H2O = Fe(OH)3 + 2SO4
2−
+
4H+
4
Arsenopyrite
(FeAsS)
FeAsS + 2O2 + 3H2O = Fe(OH)3 + SO4
2−
+
HAsO4
2−
+ 3H+
3
Chalcopyrite
(CuFeS2)
CuFeS2 + 4O2 + 3H2O = Cu2+
+ Fe(OH)3 +
2SO4
2−
+ 2H+
2
Pyrrhotite
(Fe(1 − x)S)
x = 0.1: Fe(0.9)S + 2.175O2 +
2.35H2O = 0.9Fe(OH)3 + SO4
2−
+ 2H+
2
Enargite
(Cu3AsS4)
Cu3AsS4 + 8.75O2 + 2.5H2O = 3Cu2+
+
HAsO4
2−
+ 4SO4
2−
+ 4H+
4
Sphalerite
(ZnS)
ZnS + 2O2 + = Zn2+
+ SO4
2−
0
Galena (PbS) PbS + 2O2 + = Zn2+
+ SO4
2−
0
Covellite (CuS) CuS + 2O2 + = Zn2+
+ SO4
2−
0
Oxidation via ferric iron
Pyrite (FeS2) FeS2 + 14Fe3+
+ 8H2O = 15Fe2+
+ 2SO4
2−
+
16H+
16/2a
Arsenopyrite
(FeAsS)
FeAsS + 13Fe3+
+ 8H2O = 14Fe2+
+ SO4
2−
+
HAsO4
2−
+ 15H+
15/2a
Chalcopyrite
(CuFeS2)
CuFeS2 + 16Fe3+
+ 8H2O = Cu2+
+ 17Fe2+
+
2SO4
2−
+ 16H+
16/0a
Pyrrhotite
(Fe(1-x)S)
x = 0.1: Fe(0.9)S + 7.8 Fe3+
+ 4H2O = 8.7Fe2+
+
SO4
2−
+ 8H+
8/0.2a
Enargite
(Cu3AsS4)
Cu3AsS4 + 35Fe3+
+20H2O = 3Cu2+
+HAsO4
2−
+
35Fe2+
+ 4SO4
2
+ 39H+
39/4a
Sphalerite
(ZnS)
ZnS + 8Fe3+
+ 4H2O = 8Fe2+
+ SO4
2−
+ 8H+
8/0a
Galena (PbS) PbS + 8Fe3+
+ 4H2O = 8Fe2+
+ SO4
2−
+ 8H+
8/0a
Covellite (CuS) CuS + 8Fe3+
+ 4H2O = 8Fe2+
+ SO4
2−
+ 8H+
8/0a
a
Amount of protons produced, considering if the amount of ferric iron has to be pro-
duced first through oxidation in the system, which neutralizes one mole of protons per
mole of ferric iron (Eq. (2)).
123
B. Dold / Journal of Geochemical Exploration 172 (2017) 120–132
produced ferric iron can then hydrolyze and produce Fe(III) hydroxides,
process which liberates 3 mol of protons per mole of iron (Eq. (3)).
Therefore, hydrolysis is the main acid producing process, so that any lib-
erated element during weathering able to de-protonate the water mol-
ecule and hydrolyze (Ionic Potential (IP) between 4.6 and 5.6) can
produce an excess of protons in solutions (e.g. Al, Fe, Mn), i.e. lower
the pH. This is the reason that granites will produce acidic soils, al-
though they do not contain sulfides.
FeS2 þ 15=4O2 þ 7=2H2O⇒FeðOHÞ3 þ 2SO2−
4 þ 4Hþ
ð1Þ
Fe2þ
þ 1=4O2 þ Hþ
⟺Fe3þ
þ 1=2H2O ð2Þ
Fe3þ
þ 3H2O⟺FeðOHÞ3ðsÞ þ 3Hþ
ð3Þ
If pyrite is oxidized by ferric iron (Eq. (4)), 16 mol of protons are lib-
erated per mole of pyrite oxidized. In this case it is crucial to have in
mind that if the 14 mol of Fe3+
in Eq. (2) have to be produced in the sys-
tem (i.e. in the fresh mine tailings impoundment or waste rock dump),
14 mol of protons will be neutralized (Eq. (2)), so that this reaction ef-
fectively produces 2 mol of protons, as in the case with oxidation via at-
mospheric oxygen. However, if a ferric iron-rich solution enters into a
sulfide-rich system, then effectively 16 mol of protons are produced,
as for example in the case of the Quiulacocha tailings impoundment
and the Excelsior Waste-rock dump, Cerro de Pasco, Peru (Dold et al.,
2009).
FeS2 þ 14Fe3þ
þ 8H2O⇒15Fe2þ
þ 2SO2−
4 þ 16Hþ
ð4Þ
Based on these assumptions it is generally established that one mole
of pyrite produces 4 mol of protons through its oxidation and the asso-
ciated precipitation of Fe(OH)3 (Eq. (1)). This is used to calculate the AP
of a rock unit based on its sulfur content and expressed as pyrite
equivalent.
Another proton source, which is not considered by the standard ARD
prediction tests, is the group of Fe(III) hydroxides and Fe(III) hydroxide
sulfates (e.g. jarosite-alunite group, schwertmannite) together
with metal chlorides and sulfates (e.g. eriochalcite, chalcanthite,
rhomboclase), which might be the source of important amounts of acid-
ity in ARD systems. The protons might be liberated due to dissolution-
equilibrium reaction or due to mineral transformation due to meta-sta-
bility of the secondary mineralogy.
Dissolution-equilibrium.
RhomboclaseðdehydratedÞ : HFeðSO4Þ2 þ 3H2O
¼ FeðOHÞ3 þ 2SO2−
4 þ 4Hþ
ð5Þ
Transformation : jarosite⇒goethite : KFe3ðSO4Þ2ðOHÞ6⇒3FeOðOHÞ
þ Kþ
þ 2SO2−
4 þ 3Hþ
ð6Þ
Schwertmannite⇒goethite : Fe16O16ðOHÞ10ðSO4Þ3
þ 6H2O⇒16FeOðOHÞ þ 3SO2−
4 þ 6Hþ
ð7Þ
3.2. Acid neutralization
The produced protons will interact with the gangue minerals of the
rock and may undergo neutralization processes. Here, three mineral
groups are the most relevant as potential neutralization agents: carbon-
ates, hydroxides, and silicates.
3.2.1. Silicates
Among the silicates, quartz is considered as close to inert, and the
dominant silicates for neutralization are the feldspars (Feldspar Neu-
tralization Potential = FNP). Here are some important differences in
the reaction kinetics to consider. While anorthite has acceptable relative
reactivity in weathering processes, i.e. a relatively good FNP, plagioclase
(albite100–30) or orthoclase (K-feldspar) have very low relative reactivi-
ty (Table 2) and are therefore in general not considered in the evalua-
tion of the overall neutralization potential (NP) of a rock unit (See
Table 2), as equilibrium cannot reach in the contact time of the water
with the mineral. In some cases high amount of intermediately fast
weathering silicates like biotite and chlorite (~20%) for example from
potassic and propylytic alterations, might add significant NP.
3.2.2. Hydroxides and hydroxide sulfates
Different metal hydroxides can have contrasting roles in a geochem-
ical system. For example they can act as buffer by receiving protons, or
de-protonate the water molecule due to hydrolysis (Eq. (3)) or they
can liberate hydroxide ions into solution (Ca(OH)2; portlandite), lead-
ing to alkaline pH conditions. The principal hydroxide buffers in the
ARD environment or acid soils are dominated by the most abundant
metal cations with the valence 3+
; i.e. Fe3+
and Al3+
. This is due to
the ability of three valence cations to hydrolyze, given to their high
ionic potential (IP) between 4.65 (Fe3+
) and 5.61 (Al3+
), forming
solid hydroxide minerals like ferrihydrite, goethite, schwertmannite,
jarosite-alunite, and gibbsite. These minerals represent buffers, which
control the pH at ~4.3 (Al(OH)3; gibbsite), ~3.5 (Fe(OH)3; ferrihydrite,
goethite), ~2.5–3.5 (schwertmannite), ~2 (jarosite). Thus, metal hy-
droxides represent important buffers in the acid pH ranges (Fig. 4).
3.2.3. Carbonates
As in ARD prediction, the most important question is to predict if the
system maintain neutral pH or goes acid, therefore, the most important
target minerals for the NP are the Ca-Mg carbonates, as they have a fast
reactivity and tend to buffer the system a circum-neutral pH values
(Table 2; Fig. 4). Therefore, it is crucial to apply the geochemistry of
the carbonate system (Fig. 5) properly, in order to calculate and predict
the NP accurately and the final ABA.
Calcite, and magnesite (−logK 8.48, −logK 8.24) are fast dissolving
carbonates, (Table 2), while dolomite has lower solubility (−logK
17.09). Therefore, calcite is generally considered in calculations for NP
and results are expressed as its equivalent. Calcite is the key buffer to
maintain the pH at circumneutral conditions and is therefore the most
important neutralizing agent in the mining environment. As long as cal-
cite is available as a buffer in the system, its acid dissolution will liberate
bicarbonate (HCO3
−
) to the solution (Fig. 5) (Sherlock et al., 1995) and is
able to neutralize one mole of protons per mole of calcite dissolved (Eq.
(8)). This is also true in an open system in the presence of CO2(atm),
Table 2
Relative reactivity in acid-neutralization capacity of minerals (after (Sverdrup, 1990).a
Group Typical minerals
Relative
reactivity
(pH 5)
1. Dissolving Calcite, dolomite, magnesite, aragonite, brucite, 1.0
2. Fast
weathering
Anorthite, olivine, garnet, diopside, wollastonite,
jadeite, nepheline, leucite, spodumene
0.6
3.Intermediate
weathering
Enstatite, augite, hornblende, tremolite,
actinolite, biotite, chlorite, serpentine, talc,
epidote, zoisite, hedenbergite, glaucophane,
anthophyllite
0.4
4. Slow
weathering
Plagioclase (Ab100–Ab30), kaolinite, vermiculite,
montmorillonite, gibbsite
0.02
5. Very slow
weathering
K-feldspar, muscovite 0.01
6. “Inert”a
Quartz, rutile, zircon 0.004
a
“Inert” is a relative expression, as in geological element cycling no mineral is inert.
124 B. Dold / Journal of Geochemical Exploration 172 (2017) 120–132
which enhance the dissolution of carbonates (Eq. (9)). For a detailed re-
view of the carbonate system refer to (Appelo and Postma, 2010;
Stumm and Morgan, 1996).
CaCO3 þ Hþ
⟺Ca2þ
þ HCO–
3 ð8Þ
CO2ðatmÞ þ H2O þ CaCO3⇒Ca2þ
þ 2HCO−
3 ð9Þ
If the pH is below pK1 (6.3), then carbonic acid is the dominant spe-
cie in solution (Eq. (10)).
CaCO3 þ 2Hþ
⟺Ca2þ
þ H2CO0
3 ð10Þ
Therefore, the carbonate system is able to neutralize 2 mol of pro-
tons at low pH (b6.3), but it is important to consider, that at pH b 6.3
the calcite buffer is destroyed and the aqueous carbonate species in so-
lution become the only neutralization agent left in the system. There-
fore, if calcite is still available as a buffer in the system, the dominant
carbonate specie will be bicarbonate, as calcite buffers the pH around
7. This is the crucial consideration in acid base accounting calculations,
and will be highlighted below in the discussion of the calculation factor.
It is additionally important to consider the differences in carbonate
mineralogy, as they might have different reaction kinetics, solubility
and for example siderite might even produce net acidity under certain
conditions. Siderite is frequently found in porphyry copper systems
(Dold and Fontboté, 2001). Thus a mineralogical approach is also essen-
tial for the estimation of the NP.
Siderite may act as a neutralizer under certain conditions, and under
other conditions as an acid producer. The following dissolution reaction
may take place and buffer the system at pH around 5:
FeCO3 þ 2Hþ
⟺Fe2þ
þ H2CO–
3 ð11Þ
Combined with ferrous iron oxidation and ferrihydrate formation,
the overall siderite dissolution-oxidation reaction is:
4FeCO3 þ O2 þ 10H2O⟺4HCO–
3 þ 4FeðOHÞ3 þ 4Hþ
ð12Þ
This indicates that under elevated pH, where bicarbonate is stable,
the total reaction from dissolution of siderite to the formation of
ferrihydrate gives a net acid production of one mole hydrogen ion per
mol siderite dissolved. However, under more acidic conditions, where
carbonic acid is stable, there will be no net acid production. But, it has
to be considered that when ferrous iron is liberated, at low pH, it can
be mobilized even under neutral pH condition and, and under oxidizing
conditions downstream, it will oxidize and hydrolyze while liberating of
protons and producing ARD far from the source.
If ferrous iron is present in a solution containing bicarbonate, the for-
mation of siderite may occur by the following reaction:
Fe2þ
þ HCO–
3 ⟺FeCO3 þ Hþ
ð13Þ
This reaction buffers the pH at around 5–5.5 and its reaction path
may be an alternative to ferrous to ferric iron oxidation and the consec-
utive precipitation of Fe(III)oxyhydroxides. Geochemical studies by sev-
eral authors have shown that in tailings impoundments and AMD
affected aquifers the waters are frequently close to saturation or even
oversaturated with respect to siderite (Blowes et al., 1991, 1994;
Morin and Cherry, 1986), and siderite precipitation could be observed
(Dold et al., 2009).
Before entering into details of the prediction techniques, it is helpful
to highlight the ARD prediction problem with three simplified
examples.
A.) Pyrite is the most abundant sulfide mineral in the Earth's upper
crust and produces 4 mol of protons per mole of pyrite oxidized
(Eq. (1)). Calcite is the most soluble carbonate and buffers at neu-
tral pH, so that at these geochemical conditions one mole of pro-
tons can be neutralized per mole of calcite (Eq. (5)). If the molar
weight of pyrite (120 g/mol) and calcite (100 g/mol) is set as 1:1
for simplification (accepting an error of 16.7%), it can be assumed
that a rock with N20 wt.% of pyrite will always produce ARD,
even if the rest of the sample is pure calcite (20% × 4 = 80% cal-
cite needed to neutralize the protons from pyrite oxidation).
Thus there are ore deposit types, which will always produce
ARD due to their mineral composition (e.g. massive sulfide ore
bodies).
B.) Porphyry copper deposits have usually only 2 wt.% pyrite in aver-
age, but due to the fact that the exploited ore has no or very little
carbonate content (around 8 wt,% of calcite would be needed)
and the silicate assemblage has very low reactivity due to hydro-
thermal alterations (mainly K-Feldspar), the mine waste of this
deposit type is very prone to producing ARD (Dold and
Fontboté, 2001).
C.) A granite contains no sulfides and no carbonates, it is a rock only
composed of silicates and trace amounts of other mineral types;
i.e. quartz, feldspars, micas, and some accessory minerals as for
Fig. 4. Typical buffers and their pH in an ARD system (carbonates buffers and metal
hydroxides-sulfates buffers).
2 4 6 8 10 12
-8
-6
-4
-2
0
Log
Conc.
pH
C O 2 −
H 2 C O 3
3 3
H C O −
[C O 3 2 −]T O T = 100.00 m M
Fig. 5. Distribution of solute species in the aqueous carbonate system. Log concentration
vs. pH for 100 mM CO3
2−
. The pK1 is at 6.3 and pK2 at 10.3.
125
B. Dold / Journal of Geochemical Exploration 172 (2017) 120–132
example hornblende, apatite, sphene, among others (Takaya,
2014). However, a weathered granite will most likely form an
acidic environment (pH around 4.3–5.5) in the saprolite or soils
(Liu et al., 2016); i.e. it produces ARD. This is due to the liberation
of Al, and Fe through weathering process and the subsequent hy-
drolysis of these elements, in combination with the lack of car-
bonates and a feldspar assemblage of low relative reactivity.
4. Standard ARD prediction and its limitations
4.1. A historical background and mineralogical considerations
The so-called static testing of a rock sample for its potential to pro-
duce ARD tries, in a simplified geochemical way, to predict if a sample
has an excess of AP or enough of NP to maintain the sample neutral.
As a consequence, this has direct effects on the liberation and mobility
of associated elements as stated above. This is normally done by a sim-
plified geochemical quantification of sulfur in the bulk sample, which is
assumed to be associated to the sulfide mineralogy (expressed as pyrite
equivalent) and the carbonate mineralogy quantified by titration
(expressed as calcite equivalent).
Most of the standard methods applied in this field were developed
for other needs and were used for ARD prediction in sulfide metal min-
ing without considering the complexity of a sulfidic mineral assem-
blage. This is, for example, the case for the most known ABA test, the
so called Sobek test (Sobek et al., 1978), which was developed originally
for coal mining. Therefore, the assumption that all sulfur is associated to
pyrite was more or less correct in this geological environment. This test
was then widely applied in the last decades also for ABA calculations in
metal sulfide mining, where sulfur can be associated to many different
minerals, which produce different amounts of acidity or produce no
acidity at all (e.g. anhydrite-gypsum or sulfide, like sphalerite or galena,
see Table 1). This problem was noted by (Lawrence et al., 1989), and
several intents for improvement for the AP determination (Lawrence
et al., 1989), as well for the NP estimation were published (Lawrence
and Scheske, 1997; Paktunc, 1999). For example, a separation of the sul-
fate mineralogy from the sulfide mineralogy was attempted through the
dissolution of sulfates with HCl (Lawrence et al., 1989), which is now
better known as the “Modified Sobek test”. Both tests assuming that
only the sulfides are responsible for proton liberation. This assumption
has to be expanded, as Fe(III)oxyhydroxides and Fe(III)oxyhydroxide
sulfates like schwertmannite and jarosite, ferrihydrite and goethite,
minerals which are often present in the ore geology, tend to acidify
the solution due to equilibrium reactions (Alarcon et al., 2014; Dold,
2010), so that this mineralogy must also be included in an ABA (Dold
and Weibel, 2013). Additionally, the HCl leach may attack some acid sol-
uble sulfide or Fe(III) hydroxide sulfate minerals and has therefore a low
selectivity.
A more selective separation of sulfur associated with the oxide frac-
tion from the sulfide sulfur fraction can be done by a hot NH4-oxalate
leach (Dold and Fontboté, 2001), or by sequential extraction proto-
cols established for a specific ore mineralogy e.g. (Dold, 2003a,
2003b), data which then gives the possibility of performing a high-
resolution ABA, including the quantification of Fe(III)hydroxides
and Fe(III)hydroxide sulfates and their respective AP. The Modified
Sobek test (Lawrence and Scheske, 1997) can be seen as a two-step
extraction method, were only the sulfur content is analyzed.
As mentioned above, there can be a substantial difference if calcite or
siderite is present as carbonate. For this reason an additional correction
for siderite might be necessary (Skousen et al., 1997).
4.2. ABA calculation
In addition to all of the problems related to the mineralogical consid-
erations mentioned above, the key problem associated with standard
ABA procedures remains the assumptions leading to the calculation fac-
tors applied to the geochemical data. While it is generally accepted that
one mole of oxidized pyrite produces 4 mol of protons, there is disagree-
ment between the amounts of protons neutralized by calcite. The fol-
lowing two Eqs. (14) and (15) are usually presented as the base for
the calculation factor of 31.25 (e.g. GARD Guide (Verburg et al., 2009)
etc.) for the AP of a sample applied to the total sulfur or sulfide sulfur
concentrations of a sample.
CaCO3 þ 2Hþ
⟺Ca2þ
þ CO2 þ H2O ð14Þ
CaCO3 þ 2Hþ
⟺Ca2þ
þ H2CO3 ð15Þ
This factor results from the assumptions that one mole of calcite can
neutralize two moles of protons. As pyrite oxidation produces 4 mol of
protons per mole of oxidized pyrite, and pyrite contains two moles of
sulfur, the final assumption is that the protons produced by the oxida-
tion of one mole of sulfur is neutralized by one mole of calcite. This
leads to the following calculation:
100 mole weight calcite
ð Þ=32 mole weight sulfur
ð Þ  10 tCaCO3=1000t
ð Þ ¼ 31:25:
The factor 10 at the end is to present an applicable unit how much
carbonate has to be added to the ARD forming material in tons of
tCaCO3/1000 t (or g/kg or ‰) to buffer the system (sometimes the factor
is presented without this adjustment as 3.125 (White et al., 1999).
If it is accepted that calcite buffers the system at circum-neutral pH,
and the general goal of mine waste management is to maintain the pH
of the material neutral, then the carbonate specie present would be bi-
carbonate (at pH 7 N 85% HCO3
–
(Appelo and Postma, 2010); see Fig. 5
and Eq. (8)). Thus, Eq. (8) has to be considered for ABA calculations in-
stead of Eq. (10) (or 14 and 15), latter overestimating the NP of calcite
by about 100%. Therefore, a calculation factor of 62.5 should be applied,
as two moles of calcite are needed to neutralize the acidity from one
mole of sulfur:
2  100 mole weight calcite
ð Þ=32 mole weight sulfur
ð Þ  10 tCaCO3=1000t
ð Þ ¼ 62:5:
Therefore, the product of the sulfur concentrations multiplied with
the factor 62.5 instead of 31.25 gives the AP for ARD prediction, by in-
cluding the amount of protons possibly produced (assuming pyrite ox-
idation as the only protons source) and the amount of protons able to be
neutralized by the carbonates (assuming the presence of calcite) at neu-
tral pH. As discussed above, it has to be considered a neutral pH for the
carbonate NP, as only when the carbonate buffer is depleted the pH will
decrease. This is different, if the amount of calcite has to be calculated to
neutralize ARD. In this case, when the solution is acidic (pH b 6.3), cal-
cite can neutralize two moles of protons per mole of calcite and there-
fore the factor 31.25 is correct (i.e. for treatment). This is contrary to
ARD prediction, were it is evaluated if the system goes from neutral to
acidic conditions in the future (Prediction). In a strict sense, before
ABA can be properly calculated, the paste-pH should be performed to
evaluate the correct calculation factor based on the dominant carbonate
speciation.
The next step is the quantification of the NP in order to be able to cal-
culate the final ABA. For standard ABA only the carbonate neutralization
potential (CaNP) is considered. There are several approaches to quantify
carbonates in a sample:
The easiest and cheapest method is the macroscopic quantification
by a geologist in a hand specimen. However, this is a qualitative analisis
as the detection of calcite by eye is not easy and usually HCl 10% is used
to detect calcite in the field. This qualitative quantification follows the
same principles as applied in the Fizz-test (Bouzahzah et al., 2015b)
and can be very arbitrary, and is therefore not recommended for quan-
tification of NP. Sobek et al. (1978) boiled the sample in HCl and later
126 B. Dold / Journal of Geochemical Exploration 172 (2017) 120–132
titrate with NaOH in order to quantify the carbonate species in the sam-
ple. (Lawrence et al., 1989) expose the sample at room temperature to
HCl for 24 h and then titrate with NaOH. A modified method for NP de-
termination (NP(pH 6) method) was developed taking in account to de-
termine the “effective” NP or the calcium carbonate equivalent available
in the sample to maintain the pH above 6, as discussed above (White et
al., 1999). This method implies titration with 1 N sulfuric acid until pH 6
is reached, so that it might be the most realistic for carbonate NP
determination.
Another possibility is to quantify the organic and mineral carbon by
coulometric titration (E.g. Ströhlein® CS 702 or a LECO® CN-Analyzer).
The mineral carbon concentrations are assumed to be associated to the
carbonate minerals like calcite or dolomite and are expressed as CaCO3.
If siderite is of concern, addition of H2O2 is applied to promote Fe ox-
idation before back-titration to account for the above mentioned “sider-
ite problem” in ARD prediction (Skousen et al., 1997). The carbonate
quantification has then to be expressed in tCaCO3/1000 t, or g/kg, or
‰ in order to be able to calculate the final ABA with the AP. In general
term, a good knowledge of the carbonate mineralogy is needed for
ARD prediction.
Although there are many different ways to present the ABA results,
the most common is the sulfide net acid potential (SNAP) or net neu-
tralization potential (NNP)
NNP ¼ NP−AP:
In the latter case, if the result is negative, this means that the mate-
rial will form ARD, as there is an excess of AP (sulfides = pyrite) in re-
lation to the carbonate content. If the result is positive, there is
enough NP (carbonates = calcite) to maintain the material neutral. In
some guidelines the range between −20 and +20 is called the “uncer-
tain zone”. However, with good knowledge of the mineralogy, this is not
an area of uncertainty. For example, if a material has 1 wt.% pyrite
(0.53 wt.% S) and no NP, the ABA will be −16,7 (calculated with the fac-
tor 31.25), but −33.4 with the factor 62.5, and this material will clearly
produce ARD. A granite without any sulfides and in absence of carbon-
ates will produce ARD although the NNP will be 0. Material from the ox-
idation zone of an ore deposit or tailings impoundment has an NNP of
zero as there are no sulfides and carbonates left due to sulfide oxidation.
However, this zone has a pH ranges between 2 and 4 due to the pres-
ence of Fe(III)hydroxides sulfates (Dold and Fontboté, 2001).
In some cases the regulations apply a criterion for the ABA calcula-
tions ranging from 1:1.2 to 1:3 (Nevada, California and Montana,
respectively)(White et al., 1999), in order to ensure enough buffer ca-
pacity. However, if the standard calculation factor of 31.25 was applied,
a criterion of 1:2 would represent simply the correct factor of 62.5 and
no additional safety would be available. Only if a factor of 1:3 was ap-
plied, there would be some excess of buffer capacity for additional
safety.
4.3. Kinetic testing
Above, the static tests were discussed in order to predict if a sample
has the potential to acidify the geochemical system or if it will maintain
neutral or even go alkaline. Kinetic testing is used to investigate in
which time frame this will occur.
The standard tests (e.g. humidity cells; ASTM D5744-96) use col-
umns or cells, were the samples are exposed to oxidation, and is flushed
with deonized water after a certain time frame and the solution is ana-
lyzed for the solutes, representing the reaction products of the oxidation
process. In the mostly applied ASTM D5744-96 humidity cell test, a one
kilo sample with a grain size of b6.3 mm is exposed to 3 days humid air,
3 days dry air and the seventh day the system is flushed with water
which is then analyzed for physical-chemical parameters and element
concentrations. These cycles are recommended to be repeated 20–25
times to report the evolution of pH, Eh and dissolved elements like sul-
fate and Fe, Cu, Zn, Cd, Pb, As, Cr, among others.
Although widely applied in the mining and consulting business for
ARD prediction, these kinetic tests often do not give conclusive results
as shown in a study at the Andina porphyry copper mine, Chile
(Weibel et al., 2011). In this example, although all samples were classi-
fied by ABA and mineralogical studies as ARD producing (Fig. 8), in the
applied standard humidity cell tests (ASTM D5744–96), no acidification
due to sulfide oxidation could be observed. From 78 samples only 11.5%
reached final pH between 3.5 and 4.5, because of equilibrium reactions
caused by the presence of Fe(III)hydroxides (these samples were locat-
ed from the upper part of the ore deposit, suffering partial natural oxida-
tion) and not due to sulfide oxidation during the experiment. The
observed sulfate liberation was associated to anhydrite-gypsum disso-
lution present in the primary ore mineral assemblage. 64% of the sam-
ples maintained their circum-neutral pH (N6.3) and 14% reached final
pH between 5.5 and 6.3 buffered by siderite. The evolution of the acidity
concentrations, confirmed low ARD generation, were 73% of the sam-
ples remained stable, 10.2 had scarce acidity liberation, and 16.6% had
a fast contribution associated to the samples containing Fe(III) hydrox-
ides (Weibel et al., 2011).
Some unpublished test reports from high sulfide deposit types show
a fast response of ARD formation in the recommended time frame.
However, the scarce literature published on humidity cell tests of coal
(Banerjee, 2014), carbonate containing sulfide rich tailings from Joutel
tailings (Benzaazoua et al., 2004b) and of porphyry copper ores shows
clearly that during the recommended time frame, mostly no acidifica-
tion and increased element liberation could be observed, even if the
ABA clearly suggests that the material should become acidic
(Benzaazoua et al., 2004a; Filipek et al., 1999; Weibel et al., 2011). In a
field study at the Talabre porphyry copper tailings at Chuquicamata,
Chile, it was shown that the system need 3 to 5 years to acidify from
the alkaline flotation conditions (pH 9.1) to a pH of 3.5–4 (Dold et al.,
2004; Smuda et al., 2014). This is in the order of data shown in the
GARD Guide of a cell test from an unknown ore type, where after
130 weeks the acidification and element release was observed. Thus, it
can be stated that the recommended time frame is not suitable for
many types of mineral assemblage, and a flexible set-up in time of
these tests has to be proposed in order to ensure to document the geo-
chemical behavior properly.
Several parameters control the kinetics of sulfide oxidation, like
microtextures (Parbhakar-Fox et al., 2013), textural relation-ships be-
tween the minerals (Kwong, 1993), grain size, humidity, temperature,
bacterial activity, availability of oxidants (e.g. oxygen or ferric iron)
among others. Specifically it has shown by modifications of such cell
tests, that a decrease in grain size, an increase of temperature and hu-
midity results in an increase of the oxidation rates (Dold and Weibel,
2013; Dold et al., 2011). Too high water saturation might lower the ox-
idation rates (Bouzahzah et al., 2015a).
Thus, there are different possibilities to enhance the kinetics in the
laboratory. Although the wet-dry cycle was introduced to simulate en-
hanced weathering cycles, the bacterial community oxidized most effi-
ciently in a modified cell test, under constant experimental conditions.
Best response was reached at constant 40 °C and 95% humidity during
the whole cycle and only flushing on the 14th day. The results have
shown a more rapid response in element liberation and pH drop than
with the ASTM D5744-96 approach (Dold and Weibel, 2013; Dold et
al., 2011), which was run in parallel.
Finally, in light of all the problems of the prediction the kinetics of
ARD formation, it can be argued whether or not it is necessary to use ki-
netic testing. If the mineralogy and geochemistry suggest clearly that
ARD will be an issue in the future of an ore deposit, immediate action
must be taken to prevent ARD formation and to be able to control all ef-
fluent in future. Once ARD is formed it is extremely difficult to control it,
thus prevention from the beginning of any mining activity must be the
goal.
127
B. Dold / Journal of Geochemical Exploration 172 (2017) 120–132
For example, it is easy to predict, only on the base of mineralogical
composition that a porphyry copper tailings impoundment will first
produce a sulfate plume (due to equilibrium reactions with gypsum-an-
hydrite), and later ARD (due to sulfide oxidation), both infiltrating and
polluting the groundwater (Dold, 2014). With this knowledge preven-
tion measures must be in place, before operation starts. In this regard,
it is incomprehensible that there are still many mining countries, with
new legislation for environmental protection in place, which still do
not demand a basal impermeabilization for mine waste deposits in
order to prevent infiltration of contaminated plumes into the
groundwater.
5. Sample selection criteria for ARD prediction
It is most critical for ARD prediction, to select the correct samples for
this purpose. In a mine waste environment, surficial samples from old
oxidized mine tailings or waste rock dumps do not represent the full
AP and NP, as they might have been affected by weathering processes.
Therefore, samples must be extracted from depth, e.g. by drilling, in
order to obtain samples for ARD prediction.
Also the geological and petrological classification as selection criteria
is most relevant for correct ARD prediction. As discussed above, the vast
majority of base metal production has its origin in igneous ore deposit
types. N90% of the giant metal accumulations on earth relied on water
as formation agents (Laznicka, 1999), such that hydrothermal processes
are essential for most ore forming processes. Hereby, metal rich hydro-
thermal solutions interact with the host rock units and physio-geo-
chemical changes (e.g. T, P, pH, redox) induce mineral precipitation
and alteration. These processes can completely change the original min-
eral composition of the host rock, i.e. adding elements or minerals and/
or altering minerals or transporting elements away (Fig. 6), so that
sometimes only textural signs can be used for classification of the orig-
inal rock unit (e.g. porphyric texture). For example when hydrothermal
fluids interact with andesites or diorites along an active subduction
margin, the alteration completely changes the original mineralogy and
a Cu-Mo-Au porphyry deposit may form. From the ARD perspective,
this mineralogical change is dramatic and crucial. Unaltered andesites
or diorites do not have sulfides, thus their original AP is zero. They usu-
ally also do not have any carbonates, so that their CaNP is also zero. An-
desite or diorites contain plagioclases like albite - anorthite, latter a
feldpar with good FNP, meaning that this original rock suite would be
able to neutralize some protons. However, the metals, sulfur, and acidity
that were provided to the system during hydrothermal alteration, re-
sulted in the precipitation of sulfide minerals like for example pyrite,
chalcopyrite, enargite, and arsenopyrite, all of which are potential acid
producers. These processes are also accompanied by a strong change
of the gangue mineralogy. For example, the plagioclases are altered to
muscovite (quartz-sericitic alteration) or to potassic feldspar (potassic
alteration) or kaolinite (argillic alteration), minerals with very low reac-
tivity kinetics and buffer capacity (Table 2) and therefore not helpful for
ARD neutralization. Keeping this in mind, for ARD prediction of an ore
body it is key that for sample selection procedure the hydrothermal al-
teration mineralogy classification is used, and not the original petrolog-
ical or lithological classification (e.g. diorite or andesite), as sometimes
observed.
- Thus, using the original petrological classification as sample selec-
tion criteria might also mislead geochemical modeling interpretations.
For example, it is sometimes observed, that samples for ABA analysis
are selected from petrological units like andesites or diorites, but no fur-
ther mineralogical characterization is done and only the standard ABA
data is used for prediction and setup for a geochemical model to predict
future ARD quality. This gives way to the possibility of selecting samples
outside the mineralized area (often no location of the samples in the ore
deposit is given), and to assume that the feldspar specie is anorthite,
which has acceptable neutralization properties. If equilibrium modeling
uses the FNP without considering the reaction kinetics of the different
feldspar species, unrealistic predictive geochemical modeling is the re-
sult and as a conclusion, it maybe stated that the unit will not produce
ARD.
These examples highlight that it is crucial to understand which min-
eralogy will be exposed to a specific geochemical condition in order to
predict ARD formation, or more generally, to predict mineral stability
and subsequent element liberation processes and changes in the geo-
chemical system.
Fig. 6. A) Typical suite of andesitic flows intruded by a dioritic porphyry along the South American west coast. The ABA of these rock units would be zero. B) Change in mineral composition
due to hydrothermal alteration with complete change of the ABA to negative values (excess of sulfides). Only in the external part of the ore deposit, the precipitation of calcite in the
propylitic alteration zone adds CaNP to the original rock units.
128 B. Dold / Journal of Geochemical Exploration 172 (2017) 120–132
6. Suggested characterization methodology for ARD prediction
The key information to predict ARD or any element liberation of a
geological material, is the mineralogical composition of the sample.
The mineralogy is the pool of potentially liberated and neutralization
of protons through the above presented geochemical processes, and
the subsequent liberation of elements to the environment in form of
ARD or also as neutral to alkaline solutions. Variables like climate, mi-
crobial interactions, grain size, textures, relationships between minerals
(e.g. electrochemical bridges), play also a important role in these pro-
cesses, but mainly control the kinetics of the processes leading to ARD,
not the overall acid-base balance. Therefore, the efforts should be con-
centrated in identifying the minerals present in a deposit, their quanti-
fication, their relations and whether these minerals have potentially
hazardous trace elements associated.
In most cases, a simple overview of the ore deposit type and trace el-
ement composition gives a good first estimate if it will produce ARD and
which trace elements might be critical for the environment, and actions
can be taken for ARD control or prevention (e.g. impermeabilization of
the waste deposition sites and solution control), or further investiga-
tions conducted.
The first step should always be a thorough revision of the literature
of the ore deposit. Publications in scientific journals (e.g., Mineralium
Deposita, Economic Geology, Ore Geology Reviews, Journal of Geo-
chemical Exploration, among others) usually have excellent data on
the mineralogical characterization of the ore deposits. However, only
seldom they do present quantitative mineralogical analysis data. But
as shown above, with the information of the ore deposit type and the
specific minerals present in an ore, a good first estimate of the ARD be-
havior can be given; see also Plumlee (1999).
The second step, should be a characterization to obtain quantitative
mineralogical data (can nowadays be done by automated quantitative
mineralogical analysis; e.g. QEMSCAN® or MLA).
Many modern mining operations already use automated quantita-
tive mineralogy and mineral liberation analysis for geometallurgical
purposes to increase the recovery of their extraction process (Cruz et
al., 2012). The very same data can and should be used for ARD predic-
tion (Dold and Weibel, 2013), and no additional standard ABA tests
are needed at no additional costs. As mentioned above, the standard
ABA tests have to be seen only as a very simple, rough approach to at-
tempt to quantify the ARD susceptible mineralogy through the use of
geochemical data. In order to highlight which minerals are considered
in the different methodologies and what data is given by the different
techniques, these and the subsequent differences in the NNP are
shown in Fig. 7 and Table 3.
Although a good calibration and quality control for each ore and spe-
cial care for sample preparation is necessary for accurate quantification
of the mineralogy, these relatively new techniques are able to produce
the necessary data in reasonable time frames and competitive prices
(Nowadays an analysis by Automated Quantitative Mineralogy costs
in the same range as a mineralogical interpretation of a thin section by
a qualified mineralogist). Additionally they can quantify trace mineral
amounts, not detectable with any other analytical technique (Menzies
et al., 2015). This can be specially relevant if some trace elements are as-
sociated to soluble minerals like metal sulfates or chlorides. However, in
order to be able to predict trace element behavior, a more detailed geo-
chemical characterization should be additionally performed on the min-
erals. This can be done for example by sequential extractions, where the
trace element concentrations of reactive mineral groups can be quanti-
fied (Dold, 2003b). Additionally, sequential extractions have advantage
in terms of turnaround time and prices in relation to some of the other
techniques and give data for high- resolution acid-base accounting. Al-
though, no prices for the different analysis in commercial labs can be
given here, as they change with country and demand, the standard
ABA tests are very expensive in relation of the information they deliver.
For example the modified Sobek test (Lawrence), which is essentially a
two step sequential extraction in which only sulfur is analyzed with an
additional titration for the CaNP costs usually half or even more of the
price, which costs a seven step sequential extraction with analysis of
31 elements in each leach. Thus, the geochemical information obtained
by sequential extractions is much cheaper and gives much more infor-
mation on the sample in relation to simple standard ABA procedures.
Additional advanced analytical tools for geochemical characterization
might be necessary like SEM-EDS, microprobe or Laser-ICP-MS, where
trace metal concentration of specific minerals can be detected and
quantified and therefore their liberation under specific geochemical
conditions can be predicted.
In Fig. 7 only quantitative mineralogy is able to account on the differ-
ent sulfide minerals, which produce different amounts of protons
through their oxidation. Also the AP from Fe(III)hydroxides and sulfates
can be quantified, as well the differences in NP between calcite and sid-
erite and the different feldspars can be considered. Sobek would ac-
count any sulfur as sulfide sulfur in form of pyrite and siderite as full
CaNP. It also does not account the AP from iron hydroxides and sulfates.
sulfides (SAP) sulfates carbonates (CaNP) feldspars (FNP)
metal-hydroxides (sulfates)
py
cp
gn
gy
sfs
ca
sd
fh-gt
sh
jt
an
pls
kfs
Automated Quantitative Mineralogy
e.g. QEMSCAN - MLA
Sobeck Lawrence Skousen
Fig. 7. Schematic illustration which minerals are detected and/or considered in the different techniques and calculated as acid potential or neutralization potential. Yellow colors indicate
acid potential, blue neutralization potential and grey and white none of both. Abbreviations: py = pyrite; cp = chalcopyrite; gn = galena; fh = ferrihydrite; gt = goethite; sh =
schwertmannite; jt = jarosite; gy = gypsum; sfs = sulfosalts; ca = calcite; sd = siderite; an = anorthite; pls = plagioclase; kfs = K-feldspar. SAP = sulfide acid potential; CaNP =
carbonate neutralization potential; FNP = feldspar neutralization potential.
129
B. Dold / Journal of Geochemical Exploration 172 (2017) 120–132
Lawrence improve in the sense that it does not account gypsum or an-
hydrite as sulfide sulfur, but the AP from sulfosalts and Fe(III)hydroxide
sulfates is also not considered. Lawrence does consider siderite as full
NP. Skousen accounts for the siderite problem and corrects the NP.
In Table 3 the different ABA (NNP) interpretations resulting through
the characterization of a sample by the different test methods are
highlighted: quantitative mineralogy with QEMSCAN, Sobek (Sobek et
al., 1978), Lawrence (Lawrence et al., 1989), and siderite corrected
(Skousen et al., 1997).
This hypothetical sample, typical for a porphyry copper deposit,
shows which of the minerals or mineral groups are addressed in the dif-
ferent methodologies. On the left side is the mineralogy detected by mi-
croscopy and quantified by QEMSCAN. From the detected sulfide
minerals pyrite is producing 4 mol of protons by its oxidation, chalcopy-
rite 2 mol, sphalerite and galena zero, and the sulfates gypsum-anhy-
drite also produce zero. These differences can be considered, if
quantitative mineralogy is available, while the Sobek method assumes
all sulfur containing minerals as acid producers and thereby overesti-
mates the AP strongly. With respect to carbonate neutralization poten-
tial, Sobek strongly overestimates this value, as siderite is also included.
The Lawrence method takes into account sulfates like gypsum, which do
not produce acidity, but also overestimates the sulfur AP, as it considers
sphalerite and galena as acid producers. Lawrence also overestimates
the CaNP as siderite is considered as a neutralizer. Even if Lawrence is
corrected for siderite (Skousen), it overestimates the AP, and applies
the wrong calculation factor as shown by the difference with the stan-
dard calculation coefficient of 31.25 and the suggested 62.5 (see Section
4.2).
As a result, with quantitative mineralogy it is predicted that the sam-
ple has an NNP of −28.1 tCaCO3/1000 t (‰). Calculated with the wrong,
but widely used factor (31.25) the conclusion is that it lies in the uncer-
tainty area with tendency to ARD foramtion (−11.36‰). In contrast,
Sobek and Lawrence would predict that the sample is not ARD produc-
ing. Only if corrected for siderite, the NNP is also negative (−29.48). If,
for all 3 standard tests the factor 62.5 instead of 31.25 were applied, in
all cases the NNP would be negative. The same trend can also be ob-
served in a data set of 200 samples from the Andina porphyry copper
mine in Fig. 8. This clearly shows the importance of a correct mineral
quantification and correct geochemical calculations in order to properly
predict the ARD potential.
However, it is interesting to observe that sometimes, although a
strong data set of quantitative mineralogy and geochemical data exists
in a project, responsible managers spend additional money for the stan-
dard ABA tests, which illustrates how well established these tests are in
the mining industry and state agencies, despite all the above-mentioned
drawbacks and errors.
7. Conclusions
Standard static acid rock drainage prediction methodologies are
based on simple geochemical tests with the goal to quantify potential
acid production and NP of a geological sample. Due to the simplicity of
the approach and it's basic assumptions, these tests have many prob-
lems and drawback, not able to account for the complexity of the min-
eral assemblage of an ore deposit, and therefore not able to accurately
predict ARD formation. Also, standard kinetic testing is not able to pro-
duce concordant data for ARD prediction in the proposed time frames.
On the other hand, mineral characterization and automated mineral
quantification has experienced in the last decades important develop-
ment (e.g. QEMSCAN® and MLA). These data are increasingly produced
in modern mining operation, nowadays mainly for geometallurgical
purposes to increase the recovery from the ore. It can be predicted
that this data will be available in the near future in most competitive
mining operations. Thus, it is suggested to use the very same data of
quantitative mineralogy for ARD prediction with no additional costs
and testing, instead the very limited and problematic standard ARD pre-
diction tests.
Table 3
Overview of a typical sample from a porphyry copper deposit and the results of the different standard ABA approaches in relation to the quantitative mineralogy by QEMSCAN®.
Quantitative
mineralogy
e.g. QEMSCAN
Sobek Lawrence Skousen
(siderite
corrected)
31.25 62.5 31.25 62.5 31.25 62.5 31.25 62.5
Mineralogy wt.%
S
wt.% wt.%
S
SAP
(‰CaCO3)
SAP SAP SAP SAP SAP SAP SAP
Pyrite 53.3 1 0.53 16.66 33.31 16.66 33.31 16.66 33.31 16.66 33.31
Chalcopyrite 34.87 1 0.35 5.45** 10.9*
*
10.90 21.79 10.90 21.79 10.90 21.79
Sphalerite 32.86 0.5 0.16 0 0.00 5.13 10.27 5.13 10.27 5.13 10.27
Galena 13.38 0.5 0.07 0 0.00 2.09 4.18 2.09 4.18 2.09 4.18
Gypsum–
Anhydrite
23.52 3 0.71 0 0.00 22.05 44.10 0 0 0 0
Total SAP 16.66 33.31 56.83 113.66 34.78 69.56 34.78 69.56
CaNP
(‰)*
wt.%
C
wt.% wt.%
C
(‰CaCO3) ‰
Calcite 12 0.5 0.06 5.30 5.30 5.30 5.30 5.00 5.30 5.30 5.30
Siderite 10.3 6 0.62 0 0.00 54.57 54.57 54.57 54.57 0.00 0.00
Total CaNP 5.30 5.30 59.87 59.87 59.57 59.87 5.30 5.30
ABA (NNP) –11.36 –28.01 3.04 –53.79 24.79 –9.69 –29.48 –64.26
* Calculation factor for CaNP is 88.3.
** For chalcopyrite only 2 mol of H+ is considered factor is 31.25/2 or 62.5/2.
Green: ABA calculated based on quantitative mineralogy. Orange: ABA calculated after mostly applied prediction protocols.
130 B. Dold / Journal of Geochemical Exploration 172 (2017) 120–132
However, if standard testing is applied for ARD prediction, following
improvements should be applied:
1. Based on the paste-pH of the sample, the calculation factor of the sul-
fide AP should be chosen: If the paste pH is N6.3 the factor 62.5 must
be applied (i.e. for ARD prediction). If the paste pH is b6.3, 31.25 is
the correct factor for calculation, i.e. for ARD treatment.
2. The separation of the sulfate sulfur from the sulfide sulfur is the cor-
rect way, as applied by Lawrence et al. (1989). However, the use of
HCl is not very selective, as many sulfides may suffer partial dissolu-
tion. A leach with 0.2 M NH4-oxalate, pH 3, at 80° for 2 h has shown to
completely dissolve all ferric iron oxides and hydroxides sulfate min-
erals present in sulfide ore deposits (Dold, 2003b), and is therefore
recommended as more selective leach for this approach. The use of
sequential extractions can improve importantly the resolution and
precision of the ARD prediction (Dold, 2003b; Dold and Weibel,
2013).
3. For the determination of the NP, the Modified NP(pH 6) Method
(White et al., 1999) is the most realistic. It considers the real pH con-
ditions were the neutralization processes take place for ARD predic-
tion, and considers the carbonate speciation in the system, and is
therefore recommended.
Acknowledgements
I would like to thank Simon Catchpole and Robert Pooler for their
thorough revisions, suggestions and comments, which strongly im-
proved the manuscript. The author acknowledges the constructive com-
ments of the anonymous reviewers to improve the manuscript.
References
Abbott, M.B., Wolfe, A.P., 2003. Intensive pre-Incan metallurgy recorded by lake sedi-
ments from the Bolivian Andes. Science 301, 1893–1895.
Alarcon, R., Gaviria, J., Dold, B., 2014. Liberation of adsorbed and co-precipitated arsenic
from jarosite, schwertmannite, ferrihydrite, and goethite in seawater. Minerals 4
(2), 603–620.
Appelo, C.A.J., Postma, D., 2010. Geochemistry, Groundwater and Pollution. 2nd edition.
CRC, Balkema, Leiden.
Banerjee, D., 2014. Acid drainage potential from coal mine wastes: environmental assess-
ment through static and kinetic tests. Int. J. Environ. Sci. Technol. 11, 1365–1378.
Benzaazoua, M., Bussière, B., Dagenais, A.M., Archambault, M., 2004a. Kinetic tests com-
parison and interpretation for prediction of the Joutel tailings acid generation poten-
tial. Environ. Geol. 46, 1086–1101.
Benzaazoua, M., Bussiere, B., Dagenais, A.M., Archambault, M., 2004b. Kinetic tests com-
parison and interpretation for prediction of the Joutel tailings acid generation poten-
tial. Environ. Geol. 46, 1086–1101.
Bergh, L.G., Yianatos, J.B., 2011. The long way toward multivariate predictive control of
flotation processes. J. Process Control 21, 226–234.
Blowes, D.W., Ptacek, C.J., Jambor, J.L., 1994. Secondary minerals and acid mine-water
chemistry. In: Jambor, J.L., Blowes, D.W. (Eds.), Short course handbook on environ-
mental geochemistry of sulfide mine-waste. 22. Mineralogical Association of Canada,
Nepean, pp. 367–379
Blowes, D.W., Reardon, E.J., Jambor, J.L., Cherry, J.A., 1991. The formation and potential im-
portance of cemented layers in inactive sulfide mine tailings. Geochim. Cosmochim.
Acta 55, 965–978.
Bouzahzah, H., Benzaazoua, M., Bussiere, B., Plante, B., 2014. Prediction of acid mine drain-
age: Importance of mineralogy and the test protocols for static and kinetic tests. Mine
Water Environ. 33, 54–65.
Bouzahzah, H., Benzaazoua, M., Bussière, B., Plante, B., 2015a. ASTM normalized humidity
cell kinetic test: protocol improvements for optimal sulfide tailings reactivity. Mine
Water Environ. 34, 242–257.
Bouzahzah, H., Benzaazoua, M., Plante, B., Bussiere, B., 2015b. A quantitative approach for
the estimation of the “fizz rating” parameter in the acid-base accounting tests: a new
adaptations of the Sobek test. J. Geochem. Explor. 153, 53–65.
Chotpantarat, S., 2011. A review of static tests and recent studies. Am. J. Appl. Sci. 8,
400–406.
Colmer, A.R., Hinkle, M.E., 1947. The role of microorgamisms in acid mine drainage. Sci-
ence 106, 253–256.
Cruz, J., Bustos, C., Martínez, C., Suazo, H., 2012. Daily Mineralogical Control of Andina Di-
vision Concentrator CODELCO CHILE. Geomet2012.
Dold, B., 2003a. Dissolution kinetics of schwertmannite and ferrihydrite in oxidized mine
samples and their detection by differential X-ray diffraction (DXRD). Appl. Geochem.
18, 1531–1540.
Dold, B., 2003b. Speciation of the most soluble phases in a sequential extraction proce-
dure adapted for geochemical studies of copper sulfide mine waste. J. Geochem.
Explor. 80, 55–68.
Dold, B., 2010. Basic concepts in environmental geochemistry of sulfide mine-waste man-
agement. In: Kumar, S. (Ed.), Waste Management, pp. 173–198 (http://www.
intechopen.com/books/show/title/waste-management).
Dold, B., 2014. Evolution of acid mine drainage formation in sulphidic mine tailings. Min-
erals 4 (2), 621–641.
Dold, B., Fontboté, L., 2001. Element cycling and secondary mineralogy in porphyry cop-
per tailings as a function of climate, primary mineralogy, and mineral processing.
J. Geochem. Explor. 74, 3–55.
Dold, B., Weibel, L., 2013. Biogeometallurgical pre-mining characterization of ore de-
posits: an approach to increase sustainability in the mining process. Environ. Sci.
Pollut. Res. 20, 7777–7786.
Dold, B., Vogt, M.-L., Spangenberg, J.E., Kobek, M., 2004. Hydrogeochemistry of the active
tailings impoundment Talabre, Chuquicamata, Chile. Geochim. Cosmochim. Acta 68,
A450.
Dold, B., Wade, C., Fontbote, L., 2009. Water management for acid mine drainage control
at the polymetallic Zn-Pb-(Ag-Bi-Cu) deposit of Cerro de Pasco, Peru. J. Geochem.
Explor. 100, 133–141.
Dold, B., Weibel, L., Cruz, J., 2011. New Modified Humidity Cells Test for Acid Rock Drain-
age Prediction in Porphyry Copper Deposits. EnviroMine, Santiago de Chile.
Elberling, B., Asmund, G., Kunzendorf, H., Krogstad, E.J., 2002. Geochemical trends in
metal-contaminated fiord sediments near a former lead-zinc mine in West Green-
land. Appl. Geochem. 17, 493–502.
Epp, J., 2016. X-ray diffraction (XRD) techniques for materials characterization. Materials
Characterization Using Nondestructive Evaluation (NDE) Methods, pp. 81–124.
Filipek, L.H., VanWyngarden, T.J., Papp, C.S.E., Curry, J., 1999. A multi-phase apprach to
predict acid production from porphyry copper-gold waste rock in an arid montane
environment. In: Filipek, L.H., Plumlee, G.S. (Eds.), The Environmental Geochemistry
of Ore Deposits, Part B: Case Studies and Research TopicsReviews in Economic Geol-
ogy. Society of Economic Geologists, pp. 433–444.
Gerst, M.D., 2008. Revisiting the cumulative grade-tonnage relationship for major copper
ore types. Econ. Geol. 103, 615–628.
Gottlieb, P., Wilkie, G., Sutherland, D., Ho-Tun, E., Suthers, S., Perera, K., Jenkins, B.,
Spencer, S., Butcher, A., Rayner, J., 2000. Using quantitative electron microscopy for
process mineralogy applications. JOM 52, 24–25.
Jacobs, J.A., Lehr, J.H., Testa, S.M., 2014. Acid Mine Drainage, Rock Drainage, and Acid Sul-
fate Soils: Causes, Assessment, Prediction, Prevention, and Remediation.
Jambor, J.L., Blowes, D.W., 1994. Environmental geochemistry of sulfide mine-wastes. In:
Jambor, J.L. (Ed.), Short Course Series. Mineralogical Association of Canada, Nepean,
p. 438.
Samples
Fig. 8. Left: Blue bars: Percentage of the 78 samples plotting into the generator, uncertain (−20–20) and non-generator ABA from the Andina porphyry copper deposit (Weibel et al.,
2011), obtained by the modified ABA (Lawrence et al., 1989) and calculated with 31.25. Red bars: high-resolution ABA obtained from sequential extraction data (Dold, 2003a, 2003b)
from 200 samples from Andina and calculated with 62.5 (Dold et al., 2011). Right: Quantitative mineralogy of the same 200 samples obtained by QEMSCAN®, showing clearly that
calcite are very minor traces and only siderite is available as carbonate NP, thus, all samples are clearly ARD producers.
131
B. Dold / Journal of Geochemical Exploration 172 (2017) 120–132
Kwong, Y.T.J., 1993. Prediction and Prevention of Acid Rock Drainage from a Geological
and Mineralogical Perspective. MEND, p. 47.
Langmuir, D., 1997. Aqeous Environmental Geochemistry. Prentice Hall.
Lawrence, R.W., Scheske, M., 1997. A method to calculate the neutralization potential of
mining wastes. Environ. Geol. 32, 100–104.
Lawrence, R.W., Poling, G.W., Ritcey, G.M., Marchant, P.B., 1989. Assessment of Predictive
Methods for the Determination of AMD Potential in Mine Tailings and Waste Rock,
Tailings and Effluent Management. Pergamon Press, New York, Halifax, pp. 317–331.
Laznicka, P., 1999. Quantitative relationships among giant deposits of metals. Econ. Geol.
94, 455–473.
Laznicka, P., 2014. Giant metallic deposits-a century of progress. Ore Geol. Rev. 62,
259–314.
Liu, W., Liu, C., Brantley, S.L., Xu, Z., Zhao, T., Liu, T., Yu, C., Xue, D., Zhao, Z., Cui, L., Zhang, Z.,
Fan, B., Gu, X., 2016. Deep weathering along a granite ridgeline in a subtropical cli-
mate. Chem. Geol. 427, 17–34.
Lottermoser, B.G., 2010. Mine Wastes. Characterization, Treatment and Environmental
Impacts, third edition.
Matsumoto, S., Shimada, H., Sasaoka, T., 2016. The key factor of acid mine drainage (AMD)
in the history of the contribution of mining industry to the prosperity of the United
States and South Africa: a review. Nat. Resour. 7, 445–460.
Menzies, A., Álvarez, E., Belmar, M., Belma, A., Marquardt, M., Albornoz, A., Vargas, M.,
Dold, B., 2015. Quantification of trace REE-minerals using automated mineralogy.
Chilean Geological Congress, La Serena. Chile.
Morin, A.K., Cherry, J.A., 1986. Trace amoumts of siderite near a uranium-tailings im-
poundments, Elliot Lake, Ontario, and its implications in controlling contaminant mi-
gration in a sand aquifer. Chem. Geol. 56, 117–134.
Mudd, G.M., Weng, Z., Jowitt, S.M., 2013. A detailed assessment of global Cu resource
trends and endowments. Econ. Geol. 108, 1163–1183.
Nordstrom, D.K., 2000. Advances in the hydrogeochemistry and microbiology of acid
mine waters. Int. Geol. Rev. 42, 499–515.
Norecol Environmental Consultants Ltd., 1991. New Methods for Determination of Key
Mineral Species in Acid Generation Prediction by Acid Base Accounting. MEND, p. 67.
Owen, J.R., Kemp, D., 2013. Social licence and mining: a critical perspective. Res. Policy 38,
29–35.
Paktunc, A.D., 1999. A method to calculate the neutralization potential of mining wastes;
discussion. Environ. Geol. 38, 82–84.
Parbhakar-Fox, A., Lottermoser, B.G., 2015. A critical review of acid rock drainage predic-
tion methods and practices. Miner. Eng. 82, 107–124.
Parbhakar-Fox, A., Lottermoser, B., Bradshaw, D., 2013. Evaluating waste rock mineralogy
and microtexture during kinetic testing for improved acid rock drainage prediction.
Miner. Eng. 52, 111–124.
Perner, K., Leipe, T., Dellwig, O., Kuijpers, A., Mikkelsen, N., Andersen, T.J., Harff, J., 2010.
Contamination of arctic Fjord sediments by Pb-Zn mining at Maarmorilik in central
West Greenland. Mar. Pollut. Bull. 60, 1065–1073.
Plumlee, G.S., 1999. The environmental geology of mineral deposits. In: Plumlee, G.S.,
Logsdon, M.J. (Eds.), The Environmental Geochemistry of Ore Deposits. Part A: Pro-
cesses, Techniques, and Health Issues. Reviews in Economic Geology, pp. 71–116.
Plumlee, G.S., Logsdon, M.J., 1999. The Environmental Geochemistry of Ore Deposits. Part
A: Processes, Techniques, and Health Issues. Reviews in Economic GeologySociety of
Economic Geologist.
Poling, G.W., Ellis, D.V., 1995. Importance of geochemistry: the Black Angel lead-zinc
mine, Greenland. Mar. Georesour. Geotechnol. 13, 101–118.
Rockstrom, J., Steffen, W., Noone, K., Persson, A., Chapin, F.S., Lambin, E., Lenton, T.M.,
Scheffer, M., Folke, C., Schellnhuber, H.J., Nykvist, B., de Wit, C.A., Hughes, T., van
der Leeuw, S., Rodhe, H., Sorlin, S., Snyder, P.K., Costanza, R., Svedin, U., Falkenmark,
M., Karlberg, L., Corell, R.W., Fabry, V.J., Hansen, J., Walker, B., Liverman, D.,
Richardson, K., Crutzen, P., Foley, J., 2009. Planetary boundaries: exploring the safe
operating space for humanity. Ecol. Soc. 14.
Sherlock, E.J., Lawrence, R.W., Poulin, R., 1995. On the neutralization of acid rock drainage
by carbonate and silicate minerals. Environ. Geol. 25, 43–54.
Singer, D.A., 1995. World-cass base and precious-metal deposits - a qantitative-analysis.
Econ. Geol. Bull. Soc. Econ. Geol. 90, 88–104.
Singer, P.C., Stumm, W., 1970. Acid mine drainage: the rate-determining step. Science
167, 1121–1123.
Skousen, J., Renton, J., Brown, H., Evans, P., Leavitt, B., Brady, K., Cohen, L., Ziemkiewicz, P.,
1997. Neutralization potential of overburden samples containing siderite. J. Environ.
Qual. 26, 673–681.
Smuda, J., Dold, B., Spangenberg, J.E., Friese, K., Kobek, M.R., Bustos, C.A., Pfeifer, H.-R.,
2014. Element cycling during the transition from alkaline to acidic environment in
an active porphyry copper tailings impoundment, Chuquicamata, Chile. J. Geochem.
Explor. 140, 23–40.
Sobek, A.A., Schuller, W.A., Freeman, J.R., Smith, R.M., 1978. Field and laboratory methods
applicable to overburden and mine soils. EPA 600/2-78-054, p. 203.
Stumm, W., Morgan, J.J., 1996. Aquatic Chemistry. 3rd ed. Wiley, New York.
Sverdrup, H.U., 1990. The Kinetics of Base Cation Release Due to Chemical Weathering.
Lund University Press, Lund.
Takaya, Y., 2014. Which constituent mineral is dominant in granite weathering? A solu-
tion-sided approach through a laboratory experiment. Geoderma 230-231, 204–211.
Verburg, R., Bezuidenhout, N., Chatwin, T., Ferguson, K., 2009. The global acid rock drain-
age guide (GARD guide). Mine Water Environ. 28, 305–310.
Weibel, L., Dold, B., Cruz, J., 2011. Application and limitation of standard humidity cell
tests at the Andina porphyry copper mine. SGA Biennal Meeting, Antofagasta, Chile.
CODELCO, Chile.
White III, W.W., Jeffers, T.H., 1994. In: Alpers, C.N., Blowes, D.W. (Eds.), Chemical predic-
tive modeling of acid mine drainage from metallic sulfide-bearing waste rock. Envi-
ronmental Geochemistry of Sulfide Oxidation, Washington, pp. 608–630.
White III, W.W., Lapakko, K.A., Cox, R.L., 1999. Static-test methods most commonly used
to predict acid mine drainage: practical guidelines for use and interpretation. In:
Plumlee, G.S., Logsdon, M.J. (Eds.), The Environmental Geochemistry of Ore Deposits.
Part A: Processes, Techniques, and Health Issues. Reviews in Economic Geology,
pp. 325–338.
132 B. Dold / Journal of Geochemical Exploration 172 (2017) 120–132

More Related Content

Similar to Review amd 2017

Barnett et al. 2017 ESR
Barnett et al. 2017 ESRBarnett et al. 2017 ESR
Barnett et al. 2017 ESRTom Newton
 
MMSE Journal Vol.2 2016
MMSE Journal Vol.2 2016MMSE Journal Vol.2 2016
MMSE Journal Vol.2 2016MMSE Journal
 
EVALUATIONS OF RADIONUCLIDES OF URANIUM, THORIUM, AND RADIUM ASSOCIATED WITH ...
EVALUATIONS OF RADIONUCLIDES OF URANIUM, THORIUM, AND RADIUM ASSOCIATED WITH ...EVALUATIONS OF RADIONUCLIDES OF URANIUM, THORIUM, AND RADIUM ASSOCIATED WITH ...
EVALUATIONS OF RADIONUCLIDES OF URANIUM, THORIUM, AND RADIUM ASSOCIATED WITH ...Omar Alonso Suarez Oquendo
 
Progress in Indium (III) Sulfide (In2S3) Buffer Layer Deposition Techniques f...
Progress in Indium (III) Sulfide (In2S3) Buffer Layer Deposition Techniques f...Progress in Indium (III) Sulfide (In2S3) Buffer Layer Deposition Techniques f...
Progress in Indium (III) Sulfide (In2S3) Buffer Layer Deposition Techniques f...Arkansas State University
 
Formate Matters Newsletter -Issue 10 - March 2016
Formate Matters Newsletter -Issue 10 -  March 2016 Formate Matters Newsletter -Issue 10 -  March 2016
Formate Matters Newsletter -Issue 10 - March 2016 John Downs
 
Formate matters-issue-10
Formate matters-issue-10Formate matters-issue-10
Formate matters-issue-10John Downs
 
An investigation into the Morphology and Sedimentology of Dungeness Gravel Ba...
An investigation into the Morphology and Sedimentology of Dungeness Gravel Ba...An investigation into the Morphology and Sedimentology of Dungeness Gravel Ba...
An investigation into the Morphology and Sedimentology of Dungeness Gravel Ba...Tony Gregory
 
Study hydraulic fracturing study inglewood field10102012
Study hydraulic fracturing study inglewood field10102012Study hydraulic fracturing study inglewood field10102012
Study hydraulic fracturing study inglewood field10102012cr7madrid
 
(Aapg methods in exploration volume 3) george b. asquith, charles r. gibson ...
(Aapg methods in exploration volume 3) george b. asquith, charles r. gibson  ...(Aapg methods in exploration volume 3) george b. asquith, charles r. gibson  ...
(Aapg methods in exploration volume 3) george b. asquith, charles r. gibson ...luis sanchez gamero
 
Petroleum Exploration Overview
Petroleum Exploration OverviewPetroleum Exploration Overview
Petroleum Exploration OverviewAndi Anriansyah
 
Saudi Aramco Carbon Management - May 2013
Saudi Aramco Carbon Management - May 2013Saudi Aramco Carbon Management - May 2013
Saudi Aramco Carbon Management - May 2013Global CCS Institute
 
1997 epa health_effects_of_mercury_v5___great_resource
1997 epa health_effects_of_mercury_v5___great_resource1997 epa health_effects_of_mercury_v5___great_resource
1997 epa health_effects_of_mercury_v5___great_resourceDo No Harm, llc
 

Similar to Review amd 2017 (20)

Thesis EE
Thesis EEThesis EE
Thesis EE
 
Dissertation
DissertationDissertation
Dissertation
 
Barnett et al. 2017 ESR
Barnett et al. 2017 ESRBarnett et al. 2017 ESR
Barnett et al. 2017 ESR
 
ThesisJoshua
ThesisJoshuaThesisJoshua
ThesisJoshua
 
MMSE Journal Vol.2 2016
MMSE Journal Vol.2 2016MMSE Journal Vol.2 2016
MMSE Journal Vol.2 2016
 
Final Project Report
Final Project ReportFinal Project Report
Final Project Report
 
EVALUATIONS OF RADIONUCLIDES OF URANIUM, THORIUM, AND RADIUM ASSOCIATED WITH ...
EVALUATIONS OF RADIONUCLIDES OF URANIUM, THORIUM, AND RADIUM ASSOCIATED WITH ...EVALUATIONS OF RADIONUCLIDES OF URANIUM, THORIUM, AND RADIUM ASSOCIATED WITH ...
EVALUATIONS OF RADIONUCLIDES OF URANIUM, THORIUM, AND RADIUM ASSOCIATED WITH ...
 
Progress in Indium (III) Sulfide (In2S3) Buffer Layer Deposition Techniques f...
Progress in Indium (III) Sulfide (In2S3) Buffer Layer Deposition Techniques f...Progress in Indium (III) Sulfide (In2S3) Buffer Layer Deposition Techniques f...
Progress in Indium (III) Sulfide (In2S3) Buffer Layer Deposition Techniques f...
 
Formate Matters Newsletter -Issue 10 - March 2016
Formate Matters Newsletter -Issue 10 -  March 2016 Formate Matters Newsletter -Issue 10 -  March 2016
Formate Matters Newsletter -Issue 10 - March 2016
 
Formate matters-issue-10
Formate matters-issue-10Formate matters-issue-10
Formate matters-issue-10
 
An investigation into the Morphology and Sedimentology of Dungeness Gravel Ba...
An investigation into the Morphology and Sedimentology of Dungeness Gravel Ba...An investigation into the Morphology and Sedimentology of Dungeness Gravel Ba...
An investigation into the Morphology and Sedimentology of Dungeness Gravel Ba...
 
Report on Indus Delta
Report on Indus Delta Report on Indus Delta
Report on Indus Delta
 
Study hydraulic fracturing study inglewood field10102012
Study hydraulic fracturing study inglewood field10102012Study hydraulic fracturing study inglewood field10102012
Study hydraulic fracturing study inglewood field10102012
 
fjgervai2004
fjgervai2004fjgervai2004
fjgervai2004
 
(Aapg methods in exploration volume 3) george b. asquith, charles r. gibson ...
(Aapg methods in exploration volume 3) george b. asquith, charles r. gibson  ...(Aapg methods in exploration volume 3) george b. asquith, charles r. gibson  ...
(Aapg methods in exploration volume 3) george b. asquith, charles r. gibson ...
 
Thesis_Final
Thesis_FinalThesis_Final
Thesis_Final
 
Petroleum Exploration Overview
Petroleum Exploration OverviewPetroleum Exploration Overview
Petroleum Exploration Overview
 
Hydrate formation in gas pipelines
Hydrate formation in gas pipelinesHydrate formation in gas pipelines
Hydrate formation in gas pipelines
 
Saudi Aramco Carbon Management - May 2013
Saudi Aramco Carbon Management - May 2013Saudi Aramco Carbon Management - May 2013
Saudi Aramco Carbon Management - May 2013
 
1997 epa health_effects_of_mercury_v5___great_resource
1997 epa health_effects_of_mercury_v5___great_resource1997 epa health_effects_of_mercury_v5___great_resource
1997 epa health_effects_of_mercury_v5___great_resource
 

Recently uploaded

VIP Call Girls Service Bandlaguda Hyderabad Call +91-8250192130
VIP Call Girls Service Bandlaguda Hyderabad Call +91-8250192130VIP Call Girls Service Bandlaguda Hyderabad Call +91-8250192130
VIP Call Girls Service Bandlaguda Hyderabad Call +91-8250192130Suhani Kapoor
 
VIP Call Girls Saharanpur Aaradhya 8250192130 Independent Escort Service Saha...
VIP Call Girls Saharanpur Aaradhya 8250192130 Independent Escort Service Saha...VIP Call Girls Saharanpur Aaradhya 8250192130 Independent Escort Service Saha...
VIP Call Girls Saharanpur Aaradhya 8250192130 Independent Escort Service Saha...Suhani Kapoor
 
Call Girls Mumbai Gayatri 8617697112 Independent Escort Service Mumbai
Call Girls Mumbai Gayatri 8617697112 Independent Escort Service MumbaiCall Girls Mumbai Gayatri 8617697112 Independent Escort Service Mumbai
Call Girls Mumbai Gayatri 8617697112 Independent Escort Service MumbaiCall girls in Ahmedabad High profile
 
Russian Call Girls Nashik Anjali 7001305949 Independent Escort Service Nashik
Russian Call Girls Nashik Anjali 7001305949 Independent Escort Service NashikRussian Call Girls Nashik Anjali 7001305949 Independent Escort Service Nashik
Russian Call Girls Nashik Anjali 7001305949 Independent Escort Service Nashikranjana rawat
 
webinaire-green-mirror-episode-2-Smart contracts and virtual purchase agreeme...
webinaire-green-mirror-episode-2-Smart contracts and virtual purchase agreeme...webinaire-green-mirror-episode-2-Smart contracts and virtual purchase agreeme...
webinaire-green-mirror-episode-2-Smart contracts and virtual purchase agreeme...Cluster TWEED
 
Low Rate Call Girls Nashik Lavanya 7001305949 Independent Escort Service Nashik
Low Rate Call Girls Nashik Lavanya 7001305949 Independent Escort Service NashikLow Rate Call Girls Nashik Lavanya 7001305949 Independent Escort Service Nashik
Low Rate Call Girls Nashik Lavanya 7001305949 Independent Escort Service NashikCall Girls in Nagpur High Profile
 
VIP Call Girls Service Chaitanyapuri Hyderabad Call +91-8250192130
VIP Call Girls Service Chaitanyapuri Hyderabad Call +91-8250192130VIP Call Girls Service Chaitanyapuri Hyderabad Call +91-8250192130
VIP Call Girls Service Chaitanyapuri Hyderabad Call +91-8250192130Suhani Kapoor
 
VIP Call Girl Gorakhpur Aashi 8250192130 Independent Escort Service Gorakhpur
VIP Call Girl Gorakhpur Aashi 8250192130 Independent Escort Service GorakhpurVIP Call Girl Gorakhpur Aashi 8250192130 Independent Escort Service Gorakhpur
VIP Call Girl Gorakhpur Aashi 8250192130 Independent Escort Service GorakhpurSuhani Kapoor
 
(AISHA) Wagholi Call Girls Just Call 7001035870 [ Cash on Delivery ] Pune Esc...
(AISHA) Wagholi Call Girls Just Call 7001035870 [ Cash on Delivery ] Pune Esc...(AISHA) Wagholi Call Girls Just Call 7001035870 [ Cash on Delivery ] Pune Esc...
(AISHA) Wagholi Call Girls Just Call 7001035870 [ Cash on Delivery ] Pune Esc...ranjana rawat
 
(RIYA) Kalyani Nagar Call Girls Just Call 7001035870 [ Cash on Delivery ] Pun...
(RIYA) Kalyani Nagar Call Girls Just Call 7001035870 [ Cash on Delivery ] Pun...(RIYA) Kalyani Nagar Call Girls Just Call 7001035870 [ Cash on Delivery ] Pun...
(RIYA) Kalyani Nagar Call Girls Just Call 7001035870 [ Cash on Delivery ] Pun...ranjana rawat
 
(ANAYA) Call Girls Hadapsar ( 7001035870 ) HI-Fi Pune Escorts Service
(ANAYA) Call Girls Hadapsar ( 7001035870 ) HI-Fi Pune Escorts Service(ANAYA) Call Girls Hadapsar ( 7001035870 ) HI-Fi Pune Escorts Service
(ANAYA) Call Girls Hadapsar ( 7001035870 ) HI-Fi Pune Escorts Serviceranjana rawat
 
Spiders by Slidesgo - an introduction to arachnids
Spiders by Slidesgo - an introduction to arachnidsSpiders by Slidesgo - an introduction to arachnids
Spiders by Slidesgo - an introduction to arachnidsprasan26
 
NO1 Famous Kala Jadu specialist Expert in Pakistan kala ilam specialist Exper...
NO1 Famous Kala Jadu specialist Expert in Pakistan kala ilam specialist Exper...NO1 Famous Kala Jadu specialist Expert in Pakistan kala ilam specialist Exper...
NO1 Famous Kala Jadu specialist Expert in Pakistan kala ilam specialist Exper...Amil baba
 
Call Girls In Faridabad(Ballabgarh) Book ☎ 8168257667, @4999
Call Girls In Faridabad(Ballabgarh) Book ☎ 8168257667, @4999Call Girls In Faridabad(Ballabgarh) Book ☎ 8168257667, @4999
Call Girls In Faridabad(Ballabgarh) Book ☎ 8168257667, @4999Tina Ji
 
Horizon Net Zero Dawn – keynote slides by Ben Abraham
Horizon Net Zero Dawn – keynote slides by Ben AbrahamHorizon Net Zero Dawn – keynote slides by Ben Abraham
Horizon Net Zero Dawn – keynote slides by Ben Abrahamssuserbb03ff
 

Recently uploaded (20)

Call Girls In { Delhi } South Extension Whatsup 9873940964 Enjoy Unlimited Pl...
Call Girls In { Delhi } South Extension Whatsup 9873940964 Enjoy Unlimited Pl...Call Girls In { Delhi } South Extension Whatsup 9873940964 Enjoy Unlimited Pl...
Call Girls In { Delhi } South Extension Whatsup 9873940964 Enjoy Unlimited Pl...
 
VIP Call Girls Service Bandlaguda Hyderabad Call +91-8250192130
VIP Call Girls Service Bandlaguda Hyderabad Call +91-8250192130VIP Call Girls Service Bandlaguda Hyderabad Call +91-8250192130
VIP Call Girls Service Bandlaguda Hyderabad Call +91-8250192130
 
VIP Call Girls Saharanpur Aaradhya 8250192130 Independent Escort Service Saha...
VIP Call Girls Saharanpur Aaradhya 8250192130 Independent Escort Service Saha...VIP Call Girls Saharanpur Aaradhya 8250192130 Independent Escort Service Saha...
VIP Call Girls Saharanpur Aaradhya 8250192130 Independent Escort Service Saha...
 
Gandhi Nagar (Delhi) 9953330565 Escorts, Call Girls Services
Gandhi Nagar (Delhi) 9953330565 Escorts, Call Girls ServicesGandhi Nagar (Delhi) 9953330565 Escorts, Call Girls Services
Gandhi Nagar (Delhi) 9953330565 Escorts, Call Girls Services
 
Call Girls Mumbai Gayatri 8617697112 Independent Escort Service Mumbai
Call Girls Mumbai Gayatri 8617697112 Independent Escort Service MumbaiCall Girls Mumbai Gayatri 8617697112 Independent Escort Service Mumbai
Call Girls Mumbai Gayatri 8617697112 Independent Escort Service Mumbai
 
Russian Call Girls Nashik Anjali 7001305949 Independent Escort Service Nashik
Russian Call Girls Nashik Anjali 7001305949 Independent Escort Service NashikRussian Call Girls Nashik Anjali 7001305949 Independent Escort Service Nashik
Russian Call Girls Nashik Anjali 7001305949 Independent Escort Service Nashik
 
Escort Service Call Girls In Shakti Nagar, 99530°56974 Delhi NCR
Escort Service Call Girls In Shakti Nagar, 99530°56974 Delhi NCREscort Service Call Girls In Shakti Nagar, 99530°56974 Delhi NCR
Escort Service Call Girls In Shakti Nagar, 99530°56974 Delhi NCR
 
Call Girls In Delhi 9953056974 (Low Price) Escort Service Pushp Vihar
Call Girls In Delhi 9953056974 (Low Price) Escort Service Pushp ViharCall Girls In Delhi 9953056974 (Low Price) Escort Service Pushp Vihar
Call Girls In Delhi 9953056974 (Low Price) Escort Service Pushp Vihar
 
FULL ENJOY Call Girls In kashmiri gate (Delhi) Call Us 9953056974
FULL ENJOY Call Girls In  kashmiri gate (Delhi) Call Us 9953056974FULL ENJOY Call Girls In  kashmiri gate (Delhi) Call Us 9953056974
FULL ENJOY Call Girls In kashmiri gate (Delhi) Call Us 9953056974
 
webinaire-green-mirror-episode-2-Smart contracts and virtual purchase agreeme...
webinaire-green-mirror-episode-2-Smart contracts and virtual purchase agreeme...webinaire-green-mirror-episode-2-Smart contracts and virtual purchase agreeme...
webinaire-green-mirror-episode-2-Smart contracts and virtual purchase agreeme...
 
Low Rate Call Girls Nashik Lavanya 7001305949 Independent Escort Service Nashik
Low Rate Call Girls Nashik Lavanya 7001305949 Independent Escort Service NashikLow Rate Call Girls Nashik Lavanya 7001305949 Independent Escort Service Nashik
Low Rate Call Girls Nashik Lavanya 7001305949 Independent Escort Service Nashik
 
VIP Call Girls Service Chaitanyapuri Hyderabad Call +91-8250192130
VIP Call Girls Service Chaitanyapuri Hyderabad Call +91-8250192130VIP Call Girls Service Chaitanyapuri Hyderabad Call +91-8250192130
VIP Call Girls Service Chaitanyapuri Hyderabad Call +91-8250192130
 
VIP Call Girl Gorakhpur Aashi 8250192130 Independent Escort Service Gorakhpur
VIP Call Girl Gorakhpur Aashi 8250192130 Independent Escort Service GorakhpurVIP Call Girl Gorakhpur Aashi 8250192130 Independent Escort Service Gorakhpur
VIP Call Girl Gorakhpur Aashi 8250192130 Independent Escort Service Gorakhpur
 
(AISHA) Wagholi Call Girls Just Call 7001035870 [ Cash on Delivery ] Pune Esc...
(AISHA) Wagholi Call Girls Just Call 7001035870 [ Cash on Delivery ] Pune Esc...(AISHA) Wagholi Call Girls Just Call 7001035870 [ Cash on Delivery ] Pune Esc...
(AISHA) Wagholi Call Girls Just Call 7001035870 [ Cash on Delivery ] Pune Esc...
 
(RIYA) Kalyani Nagar Call Girls Just Call 7001035870 [ Cash on Delivery ] Pun...
(RIYA) Kalyani Nagar Call Girls Just Call 7001035870 [ Cash on Delivery ] Pun...(RIYA) Kalyani Nagar Call Girls Just Call 7001035870 [ Cash on Delivery ] Pun...
(RIYA) Kalyani Nagar Call Girls Just Call 7001035870 [ Cash on Delivery ] Pun...
 
(ANAYA) Call Girls Hadapsar ( 7001035870 ) HI-Fi Pune Escorts Service
(ANAYA) Call Girls Hadapsar ( 7001035870 ) HI-Fi Pune Escorts Service(ANAYA) Call Girls Hadapsar ( 7001035870 ) HI-Fi Pune Escorts Service
(ANAYA) Call Girls Hadapsar ( 7001035870 ) HI-Fi Pune Escorts Service
 
Spiders by Slidesgo - an introduction to arachnids
Spiders by Slidesgo - an introduction to arachnidsSpiders by Slidesgo - an introduction to arachnids
Spiders by Slidesgo - an introduction to arachnids
 
NO1 Famous Kala Jadu specialist Expert in Pakistan kala ilam specialist Exper...
NO1 Famous Kala Jadu specialist Expert in Pakistan kala ilam specialist Exper...NO1 Famous Kala Jadu specialist Expert in Pakistan kala ilam specialist Exper...
NO1 Famous Kala Jadu specialist Expert in Pakistan kala ilam specialist Exper...
 
Call Girls In Faridabad(Ballabgarh) Book ☎ 8168257667, @4999
Call Girls In Faridabad(Ballabgarh) Book ☎ 8168257667, @4999Call Girls In Faridabad(Ballabgarh) Book ☎ 8168257667, @4999
Call Girls In Faridabad(Ballabgarh) Book ☎ 8168257667, @4999
 
Horizon Net Zero Dawn – keynote slides by Ben Abraham
Horizon Net Zero Dawn – keynote slides by Ben AbrahamHorizon Net Zero Dawn – keynote slides by Ben Abraham
Horizon Net Zero Dawn – keynote slides by Ben Abraham
 

Review amd 2017

  • 1. Acid rock drainage prediction: A critical review Bernhard Dold Division of Geosciences and Environmental Engineering, Luleå University of Technology (LTU), Luleå, Sweden a b s t r a c t a r t i c l e i n f o Article history: Received 2 February 2016 Revised 25 September 2016 Accepted 30 September 2016 Available online 6 October 2016 Acid rock drainage (ARD) prediction is a very important issue in order to predict and prevent environmental pol- lution associated with mining activities. Nowadays, simple tests are widely applied and established in the mining and consulting business for ARD prediction. These tests have many known errors and problems, as that they do not account for the complexity of the mineral assemblage of an ore deposit, and therefore are not able to predict the geochemical behavior accurately. This critical review has the aim of first, highlighting the geochemical pro- cesses associated to the problems of ARD prediction. Secondly, the errors and limitations of the standard static and kinetic tests are highlighted. The currently applied calculation factor of 31.25 for sulfide acid potential calcu- lation overestimates the carbonate neutralization potential by 100% in its geochemical assumptions. Thus, the calculation factor 62.5, based on the effective carbonate speciation at neutral pH, is recommended. Additionally, standard ABA procedure ignore the acid potential of Fe(III) hydroxides and/or sulfates and do not distinguish be- tween different carbonate minerals. This can be critical, as for example siderite can be a net acid producing car- bonate. Therefore, it is crucial to count on accurate quantitative mineral data in order to be able to accurately predict ARD formation and potential liberation of hazardous trace elements to the environment. In many modern mining operations, quantitative mineral data is nowadays produced in order to enhance the re- covery of the extraction process by the incorporation of geometallurgical information (e.g. quantitative mineral- ogy, mineral liberation, textural information, grain size distribution). Thus, the use of this very same existing data for ARD prediction can increase importantly the precision of ARD prediction, often without additional costs and testing. The only requirement is the interdisciplinary collaboration between the different divisions and data ex- change in a modern mining operation. © 2016 Elsevier B.V. All rights reserved. Keywords: Acid mine drainage Prediction Static and kinetic test Acid-Base Accounting (ABA) Mining Pollution Sustainability Contents 1. Introduction . . . . . . . . . . . . . . . . . . . . . . . . . . . . . . . . . . . . . . . . . . . . . . . . . . . . . . . . . . . . . . 121 2. Acid rock drainage and the importance of mineralogy. . . . . . . . . . . . . . . . . . . . . . . . . . . . . . . . . . . . . . . . . . . . 122 3. Acid rock drainage (ARD) formation . . . . . . . . . . . . . . . . . . . . . . . . . . . . . . . . . . . . . . . . . . . . . . . . . . . 123 3.1. Acid liberation . . . . . . . . . . . . . . . . . . . . . . . . . . . . . . . . . . . . . . . . . . . . . . . . . . . . . . . . . . 123 3.2. Acid neutralization . . . . . . . . . . . . . . . . . . . . . . . . . . . . . . . . . . . . . . . . . . . . . . . . . . . . . . . . 124 3.2.1. Silicates . . . . . . . . . . . . . . . . . . . . . . . . . . . . . . . . . . . . . . . . . . . . . . . . . . . . . . . . . 124 3.2.2. Hydroxides and hydroxide sulfates. . . . . . . . . . . . . . . . . . . . . . . . . . . . . . . . . . . . . . . . . . . . . 124 3.2.3. Carbonates . . . . . . . . . . . . . . . . . . . . . . . . . . . . . . . . . . . . . . . . . . . . . . . . . . . . . . . 124 4. Standard ARD prediction and its limitations . . . . . . . . . . . . . . . . . . . . . . . . . . . . . . . . . . . . . . . . . . . . . . . . 126 4.1. A historical background and mineralogical considerations . . . . . . . . . . . . . . . . . . . . . . . . . . . . . . . . . . . . . . 126 4.2. ABA calculation. . . . . . . . . . . . . . . . . . . . . . . . . . . . . . . . . . . . . . . . . . . . . . . . . . . . . . . . . . 126 4.3. Kinetic testing . . . . . . . . . . . . . . . . . . . . . . . . . . . . . . . . . . . . . . . . . . . . . . . . . . . . . . . . . . 127 5. Sample selection criteria for ARD prediction . . . . . . . . . . . . . . . . . . . . . . . . . . . . . . . . . . . . . . . . . . . . . . . . 128 6. Suggested characterization methodology for ARD prediction. . . . . . . . . . . . . . . . . . . . . . . . . . . . . . . . . . . . . . . . . 129 7. Conclusions. . . . . . . . . . . . . . . . . . . . . . . . . . . . . . . . . . . . . . . . . . . . . . . . . . . . . . . . . . . . . . . 130 Acknowledgements . . . . . . . . . . . . . . . . . . . . . . . . . . . . . . . . . . . . . . . . . . . . . . . . . . . . . . . . . . . . . 131 References. . . . . . . . . . . . . . . . . . . . . . . . . . . . . . . . . . . . . . . . . . . . . . . . . . . . . . . . . . . . . . . . . . 131 Journal of Geochemical Exploration 172 (2017) 120–132 E-mail address: Bernhard.Dold@ltu.se. http://dx.doi.org/10.1016/j.gexplo.2016.09.014 0375-6742/© 2016 Elsevier B.V. All rights reserved. Contents lists available at ScienceDirect Journal of Geochemical Exploration journal homepage: www.elsevier.com/locate/gexplo
  • 2. 1. Introduction Human history is an accumulation of conflicts about geo-resources (e.g. land, soil, water, metal, oil-gas). Therefore, mining has always had an essential role in the development of human history since the Neolithic Period. This has not changed today and most of the conflicts we observe nowadays have essentially the very same origin. Mining provides the metal supply of modern high-tech society. Although in daily life it is not very evident for most of the world's population, mining industry is the basis of economic wealth and technological development (Matsumoto et al., 2016), as can be observed in the industrial revolution in Europe (late 17th century) and the current information and energetic revolution world-wide. Although doubtless an essential industry, today's mining is facing severe problems for development, as the nega- tive aspects of the mining activity are perceived to affect more and more people in a globalized world. Thus, the mining industry is struggling to obtain the social license in many parts of the world in order to develop new projects (Owen and Kemp, 2013). This is mainly due to the fact that most stakeholders, without direct benefit from the mining activity, per- ceive mining as a threat for their health and the environment, as for ex- ample by the formation of acid mine drainage (AMD) or more general acid rock drainage (ARD) and subsequent water pollution (Fig. 1). As metal extraction technologies have evolved, the amounts of mine wastes produced have increased tremendously, a trend, which will in- crease even more in the future. Hence, more precise ARD prediction methods are required to tackle this problem. ARD is the result of the ox- idation sulfide-rich rocks, exposed by natural or anthropogenic process- es to the atmosphere, process, which leads to high element concentrations in and acidification of the water. This process can result in a pollution of surface and groundwater resources. In this review the more general term ARD is used, as this applies also for any sulfide con- taining material extracted and deposited to oxidizing conditions, like for example in road, tunnel, or construction activities, or in natural oxida- tion processes. In ancient times the metal supply was ensured by oxide ore deposits exposed on the surface of the earth crust (e.g. the gossan in the Iberian Pyritic belt from Roman time, or the silver gossans at Cerro de Pasco, Peru and Potosi, Bolivia pre-Inca and during the Spanish conquistador era (Abbott and Wolfe, 2003). Since the development of the flotation technique in the early 20th century (Bergh and Yianatos, 2011), it be- came possible to extract and separate metal sulfides from the primary zone of the ore deposit. This technological change, increased the dimen- sion of mining, as now low-grade ores could be economically exploited. As a consequence, the amount of the waste material produced increased dramatically. Additionally, the phenomena of sulfide oxidation associat- ed with the mining process could be first observed with the formation of acid mine drainage in coal mining (Colmer and Hinkle, 1947), which now is the main environmental challenge of the metal mining industry today (Dold, 2014). As in the last decades environmental pollution has reached levels, which are directly critical for human health in some parts of the world (Rockstrom et al., 2009), the environmental and sustainable aspects have gained an important role in the last decades. In order to get the dimension of the problem, the world production of some base metals through the importance of each exploited ore de- posit type is analyzed (Laznicka, 1999, 2014; Singer, 1995). Plumlee (1999) highlighted the relationship between ore deposit type and final ARD composition, which allows the behavioral prediction for most deposit types with respect to ARD formation, assuming that a good knowledge of their mineralogical composition is available. Giant (and super-giant) metallic ore deposits supply between 60 and 95% of global metallic resources on land, with several individual de- posits monopolizing the supply (Laznicka, 2014), from which Cu has the highest number of super-accumulations followed by Au, Pb, Mo, Sb, and Sn (Laznicka, 1999). This is mainly due to the geochemical behavior of the different metals during enrichment processes in the earth crust. Cu, Au and Mo are mainly extracted from porphyry systems (60% of the world copper production is from porphyry Cu-Mo and Cu-Au de- posits), and therefore the extraction of these elements is mainly done in huge mining operations (Gerst, 2008; Mudd et al., 2013). Thus, when considering these elements and the other ore deposit types, which host them (Fig. 1), it can be stated that most of the giant or super-giant deposits (except some carbonate hosted, skarn or placer de- posits) will be very prone to produce ARD (Fig. 1). ARD prediction is therefore an important issue due to the fact that ARD is one the principal environmental issue facing the mining industry nowadays (Fig. 2). Due to the increasing social pressure, governments and state agencies increasingly implement new regulations and laws to regulate mine waste management around the world, like for example the new mine closure law in Chile (in place since November 2012). Con- sequently, an accurate characterization of mine waste is required in order to evaluate the geochemical stability and predict if ARD might be an issue in the future that needs to be addressed and mitigated in time. There are mainly two types of tests applied to predict the behavior of a rock sample concerning ARD production: The static tests, which eval- uates if or not a sample will produce an acidic environment; and the ki- netic tests, which evaluates, when the acidification will take place and which elements are liberated from the sample. In order to obtain this in- formation, there are several tests widely used in the consulting and mining business and some are seen as standard methods. The standard methods applied in ARD prediction are listed, ex- plained and reviewed in several reports, books, and papers (Bouzahzah et al., 2014; Chotpantarat, 2011; Jacobs et al., 2014; Lottermoser, 2010; Parbhakar-Fox and Lottermoser, 2015; White and Jeffers, 1994; White et al., 1999) and will therefore not be all listed and addressed again in this review. It is also widely accepted that these tests have several limitations and sources of errors (Parbhakar-Fox and Lottermoser, 2015; White et al., 1999). Parbhakar-Fox and Lottermoser (2015) have recently highlighted many of these problems associated with ARD prediction in an excellent review of ARD prediction. Here I will focus on some additional, funda- mental errors (calculation factors) and limitations (only sulfides as pro- ton source) of the current standard approaches. Most of these fundamental problems and errors are known and some were highlight- ed 25 years ago (Norecol Environmental Consultants Ltd., 1991). How- ever, many of these errors and problems have been tolerated or ignored through time and it has reached a point where these test methods are established as standards in the mining and consultant Fig. 1. Percentage of the different giant copper deposits by ore types to global copper production (n = 221). Giant Cu-Mo and Cu-Au porphyry deposits represent about 60% of the world copper production. The in yellowish to reddish colored ore types tend to produce ARD, while the bluish colored skarn and carbonate hosted deposits might have enough carbonates to neutralize the acid potential of the ore (modified after Laznicka, 2014). 121 B. Dold / Journal of Geochemical Exploration 172 (2017) 120–132
  • 3. industries. They appear in guidelines and regulations, making it difficult to argue against them and promote new, more powerful approaches. Therefore, it is important to summarize these drawbacks once more in a comprehensive review and promote a modern use of mineralogical and geochemical data for ARD prediction. In modern mining operations the importance of quantitative miner- alogical characterization to increase the extraction efficiency by daily in- corporation of mineralogical data for decision making in the mining process has been recently shown (Cruz et al., 2012), and together with the development of automated quantitative mineralogy gives nowa- days new tools to improve the mining process (Gottlieb et al., 2000). Al- though this data exists in many modern, advanced mining operations, only sporadically it is also used for ARD prediction. This review has the aim of summarizing and explaining the main problem of standard ARD prediction and convince the reader that the use of the often existing quantitative mineralogy used originally for geometallurgical purpose in a mining operation, could improve impor- tantly also the ARD prediction, often without additional costs and testing. 2. Acid rock drainage and the importance of mineralogy The goal of acid rock drainage prediction is very simple. It deals with the mineralogical composition of a geological sample (Fig. 3). This sam- ple can contain different ratios of different minerals or mineral groups (e.g. silicates, carbonates, sulfides, sulfates, oxides). There are minerals which can produce acidity (e.g. sulfides through oxidation or Fe(III)hydroxides and/or sulfates through equilibrium reactions), which means they liberate protons (H+ ) into solution and elements, which can hydrolyze to complexes (e.g. Fe, Al, Mn) in solution and by doing so deprotonize water, resulting also in a liberation of protons into solution; i.e. resulting in an acidification. If a solution is acidic it in- creases the mobility of heavy metals (e.g. divalent cations Cu2+ , Zn2+ , Cd2+ , Pb2+ among others), which can pollute water resources, rivers, lakes, sea, or groundwater. On the other hand, there are minerals in a rock, which can neutralize these protons (e.g. carbonates, hydroxides, and silicates) and control Fig. 2. Some examples of acid mine drainage. Above left: AMD pond with schwertmannite/goethite precipitating as sediment, Quiulacocha tailings impoundment, Cerro de Pasco, Peru. Above right: Collection channel for the AMD solutions from Excelsior Waste Rock Dump, Cerro de Pasco, Peru. Below left: Solid AMD in form of efflorescent salts precipitating at Pan de Azúcar tailings impoundments, Argentina. Below right: Schwertmannite terraces forming in the AMD effluent from Rio Tinto mine, Spain. sulfides (SAP) sulfates carbonates (CaNP) feldspars (FNP) metal-hydroxides (sulfates) py cp gn gy sfs ca sd fh-gt sh jt an pls kfs Fig. 3. Schematic mineral composition of a rock samples and the different minerals and mineral group producing acidity or neutralizing protons. Yellow colors indicate acid potential (AP), blue neutralization potential (NP), grey and white, none of both. Abbreviations: py = pyrite; cp = chalcopyrite; gn = galena; fh = ferrihydrite; gt = goethite; sh = schwertmannite; jt = jarosite; gy = gypsum; sfs = sulfo-salts; ca = calcite; sd = siderite; an = anorthite; pls = plagioclase; kfs = K-feldspar. SAP = sulfide acid potential; CaNP = carbonate neutralization potential; FNP = feldspar neutralization potential. 122 B. Dold / Journal of Geochemical Exploration 172 (2017) 120–132
  • 4. the pH as buffers at certain values (Langmuir, 1997; Stumm and Morgan, 1996). If a solution is alkaline, the mobility of elements, which are stable as oxyanions for example SO4 2− , AsO4 3− , MoO4 2− , CrO4 2− among others, is increased (Langmuir, 1997; Stumm and Morgan, 1996). In order to predict if a rock (sample) will produce an acid, neutral or alkaline environment and/or liberate and possibly mobilize certain ele- ments, it is necessary to know as exact as possible how much of each mineral is present in the sample (and its composition; i.e. the trace ele- ment composition). Thus, any prediction technique has the goal to quantify the reactive minerals in the sample. From an analytical point of view, this is a very difficult task. There exist only two traditional ana- lytical techniques to characterize a mineral properly (i.e. define it's crys- talline parameters): Optical microscopy and X-ray diffraction (XRD). Both techniques have strong limitation for quantification. In case of op- tical microscopy, a semi-quantification can be done by point counting, which is a very slow and labor intensive technique by highly qualified mineralogist, thus very expensive. X-ray diffraction has a high detection limit (2–5%), so that it is not suitable for detection of trace minerals. There are techniques available to lower this detection limit like differen- tial XRD (Dold, 2003a), but are difficult to apply. Trace minerals can be most relevant for the environmental impact prediction, as clearly shown in the case of marine pollution associated to the tailings deposi- tion in fjords at the Black Angel mine, Greenland (Elberling et al., 2002; Perner et al., 2010; Poling and Ellis, 1995). The development of mineral quantification by the Rietveld method with XRD (Epp, 2016), give today the possibility of a semi-quantifica- tion of the mayor mineral phases in an mineral assemblage. Do to these drawbacks for mineralogical quantifications; alternative faster and cheaper methods were needed for mineral quantification, specifically for ARD prediction. Subsequently, geochemical methods based on quantification of element concentrations in the sample and as- sumption for their mineral association in order to quantify indirectly the mineral content, were developed (e.g. Acid-Base Accounting (ABA); (Sobek et al., 1978), with modifications (Lawrence et al., 1989; Skousen et al., 1997), or correlations for quantification by the reactivity of the mineral assemblage (e.g. paste-pH, Fizz test, NAG) were drawn (White et al., 1999). Parallel to this development of ARD prediction methods, due to the mentioned analytical limitations of the mineralogical techniques, a technique was needed for geosciences in general to quantify the mineral content of a sample in an automated and fast way, with higher accuracy and lower detection limit. This breakthrough was reached with the de- velopment of the SEM-EDX based automated quantitative mineralogy technique, also known as QEMSCAN® or Mineral Liberation Analysis (MLA) (Gottlieb et al., 2000). In order to predict ARD for a rock sample, it is necessary to quantify the acid liberating minerals and calculate the moles of protons poten- tially liberated, which is called the Acid Potential (AP). On the other hand, the amount of minerals, which can neutralize the produced pro- tons, are quantified, the so called Neutralization Potential (NP). The dif- ference between both indicates if the sample has enough buffer capacity to neutralize all protons potentially produced (i.e. stays circum-neu- tral), or it will produce more protons than it can neutralize, which means that it will ultimately produce acidic conditions. This is called the Acid-Base Accounting (ABA). If there is a lack of acid buffer to main- tain the system neutral, this buffer can be added, usually in form of car- bonates (e.g. calcite or dolomite or sometime as lime). Therefore, the calculations are done as tCaCO3/1000 t, in order to know how much car- bonates are needed to maintain the material neutral. As a result traditional, widely used standard prediction methods are applied, with many drawback and problems, and on the other hand, high-tech analytical techniques are available at a competitive price for the end-user. Thus, it can be predicted that it will be just a matter of time, when this change in the approach of ARD prediction will be ac- cepted as new standard. 3. Acid rock drainage (ARD) formation In this section, the geochemical and mineralogical basics necessary to understand the ARD prediction methodology are revised. For a more comprehensive review of the geochemical processes leading to ARD formation in mine waste, the reader is referred to the two open ac- cess publications (Dold, 2010, 2014) or other reference therein (Jambor and Blowes, 1994; Plumlee and Logsdon, 1999). 3.1. Acid liberation Sulfide minerals form and are stable under reducing conditions. Dur- ing mining these minerals can be exposed to oxidizing conditions, and subsequent, these minerals will undergo oxidation. This is usually highlighted in the literature with the example of pyrite oxidation, as this mineral is the most common sulfide and the one, which produces 4 mol of protons through its oxidation process (Colmer and Hinkle, 1947; Dold, 2014; Nordstrom, 2000; Singer and Stumm, 1970). This as- sumption is used in most ARD prediction method. Following Eq. (1), py- rite will oxidize in the presence of atmospheric oxygen and water, producing Fe(III)hydroxides, sulfate and 4 mol of protons per mole of pyrite oxidized by oxygen. Other sulfide minerals will produce different amounts of protons during oxidation under different geochemical con- ditions (Table 1). It can also be observed that mainly sulfide minerals containing iron produce net acidity via its oxidation, with exception of some lesser common sulfides like molybdenite, enargite, and stibnite. The liberated Fe2+ can oxidize automatically at pH N 4 or when cata- lyzed by bacterial activity at pH b 4 (e.g. Acidithiobacillus spp. or Leptospirillum spp.), a proton neutralizing process (Eq. (2)). The Table 1 Overview of the oxidation reactions of the most relevant sulfide minerals via atmospheric oxygen, considering the hydrolysis of ferric iron and the final amount of protons liberated. Below, the oxidation via ferric iron is shown with the liberated amounts of protons. The equations have to be seen as idealized and partial reactions with different end products and amounts of protons liberated may occur in nature. Sulfide mineral Formula Moles H+ Oxidation via oxygen + hydrolisis of Fe3+ Pyrite (FeS2) FeS2 + 3.75O2 + 3.5H2O = Fe(OH)3 + 2SO4 2− + 4H+ 4 Arsenopyrite (FeAsS) FeAsS + 2O2 + 3H2O = Fe(OH)3 + SO4 2− + HAsO4 2− + 3H+ 3 Chalcopyrite (CuFeS2) CuFeS2 + 4O2 + 3H2O = Cu2+ + Fe(OH)3 + 2SO4 2− + 2H+ 2 Pyrrhotite (Fe(1 − x)S) x = 0.1: Fe(0.9)S + 2.175O2 + 2.35H2O = 0.9Fe(OH)3 + SO4 2− + 2H+ 2 Enargite (Cu3AsS4) Cu3AsS4 + 8.75O2 + 2.5H2O = 3Cu2+ + HAsO4 2− + 4SO4 2− + 4H+ 4 Sphalerite (ZnS) ZnS + 2O2 + = Zn2+ + SO4 2− 0 Galena (PbS) PbS + 2O2 + = Zn2+ + SO4 2− 0 Covellite (CuS) CuS + 2O2 + = Zn2+ + SO4 2− 0 Oxidation via ferric iron Pyrite (FeS2) FeS2 + 14Fe3+ + 8H2O = 15Fe2+ + 2SO4 2− + 16H+ 16/2a Arsenopyrite (FeAsS) FeAsS + 13Fe3+ + 8H2O = 14Fe2+ + SO4 2− + HAsO4 2− + 15H+ 15/2a Chalcopyrite (CuFeS2) CuFeS2 + 16Fe3+ + 8H2O = Cu2+ + 17Fe2+ + 2SO4 2− + 16H+ 16/0a Pyrrhotite (Fe(1-x)S) x = 0.1: Fe(0.9)S + 7.8 Fe3+ + 4H2O = 8.7Fe2+ + SO4 2− + 8H+ 8/0.2a Enargite (Cu3AsS4) Cu3AsS4 + 35Fe3+ +20H2O = 3Cu2+ +HAsO4 2− + 35Fe2+ + 4SO4 2 + 39H+ 39/4a Sphalerite (ZnS) ZnS + 8Fe3+ + 4H2O = 8Fe2+ + SO4 2− + 8H+ 8/0a Galena (PbS) PbS + 8Fe3+ + 4H2O = 8Fe2+ + SO4 2− + 8H+ 8/0a Covellite (CuS) CuS + 8Fe3+ + 4H2O = 8Fe2+ + SO4 2− + 8H+ 8/0a a Amount of protons produced, considering if the amount of ferric iron has to be pro- duced first through oxidation in the system, which neutralizes one mole of protons per mole of ferric iron (Eq. (2)). 123 B. Dold / Journal of Geochemical Exploration 172 (2017) 120–132
  • 5. produced ferric iron can then hydrolyze and produce Fe(III) hydroxides, process which liberates 3 mol of protons per mole of iron (Eq. (3)). Therefore, hydrolysis is the main acid producing process, so that any lib- erated element during weathering able to de-protonate the water mol- ecule and hydrolyze (Ionic Potential (IP) between 4.6 and 5.6) can produce an excess of protons in solutions (e.g. Al, Fe, Mn), i.e. lower the pH. This is the reason that granites will produce acidic soils, al- though they do not contain sulfides. FeS2 þ 15=4O2 þ 7=2H2O⇒FeðOHÞ3 þ 2SO2− 4 þ 4Hþ ð1Þ Fe2þ þ 1=4O2 þ Hþ ⟺Fe3þ þ 1=2H2O ð2Þ Fe3þ þ 3H2O⟺FeðOHÞ3ðsÞ þ 3Hþ ð3Þ If pyrite is oxidized by ferric iron (Eq. (4)), 16 mol of protons are lib- erated per mole of pyrite oxidized. In this case it is crucial to have in mind that if the 14 mol of Fe3+ in Eq. (2) have to be produced in the sys- tem (i.e. in the fresh mine tailings impoundment or waste rock dump), 14 mol of protons will be neutralized (Eq. (2)), so that this reaction ef- fectively produces 2 mol of protons, as in the case with oxidation via at- mospheric oxygen. However, if a ferric iron-rich solution enters into a sulfide-rich system, then effectively 16 mol of protons are produced, as for example in the case of the Quiulacocha tailings impoundment and the Excelsior Waste-rock dump, Cerro de Pasco, Peru (Dold et al., 2009). FeS2 þ 14Fe3þ þ 8H2O⇒15Fe2þ þ 2SO2− 4 þ 16Hþ ð4Þ Based on these assumptions it is generally established that one mole of pyrite produces 4 mol of protons through its oxidation and the asso- ciated precipitation of Fe(OH)3 (Eq. (1)). This is used to calculate the AP of a rock unit based on its sulfur content and expressed as pyrite equivalent. Another proton source, which is not considered by the standard ARD prediction tests, is the group of Fe(III) hydroxides and Fe(III) hydroxide sulfates (e.g. jarosite-alunite group, schwertmannite) together with metal chlorides and sulfates (e.g. eriochalcite, chalcanthite, rhomboclase), which might be the source of important amounts of acid- ity in ARD systems. The protons might be liberated due to dissolution- equilibrium reaction or due to mineral transformation due to meta-sta- bility of the secondary mineralogy. Dissolution-equilibrium. RhomboclaseðdehydratedÞ : HFeðSO4Þ2 þ 3H2O ¼ FeðOHÞ3 þ 2SO2− 4 þ 4Hþ ð5Þ Transformation : jarosite⇒goethite : KFe3ðSO4Þ2ðOHÞ6⇒3FeOðOHÞ þ Kþ þ 2SO2− 4 þ 3Hþ ð6Þ Schwertmannite⇒goethite : Fe16O16ðOHÞ10ðSO4Þ3 þ 6H2O⇒16FeOðOHÞ þ 3SO2− 4 þ 6Hþ ð7Þ 3.2. Acid neutralization The produced protons will interact with the gangue minerals of the rock and may undergo neutralization processes. Here, three mineral groups are the most relevant as potential neutralization agents: carbon- ates, hydroxides, and silicates. 3.2.1. Silicates Among the silicates, quartz is considered as close to inert, and the dominant silicates for neutralization are the feldspars (Feldspar Neu- tralization Potential = FNP). Here are some important differences in the reaction kinetics to consider. While anorthite has acceptable relative reactivity in weathering processes, i.e. a relatively good FNP, plagioclase (albite100–30) or orthoclase (K-feldspar) have very low relative reactivi- ty (Table 2) and are therefore in general not considered in the evalua- tion of the overall neutralization potential (NP) of a rock unit (See Table 2), as equilibrium cannot reach in the contact time of the water with the mineral. In some cases high amount of intermediately fast weathering silicates like biotite and chlorite (~20%) for example from potassic and propylytic alterations, might add significant NP. 3.2.2. Hydroxides and hydroxide sulfates Different metal hydroxides can have contrasting roles in a geochem- ical system. For example they can act as buffer by receiving protons, or de-protonate the water molecule due to hydrolysis (Eq. (3)) or they can liberate hydroxide ions into solution (Ca(OH)2; portlandite), lead- ing to alkaline pH conditions. The principal hydroxide buffers in the ARD environment or acid soils are dominated by the most abundant metal cations with the valence 3+ ; i.e. Fe3+ and Al3+ . This is due to the ability of three valence cations to hydrolyze, given to their high ionic potential (IP) between 4.65 (Fe3+ ) and 5.61 (Al3+ ), forming solid hydroxide minerals like ferrihydrite, goethite, schwertmannite, jarosite-alunite, and gibbsite. These minerals represent buffers, which control the pH at ~4.3 (Al(OH)3; gibbsite), ~3.5 (Fe(OH)3; ferrihydrite, goethite), ~2.5–3.5 (schwertmannite), ~2 (jarosite). Thus, metal hy- droxides represent important buffers in the acid pH ranges (Fig. 4). 3.2.3. Carbonates As in ARD prediction, the most important question is to predict if the system maintain neutral pH or goes acid, therefore, the most important target minerals for the NP are the Ca-Mg carbonates, as they have a fast reactivity and tend to buffer the system a circum-neutral pH values (Table 2; Fig. 4). Therefore, it is crucial to apply the geochemistry of the carbonate system (Fig. 5) properly, in order to calculate and predict the NP accurately and the final ABA. Calcite, and magnesite (−logK 8.48, −logK 8.24) are fast dissolving carbonates, (Table 2), while dolomite has lower solubility (−logK 17.09). Therefore, calcite is generally considered in calculations for NP and results are expressed as its equivalent. Calcite is the key buffer to maintain the pH at circumneutral conditions and is therefore the most important neutralizing agent in the mining environment. As long as cal- cite is available as a buffer in the system, its acid dissolution will liberate bicarbonate (HCO3 − ) to the solution (Fig. 5) (Sherlock et al., 1995) and is able to neutralize one mole of protons per mole of calcite dissolved (Eq. (8)). This is also true in an open system in the presence of CO2(atm), Table 2 Relative reactivity in acid-neutralization capacity of minerals (after (Sverdrup, 1990).a Group Typical minerals Relative reactivity (pH 5) 1. Dissolving Calcite, dolomite, magnesite, aragonite, brucite, 1.0 2. Fast weathering Anorthite, olivine, garnet, diopside, wollastonite, jadeite, nepheline, leucite, spodumene 0.6 3.Intermediate weathering Enstatite, augite, hornblende, tremolite, actinolite, biotite, chlorite, serpentine, talc, epidote, zoisite, hedenbergite, glaucophane, anthophyllite 0.4 4. Slow weathering Plagioclase (Ab100–Ab30), kaolinite, vermiculite, montmorillonite, gibbsite 0.02 5. Very slow weathering K-feldspar, muscovite 0.01 6. “Inert”a Quartz, rutile, zircon 0.004 a “Inert” is a relative expression, as in geological element cycling no mineral is inert. 124 B. Dold / Journal of Geochemical Exploration 172 (2017) 120–132
  • 6. which enhance the dissolution of carbonates (Eq. (9)). For a detailed re- view of the carbonate system refer to (Appelo and Postma, 2010; Stumm and Morgan, 1996). CaCO3 þ Hþ ⟺Ca2þ þ HCO– 3 ð8Þ CO2ðatmÞ þ H2O þ CaCO3⇒Ca2þ þ 2HCO− 3 ð9Þ If the pH is below pK1 (6.3), then carbonic acid is the dominant spe- cie in solution (Eq. (10)). CaCO3 þ 2Hþ ⟺Ca2þ þ H2CO0 3 ð10Þ Therefore, the carbonate system is able to neutralize 2 mol of pro- tons at low pH (b6.3), but it is important to consider, that at pH b 6.3 the calcite buffer is destroyed and the aqueous carbonate species in so- lution become the only neutralization agent left in the system. There- fore, if calcite is still available as a buffer in the system, the dominant carbonate specie will be bicarbonate, as calcite buffers the pH around 7. This is the crucial consideration in acid base accounting calculations, and will be highlighted below in the discussion of the calculation factor. It is additionally important to consider the differences in carbonate mineralogy, as they might have different reaction kinetics, solubility and for example siderite might even produce net acidity under certain conditions. Siderite is frequently found in porphyry copper systems (Dold and Fontboté, 2001). Thus a mineralogical approach is also essen- tial for the estimation of the NP. Siderite may act as a neutralizer under certain conditions, and under other conditions as an acid producer. The following dissolution reaction may take place and buffer the system at pH around 5: FeCO3 þ 2Hþ ⟺Fe2þ þ H2CO– 3 ð11Þ Combined with ferrous iron oxidation and ferrihydrate formation, the overall siderite dissolution-oxidation reaction is: 4FeCO3 þ O2 þ 10H2O⟺4HCO– 3 þ 4FeðOHÞ3 þ 4Hþ ð12Þ This indicates that under elevated pH, where bicarbonate is stable, the total reaction from dissolution of siderite to the formation of ferrihydrate gives a net acid production of one mole hydrogen ion per mol siderite dissolved. However, under more acidic conditions, where carbonic acid is stable, there will be no net acid production. But, it has to be considered that when ferrous iron is liberated, at low pH, it can be mobilized even under neutral pH condition and, and under oxidizing conditions downstream, it will oxidize and hydrolyze while liberating of protons and producing ARD far from the source. If ferrous iron is present in a solution containing bicarbonate, the for- mation of siderite may occur by the following reaction: Fe2þ þ HCO– 3 ⟺FeCO3 þ Hþ ð13Þ This reaction buffers the pH at around 5–5.5 and its reaction path may be an alternative to ferrous to ferric iron oxidation and the consec- utive precipitation of Fe(III)oxyhydroxides. Geochemical studies by sev- eral authors have shown that in tailings impoundments and AMD affected aquifers the waters are frequently close to saturation or even oversaturated with respect to siderite (Blowes et al., 1991, 1994; Morin and Cherry, 1986), and siderite precipitation could be observed (Dold et al., 2009). Before entering into details of the prediction techniques, it is helpful to highlight the ARD prediction problem with three simplified examples. A.) Pyrite is the most abundant sulfide mineral in the Earth's upper crust and produces 4 mol of protons per mole of pyrite oxidized (Eq. (1)). Calcite is the most soluble carbonate and buffers at neu- tral pH, so that at these geochemical conditions one mole of pro- tons can be neutralized per mole of calcite (Eq. (5)). If the molar weight of pyrite (120 g/mol) and calcite (100 g/mol) is set as 1:1 for simplification (accepting an error of 16.7%), it can be assumed that a rock with N20 wt.% of pyrite will always produce ARD, even if the rest of the sample is pure calcite (20% × 4 = 80% cal- cite needed to neutralize the protons from pyrite oxidation). Thus there are ore deposit types, which will always produce ARD due to their mineral composition (e.g. massive sulfide ore bodies). B.) Porphyry copper deposits have usually only 2 wt.% pyrite in aver- age, but due to the fact that the exploited ore has no or very little carbonate content (around 8 wt,% of calcite would be needed) and the silicate assemblage has very low reactivity due to hydro- thermal alterations (mainly K-Feldspar), the mine waste of this deposit type is very prone to producing ARD (Dold and Fontboté, 2001). C.) A granite contains no sulfides and no carbonates, it is a rock only composed of silicates and trace amounts of other mineral types; i.e. quartz, feldspars, micas, and some accessory minerals as for Fig. 4. Typical buffers and their pH in an ARD system (carbonates buffers and metal hydroxides-sulfates buffers). 2 4 6 8 10 12 -8 -6 -4 -2 0 Log Conc. pH C O 2 − H 2 C O 3 3 3 H C O − [C O 3 2 −]T O T = 100.00 m M Fig. 5. Distribution of solute species in the aqueous carbonate system. Log concentration vs. pH for 100 mM CO3 2− . The pK1 is at 6.3 and pK2 at 10.3. 125 B. Dold / Journal of Geochemical Exploration 172 (2017) 120–132
  • 7. example hornblende, apatite, sphene, among others (Takaya, 2014). However, a weathered granite will most likely form an acidic environment (pH around 4.3–5.5) in the saprolite or soils (Liu et al., 2016); i.e. it produces ARD. This is due to the liberation of Al, and Fe through weathering process and the subsequent hy- drolysis of these elements, in combination with the lack of car- bonates and a feldspar assemblage of low relative reactivity. 4. Standard ARD prediction and its limitations 4.1. A historical background and mineralogical considerations The so-called static testing of a rock sample for its potential to pro- duce ARD tries, in a simplified geochemical way, to predict if a sample has an excess of AP or enough of NP to maintain the sample neutral. As a consequence, this has direct effects on the liberation and mobility of associated elements as stated above. This is normally done by a sim- plified geochemical quantification of sulfur in the bulk sample, which is assumed to be associated to the sulfide mineralogy (expressed as pyrite equivalent) and the carbonate mineralogy quantified by titration (expressed as calcite equivalent). Most of the standard methods applied in this field were developed for other needs and were used for ARD prediction in sulfide metal min- ing without considering the complexity of a sulfidic mineral assem- blage. This is, for example, the case for the most known ABA test, the so called Sobek test (Sobek et al., 1978), which was developed originally for coal mining. Therefore, the assumption that all sulfur is associated to pyrite was more or less correct in this geological environment. This test was then widely applied in the last decades also for ABA calculations in metal sulfide mining, where sulfur can be associated to many different minerals, which produce different amounts of acidity or produce no acidity at all (e.g. anhydrite-gypsum or sulfide, like sphalerite or galena, see Table 1). This problem was noted by (Lawrence et al., 1989), and several intents for improvement for the AP determination (Lawrence et al., 1989), as well for the NP estimation were published (Lawrence and Scheske, 1997; Paktunc, 1999). For example, a separation of the sul- fate mineralogy from the sulfide mineralogy was attempted through the dissolution of sulfates with HCl (Lawrence et al., 1989), which is now better known as the “Modified Sobek test”. Both tests assuming that only the sulfides are responsible for proton liberation. This assumption has to be expanded, as Fe(III)oxyhydroxides and Fe(III)oxyhydroxide sulfates like schwertmannite and jarosite, ferrihydrite and goethite, minerals which are often present in the ore geology, tend to acidify the solution due to equilibrium reactions (Alarcon et al., 2014; Dold, 2010), so that this mineralogy must also be included in an ABA (Dold and Weibel, 2013). Additionally, the HCl leach may attack some acid sol- uble sulfide or Fe(III) hydroxide sulfate minerals and has therefore a low selectivity. A more selective separation of sulfur associated with the oxide frac- tion from the sulfide sulfur fraction can be done by a hot NH4-oxalate leach (Dold and Fontboté, 2001), or by sequential extraction proto- cols established for a specific ore mineralogy e.g. (Dold, 2003a, 2003b), data which then gives the possibility of performing a high- resolution ABA, including the quantification of Fe(III)hydroxides and Fe(III)hydroxide sulfates and their respective AP. The Modified Sobek test (Lawrence and Scheske, 1997) can be seen as a two-step extraction method, were only the sulfur content is analyzed. As mentioned above, there can be a substantial difference if calcite or siderite is present as carbonate. For this reason an additional correction for siderite might be necessary (Skousen et al., 1997). 4.2. ABA calculation In addition to all of the problems related to the mineralogical consid- erations mentioned above, the key problem associated with standard ABA procedures remains the assumptions leading to the calculation fac- tors applied to the geochemical data. While it is generally accepted that one mole of oxidized pyrite produces 4 mol of protons, there is disagree- ment between the amounts of protons neutralized by calcite. The fol- lowing two Eqs. (14) and (15) are usually presented as the base for the calculation factor of 31.25 (e.g. GARD Guide (Verburg et al., 2009) etc.) for the AP of a sample applied to the total sulfur or sulfide sulfur concentrations of a sample. CaCO3 þ 2Hþ ⟺Ca2þ þ CO2 þ H2O ð14Þ CaCO3 þ 2Hþ ⟺Ca2þ þ H2CO3 ð15Þ This factor results from the assumptions that one mole of calcite can neutralize two moles of protons. As pyrite oxidation produces 4 mol of protons per mole of oxidized pyrite, and pyrite contains two moles of sulfur, the final assumption is that the protons produced by the oxida- tion of one mole of sulfur is neutralized by one mole of calcite. This leads to the following calculation: 100 mole weight calcite ð Þ=32 mole weight sulfur ð Þ 10 tCaCO3=1000t ð Þ ¼ 31:25: The factor 10 at the end is to present an applicable unit how much carbonate has to be added to the ARD forming material in tons of tCaCO3/1000 t (or g/kg or ‰) to buffer the system (sometimes the factor is presented without this adjustment as 3.125 (White et al., 1999). If it is accepted that calcite buffers the system at circum-neutral pH, and the general goal of mine waste management is to maintain the pH of the material neutral, then the carbonate specie present would be bi- carbonate (at pH 7 N 85% HCO3 – (Appelo and Postma, 2010); see Fig. 5 and Eq. (8)). Thus, Eq. (8) has to be considered for ABA calculations in- stead of Eq. (10) (or 14 and 15), latter overestimating the NP of calcite by about 100%. Therefore, a calculation factor of 62.5 should be applied, as two moles of calcite are needed to neutralize the acidity from one mole of sulfur: 2 100 mole weight calcite ð Þ=32 mole weight sulfur ð Þ 10 tCaCO3=1000t ð Þ ¼ 62:5: Therefore, the product of the sulfur concentrations multiplied with the factor 62.5 instead of 31.25 gives the AP for ARD prediction, by in- cluding the amount of protons possibly produced (assuming pyrite ox- idation as the only protons source) and the amount of protons able to be neutralized by the carbonates (assuming the presence of calcite) at neu- tral pH. As discussed above, it has to be considered a neutral pH for the carbonate NP, as only when the carbonate buffer is depleted the pH will decrease. This is different, if the amount of calcite has to be calculated to neutralize ARD. In this case, when the solution is acidic (pH b 6.3), cal- cite can neutralize two moles of protons per mole of calcite and there- fore the factor 31.25 is correct (i.e. for treatment). This is contrary to ARD prediction, were it is evaluated if the system goes from neutral to acidic conditions in the future (Prediction). In a strict sense, before ABA can be properly calculated, the paste-pH should be performed to evaluate the correct calculation factor based on the dominant carbonate speciation. The next step is the quantification of the NP in order to be able to cal- culate the final ABA. For standard ABA only the carbonate neutralization potential (CaNP) is considered. There are several approaches to quantify carbonates in a sample: The easiest and cheapest method is the macroscopic quantification by a geologist in a hand specimen. However, this is a qualitative analisis as the detection of calcite by eye is not easy and usually HCl 10% is used to detect calcite in the field. This qualitative quantification follows the same principles as applied in the Fizz-test (Bouzahzah et al., 2015b) and can be very arbitrary, and is therefore not recommended for quan- tification of NP. Sobek et al. (1978) boiled the sample in HCl and later 126 B. Dold / Journal of Geochemical Exploration 172 (2017) 120–132
  • 8. titrate with NaOH in order to quantify the carbonate species in the sam- ple. (Lawrence et al., 1989) expose the sample at room temperature to HCl for 24 h and then titrate with NaOH. A modified method for NP de- termination (NP(pH 6) method) was developed taking in account to de- termine the “effective” NP or the calcium carbonate equivalent available in the sample to maintain the pH above 6, as discussed above (White et al., 1999). This method implies titration with 1 N sulfuric acid until pH 6 is reached, so that it might be the most realistic for carbonate NP determination. Another possibility is to quantify the organic and mineral carbon by coulometric titration (E.g. Ströhlein® CS 702 or a LECO® CN-Analyzer). The mineral carbon concentrations are assumed to be associated to the carbonate minerals like calcite or dolomite and are expressed as CaCO3. If siderite is of concern, addition of H2O2 is applied to promote Fe ox- idation before back-titration to account for the above mentioned “sider- ite problem” in ARD prediction (Skousen et al., 1997). The carbonate quantification has then to be expressed in tCaCO3/1000 t, or g/kg, or ‰ in order to be able to calculate the final ABA with the AP. In general term, a good knowledge of the carbonate mineralogy is needed for ARD prediction. Although there are many different ways to present the ABA results, the most common is the sulfide net acid potential (SNAP) or net neu- tralization potential (NNP) NNP ¼ NP−AP: In the latter case, if the result is negative, this means that the mate- rial will form ARD, as there is an excess of AP (sulfides = pyrite) in re- lation to the carbonate content. If the result is positive, there is enough NP (carbonates = calcite) to maintain the material neutral. In some guidelines the range between −20 and +20 is called the “uncer- tain zone”. However, with good knowledge of the mineralogy, this is not an area of uncertainty. For example, if a material has 1 wt.% pyrite (0.53 wt.% S) and no NP, the ABA will be −16,7 (calculated with the fac- tor 31.25), but −33.4 with the factor 62.5, and this material will clearly produce ARD. A granite without any sulfides and in absence of carbon- ates will produce ARD although the NNP will be 0. Material from the ox- idation zone of an ore deposit or tailings impoundment has an NNP of zero as there are no sulfides and carbonates left due to sulfide oxidation. However, this zone has a pH ranges between 2 and 4 due to the pres- ence of Fe(III)hydroxides sulfates (Dold and Fontboté, 2001). In some cases the regulations apply a criterion for the ABA calcula- tions ranging from 1:1.2 to 1:3 (Nevada, California and Montana, respectively)(White et al., 1999), in order to ensure enough buffer ca- pacity. However, if the standard calculation factor of 31.25 was applied, a criterion of 1:2 would represent simply the correct factor of 62.5 and no additional safety would be available. Only if a factor of 1:3 was ap- plied, there would be some excess of buffer capacity for additional safety. 4.3. Kinetic testing Above, the static tests were discussed in order to predict if a sample has the potential to acidify the geochemical system or if it will maintain neutral or even go alkaline. Kinetic testing is used to investigate in which time frame this will occur. The standard tests (e.g. humidity cells; ASTM D5744-96) use col- umns or cells, were the samples are exposed to oxidation, and is flushed with deonized water after a certain time frame and the solution is ana- lyzed for the solutes, representing the reaction products of the oxidation process. In the mostly applied ASTM D5744-96 humidity cell test, a one kilo sample with a grain size of b6.3 mm is exposed to 3 days humid air, 3 days dry air and the seventh day the system is flushed with water which is then analyzed for physical-chemical parameters and element concentrations. These cycles are recommended to be repeated 20–25 times to report the evolution of pH, Eh and dissolved elements like sul- fate and Fe, Cu, Zn, Cd, Pb, As, Cr, among others. Although widely applied in the mining and consulting business for ARD prediction, these kinetic tests often do not give conclusive results as shown in a study at the Andina porphyry copper mine, Chile (Weibel et al., 2011). In this example, although all samples were classi- fied by ABA and mineralogical studies as ARD producing (Fig. 8), in the applied standard humidity cell tests (ASTM D5744–96), no acidification due to sulfide oxidation could be observed. From 78 samples only 11.5% reached final pH between 3.5 and 4.5, because of equilibrium reactions caused by the presence of Fe(III)hydroxides (these samples were locat- ed from the upper part of the ore deposit, suffering partial natural oxida- tion) and not due to sulfide oxidation during the experiment. The observed sulfate liberation was associated to anhydrite-gypsum disso- lution present in the primary ore mineral assemblage. 64% of the sam- ples maintained their circum-neutral pH (N6.3) and 14% reached final pH between 5.5 and 6.3 buffered by siderite. The evolution of the acidity concentrations, confirmed low ARD generation, were 73% of the sam- ples remained stable, 10.2 had scarce acidity liberation, and 16.6% had a fast contribution associated to the samples containing Fe(III) hydrox- ides (Weibel et al., 2011). Some unpublished test reports from high sulfide deposit types show a fast response of ARD formation in the recommended time frame. However, the scarce literature published on humidity cell tests of coal (Banerjee, 2014), carbonate containing sulfide rich tailings from Joutel tailings (Benzaazoua et al., 2004b) and of porphyry copper ores shows clearly that during the recommended time frame, mostly no acidifica- tion and increased element liberation could be observed, even if the ABA clearly suggests that the material should become acidic (Benzaazoua et al., 2004a; Filipek et al., 1999; Weibel et al., 2011). In a field study at the Talabre porphyry copper tailings at Chuquicamata, Chile, it was shown that the system need 3 to 5 years to acidify from the alkaline flotation conditions (pH 9.1) to a pH of 3.5–4 (Dold et al., 2004; Smuda et al., 2014). This is in the order of data shown in the GARD Guide of a cell test from an unknown ore type, where after 130 weeks the acidification and element release was observed. Thus, it can be stated that the recommended time frame is not suitable for many types of mineral assemblage, and a flexible set-up in time of these tests has to be proposed in order to ensure to document the geo- chemical behavior properly. Several parameters control the kinetics of sulfide oxidation, like microtextures (Parbhakar-Fox et al., 2013), textural relation-ships be- tween the minerals (Kwong, 1993), grain size, humidity, temperature, bacterial activity, availability of oxidants (e.g. oxygen or ferric iron) among others. Specifically it has shown by modifications of such cell tests, that a decrease in grain size, an increase of temperature and hu- midity results in an increase of the oxidation rates (Dold and Weibel, 2013; Dold et al., 2011). Too high water saturation might lower the ox- idation rates (Bouzahzah et al., 2015a). Thus, there are different possibilities to enhance the kinetics in the laboratory. Although the wet-dry cycle was introduced to simulate en- hanced weathering cycles, the bacterial community oxidized most effi- ciently in a modified cell test, under constant experimental conditions. Best response was reached at constant 40 °C and 95% humidity during the whole cycle and only flushing on the 14th day. The results have shown a more rapid response in element liberation and pH drop than with the ASTM D5744-96 approach (Dold and Weibel, 2013; Dold et al., 2011), which was run in parallel. Finally, in light of all the problems of the prediction the kinetics of ARD formation, it can be argued whether or not it is necessary to use ki- netic testing. If the mineralogy and geochemistry suggest clearly that ARD will be an issue in the future of an ore deposit, immediate action must be taken to prevent ARD formation and to be able to control all ef- fluent in future. Once ARD is formed it is extremely difficult to control it, thus prevention from the beginning of any mining activity must be the goal. 127 B. Dold / Journal of Geochemical Exploration 172 (2017) 120–132
  • 9. For example, it is easy to predict, only on the base of mineralogical composition that a porphyry copper tailings impoundment will first produce a sulfate plume (due to equilibrium reactions with gypsum-an- hydrite), and later ARD (due to sulfide oxidation), both infiltrating and polluting the groundwater (Dold, 2014). With this knowledge preven- tion measures must be in place, before operation starts. In this regard, it is incomprehensible that there are still many mining countries, with new legislation for environmental protection in place, which still do not demand a basal impermeabilization for mine waste deposits in order to prevent infiltration of contaminated plumes into the groundwater. 5. Sample selection criteria for ARD prediction It is most critical for ARD prediction, to select the correct samples for this purpose. In a mine waste environment, surficial samples from old oxidized mine tailings or waste rock dumps do not represent the full AP and NP, as they might have been affected by weathering processes. Therefore, samples must be extracted from depth, e.g. by drilling, in order to obtain samples for ARD prediction. Also the geological and petrological classification as selection criteria is most relevant for correct ARD prediction. As discussed above, the vast majority of base metal production has its origin in igneous ore deposit types. N90% of the giant metal accumulations on earth relied on water as formation agents (Laznicka, 1999), such that hydrothermal processes are essential for most ore forming processes. Hereby, metal rich hydro- thermal solutions interact with the host rock units and physio-geo- chemical changes (e.g. T, P, pH, redox) induce mineral precipitation and alteration. These processes can completely change the original min- eral composition of the host rock, i.e. adding elements or minerals and/ or altering minerals or transporting elements away (Fig. 6), so that sometimes only textural signs can be used for classification of the orig- inal rock unit (e.g. porphyric texture). For example when hydrothermal fluids interact with andesites or diorites along an active subduction margin, the alteration completely changes the original mineralogy and a Cu-Mo-Au porphyry deposit may form. From the ARD perspective, this mineralogical change is dramatic and crucial. Unaltered andesites or diorites do not have sulfides, thus their original AP is zero. They usu- ally also do not have any carbonates, so that their CaNP is also zero. An- desite or diorites contain plagioclases like albite - anorthite, latter a feldpar with good FNP, meaning that this original rock suite would be able to neutralize some protons. However, the metals, sulfur, and acidity that were provided to the system during hydrothermal alteration, re- sulted in the precipitation of sulfide minerals like for example pyrite, chalcopyrite, enargite, and arsenopyrite, all of which are potential acid producers. These processes are also accompanied by a strong change of the gangue mineralogy. For example, the plagioclases are altered to muscovite (quartz-sericitic alteration) or to potassic feldspar (potassic alteration) or kaolinite (argillic alteration), minerals with very low reac- tivity kinetics and buffer capacity (Table 2) and therefore not helpful for ARD neutralization. Keeping this in mind, for ARD prediction of an ore body it is key that for sample selection procedure the hydrothermal al- teration mineralogy classification is used, and not the original petrolog- ical or lithological classification (e.g. diorite or andesite), as sometimes observed. - Thus, using the original petrological classification as sample selec- tion criteria might also mislead geochemical modeling interpretations. For example, it is sometimes observed, that samples for ABA analysis are selected from petrological units like andesites or diorites, but no fur- ther mineralogical characterization is done and only the standard ABA data is used for prediction and setup for a geochemical model to predict future ARD quality. This gives way to the possibility of selecting samples outside the mineralized area (often no location of the samples in the ore deposit is given), and to assume that the feldspar specie is anorthite, which has acceptable neutralization properties. If equilibrium modeling uses the FNP without considering the reaction kinetics of the different feldspar species, unrealistic predictive geochemical modeling is the re- sult and as a conclusion, it maybe stated that the unit will not produce ARD. These examples highlight that it is crucial to understand which min- eralogy will be exposed to a specific geochemical condition in order to predict ARD formation, or more generally, to predict mineral stability and subsequent element liberation processes and changes in the geo- chemical system. Fig. 6. A) Typical suite of andesitic flows intruded by a dioritic porphyry along the South American west coast. The ABA of these rock units would be zero. B) Change in mineral composition due to hydrothermal alteration with complete change of the ABA to negative values (excess of sulfides). Only in the external part of the ore deposit, the precipitation of calcite in the propylitic alteration zone adds CaNP to the original rock units. 128 B. Dold / Journal of Geochemical Exploration 172 (2017) 120–132
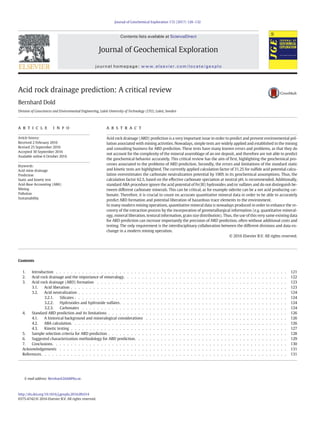
  • 10. 6. Suggested characterization methodology for ARD prediction The key information to predict ARD or any element liberation of a geological material, is the mineralogical composition of the sample. The mineralogy is the pool of potentially liberated and neutralization of protons through the above presented geochemical processes, and the subsequent liberation of elements to the environment in form of ARD or also as neutral to alkaline solutions. Variables like climate, mi- crobial interactions, grain size, textures, relationships between minerals (e.g. electrochemical bridges), play also a important role in these pro- cesses, but mainly control the kinetics of the processes leading to ARD, not the overall acid-base balance. Therefore, the efforts should be con- centrated in identifying the minerals present in a deposit, their quanti- fication, their relations and whether these minerals have potentially hazardous trace elements associated. In most cases, a simple overview of the ore deposit type and trace el- ement composition gives a good first estimate if it will produce ARD and which trace elements might be critical for the environment, and actions can be taken for ARD control or prevention (e.g. impermeabilization of the waste deposition sites and solution control), or further investiga- tions conducted. The first step should always be a thorough revision of the literature of the ore deposit. Publications in scientific journals (e.g., Mineralium Deposita, Economic Geology, Ore Geology Reviews, Journal of Geo- chemical Exploration, among others) usually have excellent data on the mineralogical characterization of the ore deposits. However, only seldom they do present quantitative mineralogical analysis data. But as shown above, with the information of the ore deposit type and the specific minerals present in an ore, a good first estimate of the ARD be- havior can be given; see also Plumlee (1999). The second step, should be a characterization to obtain quantitative mineralogical data (can nowadays be done by automated quantitative mineralogical analysis; e.g. QEMSCAN® or MLA). Many modern mining operations already use automated quantita- tive mineralogy and mineral liberation analysis for geometallurgical purposes to increase the recovery of their extraction process (Cruz et al., 2012). The very same data can and should be used for ARD predic- tion (Dold and Weibel, 2013), and no additional standard ABA tests are needed at no additional costs. As mentioned above, the standard ABA tests have to be seen only as a very simple, rough approach to at- tempt to quantify the ARD susceptible mineralogy through the use of geochemical data. In order to highlight which minerals are considered in the different methodologies and what data is given by the different techniques, these and the subsequent differences in the NNP are shown in Fig. 7 and Table 3. Although a good calibration and quality control for each ore and spe- cial care for sample preparation is necessary for accurate quantification of the mineralogy, these relatively new techniques are able to produce the necessary data in reasonable time frames and competitive prices (Nowadays an analysis by Automated Quantitative Mineralogy costs in the same range as a mineralogical interpretation of a thin section by a qualified mineralogist). Additionally they can quantify trace mineral amounts, not detectable with any other analytical technique (Menzies et al., 2015). This can be specially relevant if some trace elements are as- sociated to soluble minerals like metal sulfates or chlorides. However, in order to be able to predict trace element behavior, a more detailed geo- chemical characterization should be additionally performed on the min- erals. This can be done for example by sequential extractions, where the trace element concentrations of reactive mineral groups can be quanti- fied (Dold, 2003b). Additionally, sequential extractions have advantage in terms of turnaround time and prices in relation to some of the other techniques and give data for high- resolution acid-base accounting. Al- though, no prices for the different analysis in commercial labs can be given here, as they change with country and demand, the standard ABA tests are very expensive in relation of the information they deliver. For example the modified Sobek test (Lawrence), which is essentially a two step sequential extraction in which only sulfur is analyzed with an additional titration for the CaNP costs usually half or even more of the price, which costs a seven step sequential extraction with analysis of 31 elements in each leach. Thus, the geochemical information obtained by sequential extractions is much cheaper and gives much more infor- mation on the sample in relation to simple standard ABA procedures. Additional advanced analytical tools for geochemical characterization might be necessary like SEM-EDS, microprobe or Laser-ICP-MS, where trace metal concentration of specific minerals can be detected and quantified and therefore their liberation under specific geochemical conditions can be predicted. In Fig. 7 only quantitative mineralogy is able to account on the differ- ent sulfide minerals, which produce different amounts of protons through their oxidation. Also the AP from Fe(III)hydroxides and sulfates can be quantified, as well the differences in NP between calcite and sid- erite and the different feldspars can be considered. Sobek would ac- count any sulfur as sulfide sulfur in form of pyrite and siderite as full CaNP. It also does not account the AP from iron hydroxides and sulfates. sulfides (SAP) sulfates carbonates (CaNP) feldspars (FNP) metal-hydroxides (sulfates) py cp gn gy sfs ca sd fh-gt sh jt an pls kfs Automated Quantitative Mineralogy e.g. QEMSCAN - MLA Sobeck Lawrence Skousen Fig. 7. Schematic illustration which minerals are detected and/or considered in the different techniques and calculated as acid potential or neutralization potential. Yellow colors indicate acid potential, blue neutralization potential and grey and white none of both. Abbreviations: py = pyrite; cp = chalcopyrite; gn = galena; fh = ferrihydrite; gt = goethite; sh = schwertmannite; jt = jarosite; gy = gypsum; sfs = sulfosalts; ca = calcite; sd = siderite; an = anorthite; pls = plagioclase; kfs = K-feldspar. SAP = sulfide acid potential; CaNP = carbonate neutralization potential; FNP = feldspar neutralization potential. 129 B. Dold / Journal of Geochemical Exploration 172 (2017) 120–132
  • 11. Lawrence improve in the sense that it does not account gypsum or an- hydrite as sulfide sulfur, but the AP from sulfosalts and Fe(III)hydroxide sulfates is also not considered. Lawrence does consider siderite as full NP. Skousen accounts for the siderite problem and corrects the NP. In Table 3 the different ABA (NNP) interpretations resulting through the characterization of a sample by the different test methods are highlighted: quantitative mineralogy with QEMSCAN, Sobek (Sobek et al., 1978), Lawrence (Lawrence et al., 1989), and siderite corrected (Skousen et al., 1997). This hypothetical sample, typical for a porphyry copper deposit, shows which of the minerals or mineral groups are addressed in the dif- ferent methodologies. On the left side is the mineralogy detected by mi- croscopy and quantified by QEMSCAN. From the detected sulfide minerals pyrite is producing 4 mol of protons by its oxidation, chalcopy- rite 2 mol, sphalerite and galena zero, and the sulfates gypsum-anhy- drite also produce zero. These differences can be considered, if quantitative mineralogy is available, while the Sobek method assumes all sulfur containing minerals as acid producers and thereby overesti- mates the AP strongly. With respect to carbonate neutralization poten- tial, Sobek strongly overestimates this value, as siderite is also included. The Lawrence method takes into account sulfates like gypsum, which do not produce acidity, but also overestimates the sulfur AP, as it considers sphalerite and galena as acid producers. Lawrence also overestimates the CaNP as siderite is considered as a neutralizer. Even if Lawrence is corrected for siderite (Skousen), it overestimates the AP, and applies the wrong calculation factor as shown by the difference with the stan- dard calculation coefficient of 31.25 and the suggested 62.5 (see Section 4.2). As a result, with quantitative mineralogy it is predicted that the sam- ple has an NNP of −28.1 tCaCO3/1000 t (‰). Calculated with the wrong, but widely used factor (31.25) the conclusion is that it lies in the uncer- tainty area with tendency to ARD foramtion (−11.36‰). In contrast, Sobek and Lawrence would predict that the sample is not ARD produc- ing. Only if corrected for siderite, the NNP is also negative (−29.48). If, for all 3 standard tests the factor 62.5 instead of 31.25 were applied, in all cases the NNP would be negative. The same trend can also be ob- served in a data set of 200 samples from the Andina porphyry copper mine in Fig. 8. This clearly shows the importance of a correct mineral quantification and correct geochemical calculations in order to properly predict the ARD potential. However, it is interesting to observe that sometimes, although a strong data set of quantitative mineralogy and geochemical data exists in a project, responsible managers spend additional money for the stan- dard ABA tests, which illustrates how well established these tests are in the mining industry and state agencies, despite all the above-mentioned drawbacks and errors. 7. Conclusions Standard static acid rock drainage prediction methodologies are based on simple geochemical tests with the goal to quantify potential acid production and NP of a geological sample. Due to the simplicity of the approach and it's basic assumptions, these tests have many prob- lems and drawback, not able to account for the complexity of the min- eral assemblage of an ore deposit, and therefore not able to accurately predict ARD formation. Also, standard kinetic testing is not able to pro- duce concordant data for ARD prediction in the proposed time frames. On the other hand, mineral characterization and automated mineral quantification has experienced in the last decades important develop- ment (e.g. QEMSCAN® and MLA). These data are increasingly produced in modern mining operation, nowadays mainly for geometallurgical purposes to increase the recovery from the ore. It can be predicted that this data will be available in the near future in most competitive mining operations. Thus, it is suggested to use the very same data of quantitative mineralogy for ARD prediction with no additional costs and testing, instead the very limited and problematic standard ARD pre- diction tests. Table 3 Overview of a typical sample from a porphyry copper deposit and the results of the different standard ABA approaches in relation to the quantitative mineralogy by QEMSCAN®. Quantitative mineralogy e.g. QEMSCAN Sobek Lawrence Skousen (siderite corrected) 31.25 62.5 31.25 62.5 31.25 62.5 31.25 62.5 Mineralogy wt.% S wt.% wt.% S SAP (‰CaCO3) SAP SAP SAP SAP SAP SAP SAP Pyrite 53.3 1 0.53 16.66 33.31 16.66 33.31 16.66 33.31 16.66 33.31 Chalcopyrite 34.87 1 0.35 5.45** 10.9* * 10.90 21.79 10.90 21.79 10.90 21.79 Sphalerite 32.86 0.5 0.16 0 0.00 5.13 10.27 5.13 10.27 5.13 10.27 Galena 13.38 0.5 0.07 0 0.00 2.09 4.18 2.09 4.18 2.09 4.18 Gypsum– Anhydrite 23.52 3 0.71 0 0.00 22.05 44.10 0 0 0 0 Total SAP 16.66 33.31 56.83 113.66 34.78 69.56 34.78 69.56 CaNP (‰)* wt.% C wt.% wt.% C (‰CaCO3) ‰ Calcite 12 0.5 0.06 5.30 5.30 5.30 5.30 5.00 5.30 5.30 5.30 Siderite 10.3 6 0.62 0 0.00 54.57 54.57 54.57 54.57 0.00 0.00 Total CaNP 5.30 5.30 59.87 59.87 59.57 59.87 5.30 5.30 ABA (NNP) –11.36 –28.01 3.04 –53.79 24.79 –9.69 –29.48 –64.26 * Calculation factor for CaNP is 88.3. ** For chalcopyrite only 2 mol of H+ is considered factor is 31.25/2 or 62.5/2. Green: ABA calculated based on quantitative mineralogy. Orange: ABA calculated after mostly applied prediction protocols. 130 B. Dold / Journal of Geochemical Exploration 172 (2017) 120–132
  • 12. However, if standard testing is applied for ARD prediction, following improvements should be applied: 1. Based on the paste-pH of the sample, the calculation factor of the sul- fide AP should be chosen: If the paste pH is N6.3 the factor 62.5 must be applied (i.e. for ARD prediction). If the paste pH is b6.3, 31.25 is the correct factor for calculation, i.e. for ARD treatment. 2. The separation of the sulfate sulfur from the sulfide sulfur is the cor- rect way, as applied by Lawrence et al. (1989). However, the use of HCl is not very selective, as many sulfides may suffer partial dissolu- tion. A leach with 0.2 M NH4-oxalate, pH 3, at 80° for 2 h has shown to completely dissolve all ferric iron oxides and hydroxides sulfate min- erals present in sulfide ore deposits (Dold, 2003b), and is therefore recommended as more selective leach for this approach. The use of sequential extractions can improve importantly the resolution and precision of the ARD prediction (Dold, 2003b; Dold and Weibel, 2013). 3. For the determination of the NP, the Modified NP(pH 6) Method (White et al., 1999) is the most realistic. It considers the real pH con- ditions were the neutralization processes take place for ARD predic- tion, and considers the carbonate speciation in the system, and is therefore recommended. Acknowledgements I would like to thank Simon Catchpole and Robert Pooler for their thorough revisions, suggestions and comments, which strongly im- proved the manuscript. The author acknowledges the constructive com- ments of the anonymous reviewers to improve the manuscript. References Abbott, M.B., Wolfe, A.P., 2003. Intensive pre-Incan metallurgy recorded by lake sedi- ments from the Bolivian Andes. Science 301, 1893–1895. Alarcon, R., Gaviria, J., Dold, B., 2014. Liberation of adsorbed and co-precipitated arsenic from jarosite, schwertmannite, ferrihydrite, and goethite in seawater. Minerals 4 (2), 603–620. Appelo, C.A.J., Postma, D., 2010. Geochemistry, Groundwater and Pollution. 2nd edition. CRC, Balkema, Leiden. Banerjee, D., 2014. Acid drainage potential from coal mine wastes: environmental assess- ment through static and kinetic tests. Int. J. Environ. Sci. Technol. 11, 1365–1378. Benzaazoua, M., Bussière, B., Dagenais, A.M., Archambault, M., 2004a. Kinetic tests com- parison and interpretation for prediction of the Joutel tailings acid generation poten- tial. Environ. Geol. 46, 1086–1101. Benzaazoua, M., Bussiere, B., Dagenais, A.M., Archambault, M., 2004b. Kinetic tests com- parison and interpretation for prediction of the Joutel tailings acid generation poten- tial. Environ. Geol. 46, 1086–1101. Bergh, L.G., Yianatos, J.B., 2011. The long way toward multivariate predictive control of flotation processes. J. Process Control 21, 226–234. Blowes, D.W., Ptacek, C.J., Jambor, J.L., 1994. Secondary minerals and acid mine-water chemistry. In: Jambor, J.L., Blowes, D.W. (Eds.), Short course handbook on environ- mental geochemistry of sulfide mine-waste. 22. Mineralogical Association of Canada, Nepean, pp. 367–379 Blowes, D.W., Reardon, E.J., Jambor, J.L., Cherry, J.A., 1991. The formation and potential im- portance of cemented layers in inactive sulfide mine tailings. Geochim. Cosmochim. Acta 55, 965–978. Bouzahzah, H., Benzaazoua, M., Bussiere, B., Plante, B., 2014. Prediction of acid mine drain- age: Importance of mineralogy and the test protocols for static and kinetic tests. Mine Water Environ. 33, 54–65. Bouzahzah, H., Benzaazoua, M., Bussière, B., Plante, B., 2015a. ASTM normalized humidity cell kinetic test: protocol improvements for optimal sulfide tailings reactivity. Mine Water Environ. 34, 242–257. Bouzahzah, H., Benzaazoua, M., Plante, B., Bussiere, B., 2015b. A quantitative approach for the estimation of the “fizz rating” parameter in the acid-base accounting tests: a new adaptations of the Sobek test. J. Geochem. Explor. 153, 53–65. Chotpantarat, S., 2011. A review of static tests and recent studies. Am. J. Appl. Sci. 8, 400–406. Colmer, A.R., Hinkle, M.E., 1947. The role of microorgamisms in acid mine drainage. Sci- ence 106, 253–256. Cruz, J., Bustos, C., Martínez, C., Suazo, H., 2012. Daily Mineralogical Control of Andina Di- vision Concentrator CODELCO CHILE. Geomet2012. Dold, B., 2003a. Dissolution kinetics of schwertmannite and ferrihydrite in oxidized mine samples and their detection by differential X-ray diffraction (DXRD). Appl. Geochem. 18, 1531–1540. Dold, B., 2003b. Speciation of the most soluble phases in a sequential extraction proce- dure adapted for geochemical studies of copper sulfide mine waste. J. Geochem. Explor. 80, 55–68. Dold, B., 2010. Basic concepts in environmental geochemistry of sulfide mine-waste man- agement. In: Kumar, S. (Ed.), Waste Management, pp. 173–198 (http://www. intechopen.com/books/show/title/waste-management). Dold, B., 2014. Evolution of acid mine drainage formation in sulphidic mine tailings. Min- erals 4 (2), 621–641. Dold, B., Fontboté, L., 2001. Element cycling and secondary mineralogy in porphyry cop- per tailings as a function of climate, primary mineralogy, and mineral processing. J. Geochem. Explor. 74, 3–55. Dold, B., Weibel, L., 2013. Biogeometallurgical pre-mining characterization of ore de- posits: an approach to increase sustainability in the mining process. Environ. Sci. Pollut. Res. 20, 7777–7786. Dold, B., Vogt, M.-L., Spangenberg, J.E., Kobek, M., 2004. Hydrogeochemistry of the active tailings impoundment Talabre, Chuquicamata, Chile. Geochim. Cosmochim. Acta 68, A450. Dold, B., Wade, C., Fontbote, L., 2009. Water management for acid mine drainage control at the polymetallic Zn-Pb-(Ag-Bi-Cu) deposit of Cerro de Pasco, Peru. J. Geochem. Explor. 100, 133–141. Dold, B., Weibel, L., Cruz, J., 2011. New Modified Humidity Cells Test for Acid Rock Drain- age Prediction in Porphyry Copper Deposits. EnviroMine, Santiago de Chile. Elberling, B., Asmund, G., Kunzendorf, H., Krogstad, E.J., 2002. Geochemical trends in metal-contaminated fiord sediments near a former lead-zinc mine in West Green- land. Appl. Geochem. 17, 493–502. Epp, J., 2016. X-ray diffraction (XRD) techniques for materials characterization. Materials Characterization Using Nondestructive Evaluation (NDE) Methods, pp. 81–124. Filipek, L.H., VanWyngarden, T.J., Papp, C.S.E., Curry, J., 1999. A multi-phase apprach to predict acid production from porphyry copper-gold waste rock in an arid montane environment. In: Filipek, L.H., Plumlee, G.S. (Eds.), The Environmental Geochemistry of Ore Deposits, Part B: Case Studies and Research TopicsReviews in Economic Geol- ogy. Society of Economic Geologists, pp. 433–444. Gerst, M.D., 2008. Revisiting the cumulative grade-tonnage relationship for major copper ore types. Econ. Geol. 103, 615–628. Gottlieb, P., Wilkie, G., Sutherland, D., Ho-Tun, E., Suthers, S., Perera, K., Jenkins, B., Spencer, S., Butcher, A., Rayner, J., 2000. Using quantitative electron microscopy for process mineralogy applications. JOM 52, 24–25. Jacobs, J.A., Lehr, J.H., Testa, S.M., 2014. Acid Mine Drainage, Rock Drainage, and Acid Sul- fate Soils: Causes, Assessment, Prediction, Prevention, and Remediation. Jambor, J.L., Blowes, D.W., 1994. Environmental geochemistry of sulfide mine-wastes. In: Jambor, J.L. (Ed.), Short Course Series. Mineralogical Association of Canada, Nepean, p. 438. Samples Fig. 8. Left: Blue bars: Percentage of the 78 samples plotting into the generator, uncertain (−20–20) and non-generator ABA from the Andina porphyry copper deposit (Weibel et al., 2011), obtained by the modified ABA (Lawrence et al., 1989) and calculated with 31.25. Red bars: high-resolution ABA obtained from sequential extraction data (Dold, 2003a, 2003b) from 200 samples from Andina and calculated with 62.5 (Dold et al., 2011). Right: Quantitative mineralogy of the same 200 samples obtained by QEMSCAN®, showing clearly that calcite are very minor traces and only siderite is available as carbonate NP, thus, all samples are clearly ARD producers. 131 B. Dold / Journal of Geochemical Exploration 172 (2017) 120–132
  • 13. Kwong, Y.T.J., 1993. Prediction and Prevention of Acid Rock Drainage from a Geological and Mineralogical Perspective. MEND, p. 47. Langmuir, D., 1997. Aqeous Environmental Geochemistry. Prentice Hall. Lawrence, R.W., Scheske, M., 1997. A method to calculate the neutralization potential of mining wastes. Environ. Geol. 32, 100–104. Lawrence, R.W., Poling, G.W., Ritcey, G.M., Marchant, P.B., 1989. Assessment of Predictive Methods for the Determination of AMD Potential in Mine Tailings and Waste Rock, Tailings and Effluent Management. Pergamon Press, New York, Halifax, pp. 317–331. Laznicka, P., 1999. Quantitative relationships among giant deposits of metals. Econ. Geol. 94, 455–473. Laznicka, P., 2014. Giant metallic deposits-a century of progress. Ore Geol. Rev. 62, 259–314. Liu, W., Liu, C., Brantley, S.L., Xu, Z., Zhao, T., Liu, T., Yu, C., Xue, D., Zhao, Z., Cui, L., Zhang, Z., Fan, B., Gu, X., 2016. Deep weathering along a granite ridgeline in a subtropical cli- mate. Chem. Geol. 427, 17–34. Lottermoser, B.G., 2010. Mine Wastes. Characterization, Treatment and Environmental Impacts, third edition. Matsumoto, S., Shimada, H., Sasaoka, T., 2016. The key factor of acid mine drainage (AMD) in the history of the contribution of mining industry to the prosperity of the United States and South Africa: a review. Nat. Resour. 7, 445–460. Menzies, A., Álvarez, E., Belmar, M., Belma, A., Marquardt, M., Albornoz, A., Vargas, M., Dold, B., 2015. Quantification of trace REE-minerals using automated mineralogy. Chilean Geological Congress, La Serena. Chile. Morin, A.K., Cherry, J.A., 1986. Trace amoumts of siderite near a uranium-tailings im- poundments, Elliot Lake, Ontario, and its implications in controlling contaminant mi- gration in a sand aquifer. Chem. Geol. 56, 117–134. Mudd, G.M., Weng, Z., Jowitt, S.M., 2013. A detailed assessment of global Cu resource trends and endowments. Econ. Geol. 108, 1163–1183. Nordstrom, D.K., 2000. Advances in the hydrogeochemistry and microbiology of acid mine waters. Int. Geol. Rev. 42, 499–515. Norecol Environmental Consultants Ltd., 1991. New Methods for Determination of Key Mineral Species in Acid Generation Prediction by Acid Base Accounting. MEND, p. 67. Owen, J.R., Kemp, D., 2013. Social licence and mining: a critical perspective. Res. Policy 38, 29–35. Paktunc, A.D., 1999. A method to calculate the neutralization potential of mining wastes; discussion. Environ. Geol. 38, 82–84. Parbhakar-Fox, A., Lottermoser, B.G., 2015. A critical review of acid rock drainage predic- tion methods and practices. Miner. Eng. 82, 107–124. Parbhakar-Fox, A., Lottermoser, B., Bradshaw, D., 2013. Evaluating waste rock mineralogy and microtexture during kinetic testing for improved acid rock drainage prediction. Miner. Eng. 52, 111–124. Perner, K., Leipe, T., Dellwig, O., Kuijpers, A., Mikkelsen, N., Andersen, T.J., Harff, J., 2010. Contamination of arctic Fjord sediments by Pb-Zn mining at Maarmorilik in central West Greenland. Mar. Pollut. Bull. 60, 1065–1073. Plumlee, G.S., 1999. The environmental geology of mineral deposits. In: Plumlee, G.S., Logsdon, M.J. (Eds.), The Environmental Geochemistry of Ore Deposits. Part A: Pro- cesses, Techniques, and Health Issues. Reviews in Economic Geology, pp. 71–116. Plumlee, G.S., Logsdon, M.J., 1999. The Environmental Geochemistry of Ore Deposits. Part A: Processes, Techniques, and Health Issues. Reviews in Economic GeologySociety of Economic Geologist. Poling, G.W., Ellis, D.V., 1995. Importance of geochemistry: the Black Angel lead-zinc mine, Greenland. Mar. Georesour. Geotechnol. 13, 101–118. Rockstrom, J., Steffen, W., Noone, K., Persson, A., Chapin, F.S., Lambin, E., Lenton, T.M., Scheffer, M., Folke, C., Schellnhuber, H.J., Nykvist, B., de Wit, C.A., Hughes, T., van der Leeuw, S., Rodhe, H., Sorlin, S., Snyder, P.K., Costanza, R., Svedin, U., Falkenmark, M., Karlberg, L., Corell, R.W., Fabry, V.J., Hansen, J., Walker, B., Liverman, D., Richardson, K., Crutzen, P., Foley, J., 2009. Planetary boundaries: exploring the safe operating space for humanity. Ecol. Soc. 14. Sherlock, E.J., Lawrence, R.W., Poulin, R., 1995. On the neutralization of acid rock drainage by carbonate and silicate minerals. Environ. Geol. 25, 43–54. Singer, D.A., 1995. World-cass base and precious-metal deposits - a qantitative-analysis. Econ. Geol. Bull. Soc. Econ. Geol. 90, 88–104. Singer, P.C., Stumm, W., 1970. Acid mine drainage: the rate-determining step. Science 167, 1121–1123. Skousen, J., Renton, J., Brown, H., Evans, P., Leavitt, B., Brady, K., Cohen, L., Ziemkiewicz, P., 1997. Neutralization potential of overburden samples containing siderite. J. Environ. Qual. 26, 673–681. Smuda, J., Dold, B., Spangenberg, J.E., Friese, K., Kobek, M.R., Bustos, C.A., Pfeifer, H.-R., 2014. Element cycling during the transition from alkaline to acidic environment in an active porphyry copper tailings impoundment, Chuquicamata, Chile. J. Geochem. Explor. 140, 23–40. Sobek, A.A., Schuller, W.A., Freeman, J.R., Smith, R.M., 1978. Field and laboratory methods applicable to overburden and mine soils. EPA 600/2-78-054, p. 203. Stumm, W., Morgan, J.J., 1996. Aquatic Chemistry. 3rd ed. Wiley, New York. Sverdrup, H.U., 1990. The Kinetics of Base Cation Release Due to Chemical Weathering. Lund University Press, Lund. Takaya, Y., 2014. Which constituent mineral is dominant in granite weathering? A solu- tion-sided approach through a laboratory experiment. Geoderma 230-231, 204–211. Verburg, R., Bezuidenhout, N., Chatwin, T., Ferguson, K., 2009. The global acid rock drain- age guide (GARD guide). Mine Water Environ. 28, 305–310. Weibel, L., Dold, B., Cruz, J., 2011. Application and limitation of standard humidity cell tests at the Andina porphyry copper mine. SGA Biennal Meeting, Antofagasta, Chile. CODELCO, Chile. White III, W.W., Jeffers, T.H., 1994. In: Alpers, C.N., Blowes, D.W. (Eds.), Chemical predic- tive modeling of acid mine drainage from metallic sulfide-bearing waste rock. Envi- ronmental Geochemistry of Sulfide Oxidation, Washington, pp. 608–630. White III, W.W., Lapakko, K.A., Cox, R.L., 1999. Static-test methods most commonly used to predict acid mine drainage: practical guidelines for use and interpretation. In: Plumlee, G.S., Logsdon, M.J. (Eds.), The Environmental Geochemistry of Ore Deposits. Part A: Processes, Techniques, and Health Issues. Reviews in Economic Geology, pp. 325–338. 132 B. Dold / Journal of Geochemical Exploration 172 (2017) 120–132