
Recommended
More Related Content
What's hot
What's hot (19)
Similar to Technical Analysis Nifty Live Trading in Futures and Options
Similar to Technical Analysis Nifty Live Trading in Futures and Options (20)
Recently uploaded
Recently uploaded (20)
Technical Analysis Nifty Live Trading in Futures and Options
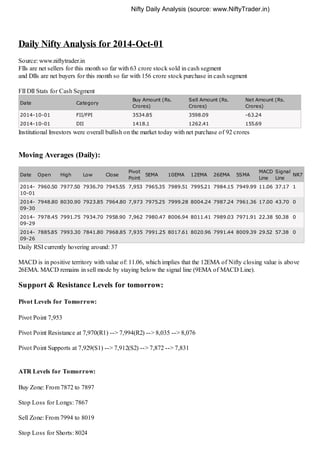
- 1. Daily Nifty Analysis for 2014-Oct-01 Source: www.niftytrader.in FIIs are net sellers for this month so far with 63 crore stock sold in cash segment and DIIs are net buyers for this month so far with 156 crore stock purchase in cash segment FII DII Stats for Cash Segment Date Category Buy Amount (Rs. Crores) Sell Amount (Rs. Crores) Net Amount (Rs. Crores) 2014-10-01 FII/FPI 3534.85 3598.09 -63.24 2014-10-01 DII 1418.1 1262.41 155.69 Institutional Investors were overall bullish on the market today with net purchase of 92 crores Moving Averages (Daily): Date Open High Low Close Pivot Point 5EMA 10EMA 12EMA 26EMA 5SMA MACD Line Signal Line NR7 2014- 10-01 7960.50 7977.50 7936.70 7945.55 7,953 7965.35 7989.51 7995.21 7984.15 7949.99 11.06 37.17 1 2014- 09-30 7948.80 8030.90 7923.85 7964.80 7,973 7975.25 7999.28 8004.24 7987.24 7961.36 17.00 43.70 0 2014- 09-29 7978.45 7991.75 7934.70 7958.90 7,962 7980.47 8006.94 8011.41 7989.03 7971.91 22.38 50.38 0 2014- 09-26 7885.85 7993.30 7841.80 7968.85 7,935 7991.25 8017.61 8020.96 7991.44 8009.39 29.52 57.38 0 Daily RSI currently hovering around: 37 MACD is in positive territory with value of: 11.06, which implies that the 12EMA of Nifty closing value is above 26EMA. MACD remains in sell mode by staying below the signal line (9EMA of MACD Line). Support & Resistance Levels for tomorrow: Pivot Levels for Tomorrow: Pivot Point 7,953 Pivot Point Resistance at 7,970(R1) --> 7,994(R2) --> 8,035 --> 8,076 Pivot Point Supports at 7,929(S1) --> 7,912(S2) --> 7,872 --> 7,831 ATR Levels for Tomorrow: Buy Zone: From 7872 to 7897 Stop Loss for Longs: 7867 Sell Zone: From 7994 to 8019 Stop Loss for Shorts: 8024 Nifty Daily Analysis (source: www.NiftyTrader.in)
- 2. OI Support and Resistance: Nifty Daily Analysis (source: www.NiftyTrader.in) Date Support Pivot Resistance 2014-10-01 7781.91 7985.49 8189.08
- 3. Nifty Live Open Interest Tracker. Live PCR (Put Call Ratio) = 1.1117 (source: http://www.niftytrader.in/) Calls OI Puts OI 7300 7400 7500 7600 7700 7750 7800 7850 7900 7950 8000 8050 8100 8200 8300 8400 8500 8600 6,000,000 4,500,000 3,000,000 1,500,000 0 Strike Price Open Interest Nifty Open Interest (source: www.NiftyTrader.in)
- 4. Nifty OI Change Tracker (source: http://www.niftytrader.in/) Calls OI Change Puts OI Change 7300 7400 7500 7600 7700 7750 7800 7850 7900 7950 8000 8050 8100 8200 8300 8400 8500 8600 1,500,000 1,000,000 500,000 0 -500,000 Strike Price Open Interest Nifty Change in OI (source: www.NiftyTrader.in)
- 5. NSE Stock Price (source: www.NiftyTrader.in) SYMBOL LTP HIGH LOW PREVIOUS CLOSE CHANGE CHANGE % JUBLFOOD 1284.00 1291.90 1224.10 1223.00 61.00 4.99% BATAINDIA 1389.15 1409.90 1325.50 1329.05 60.10 4.52% WIPRO 615.00 617.65 598.10 596.65 18.35 3.08% INFY 3849.00 3859.95 3722.00 3750.30 98.70 2.63% M&M 1393.00 1396.00 1355.00 1359.20 33.80 2.49% UNITECH 19.25 19.60 18.45 18.80 0.45 2.39% SAIL 70.95 71.00 67.40 69.60 1.35 1.94% JSWSTEEL 1177.00 1184.65 1147.55 1155.40 21.60 1.87% ASHOKLEY 42.05 42.50 41.00 41.30 0.75 1.82% ABIRLANUVO 1647.50 1664.00 1620.50 1618.90 28.60 1.77% GODREJCP 993.50 1033.80 975.00 977.80 15.70 1.61% PFC 237.60 240.90 234.00 234.00 3.60 1.54% EXIDEIND 172.25 173.80 169.00 169.70 2.55 1.5% OFSS 3489.00 3533.00 3411.50 3439.00 50.00 1.45% UNIONBANK 190.90 193.40 185.35 188.20 2.70 1.43% TCS 2775.00 2802.00 2737.00 2736.95 38.05 1.39% HCLTECH 1740.00 1755.50 1713.35 1716.30 23.70 1.38% TECHM 2519.45 2540.50 2470.05 2485.70 33.75 1.36% VOLTAS 243.10 244.70 238.00 240.00 3.10 1.29% HEROMOTOCO 2871.00 2926.75 2851.50 2834.95 36.05 1.27% CANBK 354.50 357.80 346.35 350.10 4.40 1.26% M&MFIN 275.65 277.90 268.00 272.40 3.25 1.19% SUNTV 342.15 344.50 335.80 338.45 3.70 1.09% POWERGRID 136.50 138.00 134.70 135.20 1.30 0.96% PETRONET 190.65 193.25 186.50 188.90 1.75 0.93% RECLTD 250.75 253.70 248.35 248.45 2.30 0.93% BANKINDIA 233.05 237.35 226.50 231.05 2.00 0.87% ULTRACEMCO 2641.00 2660.00 2623.10 2620.50 20.50 0.78% INDIACEM 113.15 115.95 111.45 112.30 0.85 0.76% TATAMOTORS 506.15 507.40 499.25 502.70 3.45 0.69% COALINDIA 343.40 347.55 341.50 341.15 2.25 0.66% BIOCON 502.00 505.65 495.05 499.00 3.00 0.6% GMRINFRA 17.75 18.15 17.50 17.65 0.10 0.57% SUNPHARMA 860.75 865.40 849.45 856.00 4.75 0.55% RELINFRA 593.00 600.90 582.10 589.90 3.10 0.53% MOTHERSUMI 397.00 402.55 395.15 395.00 2.00 0.51% IDEA 166.60 171.35 166.00 165.80 0.80 0.48% NMDC 166.00 167.45 163.30 165.25 0.75 0.45% MCLEODRUSS 293.00 297.15 288.30 291.95 1.05 0.36% ORIENTBANK 229.40 233.35 225.05 228.70 0.70 0.31% ASIANPAINT 631.80 639.50 626.45 630.00 1.80 0.29% HINDPETRO 486.25 493.70 482.50 485.00 1.25 0.26% KOTAKBANK 1011.00 1014.70 1001.35 1008.70 2.30 0.23% RELCAPITAL 458.05 462.90 448.90 457.00 1.05 0.23%
- 6. NSE Stock Price (source: www.NiftyTrader.in) SIEMENS 824.50 837.00 815.35 823.10 1.40 0.17% PNB 883.00 888.00 870.00 881.70 1.30 0.15% UBL 711.00 717.90 700.00 710.00 1.00 0.14% AXISBANK 379.20 381.50 374.00 378.70 0.50 0.13% ARVIND 296.00 300.20 294.25 295.75 0.25 0.08% NTPC 139.15 140.40 138.50 139.10 0.05 0.04% NIFTY MIDCAP 3128.10 3147.00 3118.80 3127.50 0.60 0.02% 50 CESC 752.00 761.90 745.50 752.00 0.00 0% JUSTDIAL 1634.00 1646.00 1611.00 1634.00 0.00 0% BHEL 198.90 202.35 198.60 198.95 -0.05 -0.03% HINDZINC 159.95 162.40 158.00 160.00 -0.05 -0.03% DLF 150.20 152.70 149.30 150.30 -0.10 -0.07% YESBANK 556.55 563.60 552.55 557.00 -0.45 -0.08% UPL 339.25 341.95 334.60 339.60 -0.35 -0.1% CIPLA 625.20 631.40 621.10 625.95 -0.75 -0.12% BANKBARODA 898.50 907.95 882.60 899.75 -1.25 -0.14% INGVYSYABK 594.00 597.00 586.70 595.00 -1.00 -0.17% CONCOR 1352.00 1373.00 1342.05 1354.65 -2.65 -0.2% IGL 418.00 422.25 412.30 418.85 -0.85 -0.2% RANBAXY 638.00 647.35 631.50 639.35 -1.35 -0.21% AUROPHARMA 967.40 977.90 952.20 969.50 -2.10 -0.22% CNX NIFTY 7945.55 7977.50 7936.70 7964.80 -19.25 -0.24% IFCI 35.65 36.45 35.45 35.75 -0.10 -0.28% RPOWER 70.00 70.85 69.00 70.20 -0.20 -0.28% CROMPGREAV 199.85 203.85 199.20 200.45 -0.60 -0.3% ICICIBANK 1427.70 1443.00 1419.00 1432.15 -4.45 -0.31% ZEEL 312.90 317.25 309.55 314.00 -1.10 -0.35% TITAN 406.50 413.15 401.90 408.10 -1.60 -0.39% CNX NIFTY 16929.65 17120.25 16912.75 17003.85 -74.20 -0.44% JUNIOR TATAGLOBAL 158.70 162.00 158.40 159.40 -0.70 -0.44% LUPIN 1387.00 1402.00 1379.90 1393.30 -6.30 -0.45% BANK NIFTY 15316.20 15377.60 15270.95 15392.25 -76.05 -0.49% DRREDDY 3210.05 3277.00 3194.00 3226.20 -16.15 -0.5% BAJAJ-AUTO 2332.80 2371.35 2329.00 2345.00 -12.20 -0.52% HDFC 1048.05 1058.00 1040.00 1053.50 -5.45 -0.52% LT 1449.00 1467.90 1442.40 1457.00 -8.00 -0.55% IDBI 60.45 61.70 60.10 60.80 -0.35 -0.58% CUMMINSIND 670.00 678.60 666.15 673.95 -3.95 -0.59% COLPAL 1734.50 1769.00 1728.00 1744.95 -10.45 -0.6% DABUR 220.55 224.30 220.45 222.00 -1.45 -0.65% BAJAJFINSV 1122.05 1137.70 1120.00 1130.00 -7.95 -0.7% BOSCHLTD 14790.00 15050.00 14760.00 14900.00 -110.00 -0.74% SYNDIBANK 108.40 110.70 107.70 109.25 -0.85 -0.78% HDFCBANK 865.05 871.15 860.50 872.20 -7.15 -0.82% L&TFH 65.35 66.45 65.30 65.90 -0.55 -0.83%
- 7. NSE Stock Price (source: www.NiftyTrader.in) ADANIPORTS 276.00 283.35 272.50 278.50 -2.50 -0.9% HINDALCO 154.70 158.40 152.65 156.15 -1.45 -0.93% JISLJALEQS 80.05 82.40 79.60 80.80 -0.75 -0.93% SSLT 270.25 276.40 269.75 272.80 -2.55 -0.93% IDFC 135.95 139.35 135.10 137.30 -1.35 -0.98% ONGC 403.50 409.95 401.30 407.55 -4.05 -0.99% BAJAJHLDNG 1380.00 1412.95 1377.00 1394.00 -14.00 -1% BPCL 651.25 664.75 650.20 657.85 -6.60 -1% DIVISLAB 1784.00 1827.95 1783.15 1802.60 -18.60 -1.03% GRASIM 3500.00 3560.00 3476.15 3536.50 -36.50 -1.03% BHARTIARTL 402.10 407.40 401.70 406.40 -4.30 -1.06% SBIN 2416.95 2454.00 2412.20 2444.00 -27.05 -1.11% ANDHRABANK 64.55 65.55 64.05 65.30 -0.75 -1.15% GSKCONS 5580.00 5750.80 5501.00 5645.00 -65.00 -1.15% TATACHEM 395.00 404.15 394.00 400.00 -5.00 -1.25% ACC 1387.25 1414.95 1387.20 1405.00 -17.75 -1.26% AMBUJACEM 210.00 214.30 210.00 212.75 -2.75 -1.29% BHARATFORG 810.35 833.80 809.00 821.00 -10.65 -1.3% ADANIENT 465.00 477.65 455.20 471.15 -6.15 -1.31% KTKBANK 111.20 113.35 110.40 112.70 -1.50 -1.33% GLAXO 2790.30 2858.65 2781.70 2830.00 -39.70 -1.4% APOLLOHOSP 1114.00 1150.50 1103.10 1129.90 -15.90 -1.41% GLENMARK 707.00 733.50 695.00 717.30 -10.30 -1.44% JSWENERGY 69.35 71.15 68.75 70.40 -1.05 -1.49% NHPC 19.15 19.55 19.00 19.45 -0.30 -1.54% HAVELLS 259.90 266.00 258.00 264.30 -4.40 -1.66% LICHSGFIN 319.45 328.95 319.10 325.00 -5.55 -1.71% RELIANCE 927.25 945.60 926.00 944.00 -16.75 -1.77% ITC 364.35 370.00 363.35 371.00 -6.65 -1.79% ALBK 97.25 99.85 97.20 99.05 -1.80 -1.82% HINDUNILVR 734.25 748.75 733.55 748.00 -13.75 -1.84% GAIL 437.50 453.25 437.50 446.15 -8.65 -1.94% FEDERALBNK 123.30 126.50 123.00 125.80 -2.50 -1.99% RCOM 96.60 100.20 96.40 98.60 -2.00 -2.03% TATASTEEL 448.00 457.40 445.50 457.60 -9.60 -2.1% GODREJIND 299.50 309.70 299.00 306.00 -6.50 -2.12% CAIRN 304.45 313.45 303.20 311.30 -6.85 -2.2% TATAPOWER 81.00 83.40 80.30 83.00 -2.00 -2.41% SRTRANSFIN 911.00 936.40 905.00 936.95 -25.95 -2.77% INDUSINDBK 602.10 621.50 600.60 619.50 -17.40 -2.81% MARUTI 2971.00 3081.90 2961.15 3060.60 -89.60 -2.93% OIL 591.00 608.90 590.40 609.00 -18.00 -2.96% APOLLOTYRE 196.85 204.70 196.00 203.20 -6.35 -3.13% JINDALSTEL 168.40 174.40 165.10 174.10 -5.70 -3.27% MRF 31600.00 32900.05 31550.00 32747.00 -1147.00 -3.5%
- 8. NSE Stock Price (source: www.NiftyTrader.in) INFRATEL 277.50 300.00 275.25 303.00 -25.50 -8.42%
- 9. NSE Stock Volume (source: www.NiftyTrader.in) SYMBOL LTP HIGH LOW AVG DAILY VOLUME (lacs) TODAY VOLUME (lacs) Ratio (Today / Avg Volume) BATAINDIA 1389.15 1409.90 1325.50 1.51 4.31 2.85 MPHASIS 435.25 443.80 430.10 1.19 3.07 2.58 MCDOWELL-N 2404.90 2414.00 2340.00 6.22 13.04 2.1 HCLTECH 1740.00 1755.50 1713.35 7.94 16.09 2.03 WIPRO 615.00 617.65 598.10 15.19 28.00 1.84 ADANIPOWER 42.90 47.00 42.10 54.24 95.57 1.76 BAJAJHLDNG 1380.00 1412.95 1377.00 0.24 0.42 1.75 BANKINDIA 233.05 237.35 226.50 31.68 49.70 1.57 MARUTI 2971.00 3081.90 2961.15 3.28 5.14 1.57 TECHM 2519.45 2540.50 2470.05 4.12 6.39 1.55 INFRATEL 277.50 300.00 275.25 15.69 23.92 1.52 KOTAKBANK 1011.00 1014.70 1001.35 7.78 10.77 1.39 COLPAL 1734.50 1769.00 1728.00 1.67 2.30 1.38 ULTRACEMCO 2641.00 2660.00 2623.10 1.86 2.47 1.33 M&MFIN 275.65 277.90 268.00 14.29 18.47 1.29 ZEEL 312.90 317.25 309.55 23.88 30.42 1.27 OFSS 3489.00 3533.00 3411.50 0.69 0.87 1.26 GMRINFRA 17.75 18.15 17.50 276.44 337.46 1.22 ORIENTBANK 229.40 233.35 225.05 16.93 20.46 1.21 INFY 3849.00 3859.95 3722.00 9.83 11.84 1.21 SRTRANSFIN 911.00 936.40 905.00 5.77 6.99 1.21 TCS 2775.00 2802.00 2737.00 8.94 10.71 1.2 ALBK 97.25 99.85 97.20 34.83 39.68 1.14 HEROMOTOCO 2871.00 2926.75 2851.50 3.98 4.48 1.13 IDFC 135.95 139.35 135.10 66.57 73.96 1.11 NMDC 166.00 167.45 163.30 27.59 29.72 1.08 TATASTEEL 448.00 457.40 445.50 45.75 47.70 1.04 CAIRN 304.45 313.45 303.20 17.16 17.88 1.04 GODREJCP 993.50 1033.80 975.00 1.26 1.30 1.03 DIVISLAB 1784.00 1827.95 1783.15 1.82 1.87 1.03 DRREDDY 3210.05 3277.00 3194.00 3.16 3.20 1.01 SAIL 70.95 71.00 67.40 50.79 50.56 1 JUBLFOOD 1284.00 1291.90 1224.10 2.13 2.13 1 BHARTIARTL 402.10 407.40 401.70 42.39 41.84 0.99 JINDALSTEL 168.40 174.40 165.10 72.03 70.61 0.98 INDIACEM 113.15 115.95 111.45 28.65 27.82 0.97 COALINDIA 343.40 347.55 341.50 35.23 34.08 0.97 GLENMARK 707.00 733.50 695.00 7.46 7.18 0.96 RELCAPITAL 458.05 462.90 448.90 24.25 23.34 0.96 TATAPOWER 81.00 83.40 80.30 45.21 42.97 0.95 UNIONBANK 190.90 193.40 185.35 46.07 43.35 0.94 POWERGRID 136.50 138.00 134.70 47.68 44.57 0.93 JSWSTEEL 1177.00 1184.65 1147.55 5.25 4.78 0.91 GAIL 437.50 453.25 437.50 10.25 9.34 0.91
- 10. NSE Stock Volume (source: www.NiftyTrader.in) HINDALCO 154.70 158.40 152.65 95.57 87.03 0.91 AXISBANK 379.20 381.50 374.00 33.51 30.24 0.9 BANKBARODA 898.50 907.95 882.60 10.68 9.56 0.9 ICICIBANK 1427.70 1443.00 1419.00 21.99 19.59 0.89 ASHOKLEY 42.05 42.50 41.00 170.46 150.10 0.88 BAJAJFINSV 1122.05 1137.70 1120.00 0.62 0.54 0.87 CNX NIFTY 7945.55 7977.50 7936.70 1,323.92 1,129.99 0.85 RELINFRA 593.00 600.90 582.10 18.95 16.10 0.85 AUROPHARMA 967.40 977.90 952.20 20.45 17.11 0.84 HINDPETRO 486.25 493.70 482.50 17.62 14.82 0.84 SUNPHARMA 860.75 865.40 849.45 31.09 26.24 0.84 RPOWER 70.00 70.85 69.00 53.26 44.43 0.83 BANK NIFTY 15316.20 15377.60 15270.95 250.40 206.68 0.83 IDBI 60.45 61.70 60.10 29.92 24.42 0.82 UNITECH 19.25 19.60 18.45 668.65 543.68 0.81 NIFTY MIDCAP 3128.10 3147.00 3118.80 2,279.22 1,829.21 0.8 50 IFCI 35.65 36.45 35.45 82.43 64.77 0.79 LICHSGFIN 319.45 328.95 319.10 22.69 17.89 0.79 MRF 31600.00 32900.05 31550.00 0.23 0.18 0.78 HDFCBANK 865.05 871.15 860.50 18.71 14.68 0.78 ARVIND 296.00 300.20 294.25 36.19 27.80 0.77 PFC 237.60 240.90 234.00 28.03 21.47 0.77 APOLLOHOSP 1114.00 1150.50 1103.10 1.60 1.22 0.76 SSLT 270.25 276.40 269.75 50.06 37.36 0.75 NTPC 139.15 140.40 138.50 66.86 49.88 0.75 INDUSINDBK 602.10 621.50 600.60 8.13 6.02 0.74 M&M 1393.00 1396.00 1355.00 9.48 7.00 0.74 LT 1449.00 1467.90 1442.40 15.46 11.31 0.73 GODREJIND 299.50 309.70 299.00 5.09 3.64 0.72 CNX NIFTY 16929.65 17120.25 16912.75 881.24 632.19 0.72 JUNIOR BHEL 198.90 202.35 198.60 49.86 35.19 0.71 LUPIN 1387.00 1402.00 1379.90 4.83 3.37 0.7 PNB 883.00 888.00 870.00 9.40 6.60 0.7 AMBUJACEM 210.00 214.30 210.00 23.72 16.39 0.69 CANBK 354.50 357.80 346.35 21.20 14.62 0.69 DLF 150.20 152.70 149.30 84.49 57.63 0.68 GSKCONS 5580.00 5750.80 5501.00 0.16 0.11 0.67 TITAN 406.50 413.15 401.90 9.97 6.65 0.67 SUNTV 342.15 344.50 335.80 9.91 6.64 0.67 BPCL 651.25 664.75 650.20 13.47 8.70 0.65 JISLJALEQS 80.05 82.40 79.60 37.61 24.39 0.65 ADANIENT 465.00 477.65 455.20 18.45 12.04 0.65 KTKBANK 111.20 113.35 110.40 17.77 11.40 0.64 ONGC 403.50 409.95 401.30 41.36 26.37 0.64 ADANIPORTS 276.00 283.35 272.50 30.06 19.38 0.64
- 11. NSE Stock Volume (source: www.NiftyTrader.in) RANBAXY 638.00 647.35 631.50 11.65 7.44 0.64 RELIANCE 927.25 945.60 926.00 31.10 19.79 0.64 ACC 1387.25 1414.95 1387.20 3.42 2.14 0.63 EXIDEIND 172.25 173.80 169.00 28.23 17.49 0.62 SBIN 2416.95 2454.00 2412.20 17.14 10.54 0.62 ABIRLANUVO 1647.50 1664.00 1620.50 2.75 1.66 0.6 APOLLOTYRE 196.85 204.70 196.00 72.14 42.96 0.6 VOLTAS 243.10 244.70 238.00 33.34 19.88 0.6 PETRONET 190.65 193.25 186.50 18.12 10.83 0.6 OIL 591.00 608.90 590.40 4.17 2.50 0.6 MCLEODRUSS 293.00 297.15 288.30 3.11 1.82 0.59 HINDZINC 159.95 162.40 158.00 11.57 6.77 0.59 TATAMOTORS 506.15 507.40 499.25 62.09 36.87 0.59 L&TFH 65.35 66.45 65.30 24.89 14.49 0.58 FEDERALBNK 123.30 126.50 123.00 41.09 23.74 0.58 SYNDIBANK 108.40 110.70 107.70 27.75 16.10 0.58 GRASIM 3500.00 3560.00 3476.15 0.81 0.47 0.58 ANDHRABANK 64.55 65.55 64.05 40.00 22.86 0.57 BAJAJ-AUTO 2332.80 2371.35 2329.00 2.51 1.40 0.56 HDFC 1048.05 1058.00 1040.00 25.75 14.40 0.56 RCOM 96.60 100.20 96.40 67.96 37.65 0.55 GLAXO 2790.30 2858.65 2781.70 0.35 0.19 0.54 HINDUNILVR 734.25 748.75 733.55 8.88 4.78 0.54 NHPC 19.15 19.55 19.00 64.84 34.59 0.53 IDEA 166.60 171.35 166.00 72.30 38.42 0.53 RECLTD 250.75 253.70 248.35 20.33 10.79 0.53 IGL 418.00 422.25 412.30 6.54 3.39 0.52 DABUR 220.55 224.30 220.45 16.67 8.70 0.52 JUSTDIAL 1634.00 1646.00 1611.00 1.58 0.77 0.49 ASIANPAINT 631.80 639.50 626.45 12.04 5.80 0.48 UBL 711.00 717.90 700.00 0.99 0.46 0.47 ITC 364.35 370.00 363.35 56.28 26.26 0.47 CIPLA 625.20 631.40 621.10 26.68 12.20 0.46 BIOCON 502.00 505.65 495.05 11.57 5.32 0.46 MOTHERSUMI 397.00 402.55 395.15 26.27 11.24 0.43 CROMPGREAV 199.85 203.85 199.20 44.78 18.67 0.42 CESC 752.00 761.90 745.50 5.22 2.21 0.42 BHARATFORG 810.35 833.80 809.00 10.76 4.45 0.41 SIEMENS 824.50 837.00 815.35 3.71 1.44 0.39 TATAGLOBAL 158.70 162.00 158.40 31.08 11.98 0.39 YESBANK 556.55 563.60 552.55 28.21 10.62 0.38 JSWENERGY 69.35 71.15 68.75 21.24 7.91 0.37 UPL 339.25 341.95 334.60 15.48 5.42 0.35 TATACHEM 395.00 404.15 394.00 6.89 2.38 0.35 HAVELLS 259.90 266.00 258.00 18.62 6.19 0.33
- 12. NSE Stock Volume (source: www.NiftyTrader.in) BOSCHLTD 14790.00 15050.00 14760.00 0.10 0.03 0.3 CONCOR 1352.00 1373.00 1342.05 0.99 0.22 0.22 INGVYSYABK 594.00 597.00 586.70 1.33 0.24 0.18 CUMMINSIND 670.00 678.60 666.15 2.07 0.30 0.15