Kodo Millet PPT made by Ghanshyam bairwa college of Agriculture kumher bhara...
Lee morrisono learytm2006economicvalueportfoliomatrix
1. ARTICLE IN PRESS
Tourism Management 27 (2006) 576–588
www.elsevier.com/locate/tourman
The economic value portfolio matrix: A target market selection tool
for destination marketing organizations
Gyehee Leea,Ã, Alastair M. Morrisonb, Joseph T. O’Learyc
a
Department of Tourism Management, College of Business, Keimyung University, 1000 Shindang-dong, Dalseogu, Daegu 704-701, Korea
b
Department of Hospitality & Tourism Management, Purdue University, Room 111A, Stone Hall, 700 W. State Street, West Lafayette,
IN 47907-2059, USA
c
Department of Recreation, Park & Tourism Sciences, Texas A & M University, 2261 TAMU, College Station, TX 77843-2261, USA
Received 19 January 2005; accepted 18 February 2005
Abstract
The main goal of the study was to propose a practical evaluation tool for destination marketers to evaluate travel market
segments in terms of the expected economic return on each identified segment. An Economic Value Portfolio Matrix based on the
Stay-Spend Index (SSI) and market share was developed. French travelers to Canada were segmented based on benefits sought.
Benefit segmentation has been extensively used in travel research in the past 20 years and has helped us better understand the
dynamic global tourism market. The results showed that the Economic Value Portfolio Matrix approach may be a useful quantifiable
and objective evaluation tool for destination marketing organizations and that benefits sought clearly differentiated the French long-
haul pleasure travel market.
r 2005 Elsevier Ltd. All rights reserved.
Keywords: Benefit segment; French travellers; Economic value portfolio; Market segmentation; Stay-spend index (SSI)
1. Background (excluding US residents), the French market ranked
number three after the UK and Japan, with an average
French travelers represent the world’s third largest annual growth rate above 3.0% (World Tourism
tourism-generating market in absolute terms, after only Organization (WTO), 2000). The growth rate among
Germany and the United Kingdom (UK), recording 23 French outbound travelers was in the double digits
million international departures in 1999, about 65% of throughout the early 1990s, but began to rapidly
which were for pleasure travel (World Tourism Orga- decrease late in the decade (Canadian Tourism Commis-
nization (WTO), 2000). Despite the significant volume sion (CTC), 2002). In response to the situation,
generated by French travelers in international tourism PriceWaterhouseCoopers (PWC) was hired by the
to all destinations, there is limited research on this CTC to study the French market to discover the reasons
market, with a few exceptions (Sussmann & Rashcov- behind this decline and to better understand how to
sky, 1997; Richardson & Crompton, 1988; Qiu & recapture the double-digit growth. A survey conducted
Zhang, 1995). in 1998 by PWC, on behalf of CTC (1999), divided the
The French market is of great importance to the French long-haul pleasure travel market four ways, by
Canadian tourism industry. Among overseas travelers socio-demographics, activities, motivational segments,
and travel arrangements. Although much was gleaned
ÃCorresponding author. Tel.: +82 53 580 6401; fax: +82 53 6364. from this study, it did not offer a sufficiently quantita-
E-mail addresses: ghlee@kmu.ac.kr (G. Lee), alastair@cfs.pur- tive measure for identifying which of the pleasure
due.edu (A.M. Morrison), joleary@rpts.tamu.edu (J.T. O’Leary). market segments were the most profitable to pursue.
0261-5177/$ - see front matter r 2005 Elsevier Ltd. All rights reserved.
doi:10.1016/j.tourman.2005.02.002
2. ARTICLE IN PRESS
G. Lee et al. / Tourism Management 27 (2006) 576–588 577
Hence, the strategy to recapture the market was not dates back further to 1968 when Haley (1968) developed
fully identified. The demand for more effective tools to the technique as a method of predicting customers’
select the most profitable target segment is urgent. These purchasing behavior more effectively than did tradi-
tools should help destination marketers to identify the tional segmentation methods, which tended to use
segments that produce the highest return on dollars consumers’ demographic, socio-economic, or geo-
invested, and to focus on key marketing strategies with graphic characteristics. Haley argued that purchasing
respect to reaching and communicating with target behavior was mostly directed by the benefits sought in
markets and providing services and facilities demanded the product, and therefore that ‘‘benefits which people
by the markets. are seeking in consuming a given product are the basic
reasons for the existence of true market segments’’
(Haley, 1968, p. 31). More recently, Haley (1999)
2. Study goal and objectives suggested that the new era of mass customization and
the increase in the variety of promotional supports has
This study attempted to fill this gap with a method increased the necessity and usefulness of the benefit
called the Economic Value Portfolio Matrix, which segmentation approach to meet the increasingly diversi-
estimates profit-generating efficiency based on length fied customer demand. Focusing specifically on travel
of stay factored into total expenditure per person, and tourism marketing, Frochot and Morrison (2000)
known as the Stay-Spend Index (SSI). Applying benefits concluded that benefit segmentation is most helpful in
sought by French travelers to Canada as a segmentation designing and modifying facilities and attractions,
basis, this study aimed to provide Canadian DMOs and vacation packaging, activity programming, and service
other destination marketers with a useful tool for the quality measurement.
assessment of the economic value of market segments so
that they can be quantified and objectively evaluated in 3.2. Benefit segmentation in tourism
terms of profitability.
The following three specific research objectives were The research on benefits sought seems to have
identified: developed in three directions in the field of tourism.
First, tourism researchers considered the possibility of
(1) To develop a market segmentation approach based using benefits to explain decision-making processes in
on French travelers to Canada in terms of their relation to destination marketing (Woodside & Pitts,
benefits sought. 1976), consumer preferences for destination attributes
(2) To incorporate key trip related behaviors, including (Ryan & Glendon, 1998), and travel planning time
travel mode, satisfaction, revisit intention, and (Schul & Crompton, 1983). Vacation behaviors such as
vacation activities, with benefit sought. destination choice, length of stay, and activities pursued
(3) To evaluate the value of each segment in terms of were linked to the benefits that tourists seek (Gitelson &
profitability using the Economic Value Portfolio Kerstetter, 1990; Moscardo, Morrison, Pearce, Lang, &
Matrix and to recommend the most viable segments O’Leary, 1996). These studies identified benefits as
for Canadian tourism. a key factor in tourist decision-making, thus providing
knowledge critical to strategies for targeting markets.
One of the earliest applications was by Goodrich (1977,
1980), who conducted an extensive study of American
3. Literature review Express travelers based on destinations’ attributes,
including both destination-based attributes and psycho-
3.1. Background of benefit segmentation logical benefits. Goodrich’s study showed that the
market could successfully be divided into three
Travel researchers have excelled in the study of segments, passive-entertainment, sports, and out-
destinations, and market segmentation analyses have door, leading to recommendations in terms of advertis-
been especially powerful in identifying segments deser- ing, travel brochures, and packaged tours for each
ving different levels of marketing treatment and devel- segment.
oping strategies to target the identified markets. They Showing the usefulness of benefit segmentation for
have made extensive use of various segmentation tools; destination marketing, Gitelson and Kerstetter (1990)
both a priori segmentation approaches, such as trip examined the relationship between socio-demographic
purpose, demographic, and geographic segmentation, variables, benefits sought, and subsequent behavior.
and a posteriori segmentation, including the psycho- They identified four benefits sought by North Carolina
graphic, behavioral, and benefit segmentation techni- visitors: relaxation, excitement, social opportunities, and
ques. In tourism research, benefit segmentation has been exploration. They also found that each benefit segment
employed for just over 20 years. Its origin, however, showed distinctive behavioral patterns in terms of trip
3. ARTICLE IN PRESS
578 G. Lee et al. / Tourism Management 27 (2006) 576–588
party, length of stay, activity participation, and season taken in settings to gain experiences that are regarded as
of visit, while there were mixed results for socio- beneficial.
demographic variables. In their study of Canadian, US These studies underscore how important it is to
and Japanese travelers to Hawaii, Woodside and Jacobs understand the benefits sought by travelers for an
(1985) suggested that benefit segmentation could be effective market segmentation strategy in tourism. The
effectively used for designing advertising messages and complexity of these studies and the practicality of the
packages, and improving tourism facilities, beyond just information gleaned from them have greatly increased
dividing and describing existing markets. over time, yet those studies lack the ability to quantify
The second focus in benefit studies has been on the most profitable segments and this remains the
differentiating specific travel markets and facilitating primary weakness of the benefit segmentation approach.
marketing strategy development, including advertising Hence, the third concern of researchers is the issue of
campaigns, designing, packaging and distributing pro- how to select the most profitable segments.
ducts, and evaluating satisfaction. For example,
Shoemaker (1994) illustrated the usefulness of using 3.3. Benefit segment evaluation criteria
benefit segmentation for the senior travel market,
and Andereck, Caldwell, and Debbage (1991) applied Kotler and Armstrong (2003, pp. 250–251) suggested
benefit segmentation to zoo visitors. Similarly, Tian, that market segments should meet five selection criteria
Crompton, and Witt (1996) applied the technique to to be viable. They need to be: (1) measurable, (2)
museum patrons, and McCool and Reilly (1993) used it accessible, (3) sustainable, (4) differentiable, and (5)
for state park visitors. These research studies indicated actionable. In addition to Kotler and Armstrong’s list,
that benefit segments merit separate marketing treat- Morrison (2002) added five more criteria for effective
ment. segmentation; homogeneity, defensibility, competitive-
Davies and Prentice (1995) argued that benefit ness, durability, and compatibility. These theoretically
segmentation, which distinguishes homogeneous sub- fundamental criteria provide marketers with useful
groups of potential customers by their wants and needs guidelines for targeting markets; however, they lack
within a heterogeneous market, is a key to potential measurability by not clearly operationalizing quantifi-
market development by attractions. Benefit segmenta- able and objective measures for each criterion. An
tion guides message differentiation, capitalizing on a additional disadvantage is they do not incorporate the
deep understanding of markets, and makes it possible to most important quality of a segment as a target market,
reach the target market. Benefit segmentation thereby namely profitability.
potentially enables managers to fine-tune their products. Recently, tourism researchers have tried to identify
The identification of such intrinsic-terminal benefits or comprehensive and objective evaluation criteria for
experiences sought from tourism and leisure offers the selecting the best possible target markets. However, to
potential of redefining or re-promoting tourism pro- date only a limited number of such studies are
ducts to meet these motivations, and converting demand to be found in the tourism and hospitality literature
into actual needs. (McQueen & Miller, 1985; Loker & Perdue, 1992;
Investigating European business travelers, Mason and Kastenholz, Davis, & Paul, 1999; Jang, Morrison, &
Gray (1996) stated that customers seek benefits from the O’Leary, 2000). Furthermore, limited attention has been
product that relate to both personal and organizational given to the evaluation of the economic value of a
objectives, and used a benefit segmentation model to segment as a key selection criterion for benefit segments.
create a marketing strategy for the short-haul European Once benefit segments are defined, marketers do not
business travel market. In their model, the market was currently have an effective tool to determine which
segmented based on the benefits sought from the segments they should pursue to maximize the return on
product, using a stakeholder model of organizational marketing dollars spent targeting these markets.
decision processes. This approach drew on the advan-
tages of the two most appropriate segmentation bases 3.4. Target market profitability
available: benefit and buyer center segmentation. Going
further by distinguishing subgroups within a given It is clearly counter-intuitive to market to a target
market, Prentice, Witt, and Hamer (1998) focused on group without any consideration of how much revenue
the premise that the core product of tourism is the the target market can generate. Bock and Uncles (2002)
beneficial experiences gained. Their benefits-based man- suggested that, when preparing a segmentation strategy,
agement approach described these experience-based profitability must be considered as one of the main
management outputs more explicitly as improved selection criteria. Where one customer segment provides
conditions. Inherent in such an approach is the benefit greater profit to an organization than another, or where
chain of causality, linking activities, setting, experiences, there is potential for this, profitability exists in that
and benefits in a sequence. Here activities are under- customer segment. Consequently, the profitability of
4. ARTICLE IN PRESS
G. Lee et al. / Tourism Management 27 (2006) 576–588 579
potential segmentation provides a way to determine the 4. Methodology
value of future research for understanding differences
among customers. Here, the profitability of the segments 4.1. Data source
in a given market should be a cornerstone upon which
marketing strategies should be laid, provided that these The data used in the current study were gathered
segments also meet other prerequisites such as accessi- under the program called the Pleasure Travel Market
bility, substantiality, and actionability. Study to North America surveys (PTAMS), which was
There are a few marketing research examples that developed jointly by the International Trade Adminis-
address the profitability issue as a key basis for target tration—Tourism Industries (formerly the United States
market selection. For example, McQueen and Miller Travel and Tourism Administration) and the Canadian
(1985) recommended the assessment of market attrac- Tourism Commission (formerly Tourism Canada),
tiveness based upon profitability, viability, and accessi- under a Memorandum of Understanding (MOU) in
bility. Similarly, Loker and Perdue (1992) proposed a 1986, for 5 years of cooperative research, which was
systematic approach to evaluating segments using a renewed in 1991 for an additional 5 years. These
ranking procedure. They assessed segment attractiveness national household surveys on long-haul travel provide
in terms of profitability, accessibility, and reachability information on the size of potential markets, travel
by ranking each segment on its relative performance on benefits sought, travel philosophies, expenditures, per-
the three evaluation criteria. Profitability was measured ceived strengths and weaknesses of North American
by the percentages of total expenditure related to the destinations, media habits of potential travelers, and
percentage of respondents, percentage of person-nights, socio-demographics. The samples were representative of
and average expenditures per person-night. Kastenholz all households with listed telephone numbers according
et al. (1999) conducted a study of rural tourism in to stratified probability samples. Prior to in-home
Portugal using a composite index of segment attractive- interviewing, telephone-screening interviews were con-
ness from a revenue-generating perspective. Even ducted to indicate the size of the target market within
though these studies suggested profitability as a key the total population and to determine whether respon-
segment selection criterion, the measures were weak dents were eligible for in-home interviews.
with respect to comprehensiveness and objectivity. Approximately 1200 personal in-home interviews
These criteria were applied rather subjectively due to a averaging 50 min in length were conducted in France
lack of objective and quantifiable measures for each in 1998 among those who were 18 years or older and had
criterion. The measures of reachability and accessibility taken a vacation trip of four nights or longer outside
were especially subjective. Addressing this issue, Jang et Europe and the Mediterranean area in the previous 3
al. (2000) incorporated the profitability and risk years or intended to take such a trip in the next 2 years.
concepts in evaluating segment attractiveness as more In selecting the interviewees, the closest birthday
quantifiable and comprehensive profitability measures. method was employed. The sample for this study
The usefulness and viability of benefit segmentation in consisted of 307 respondents from French households
tourism are well supported (Gitelson & Kerstetter, 1990; where members had traveled to Canada for pleasure
Loker & Perdue, 1992; Moscardo et al., 1996; Jang et purposes in the previous 3 years.
al., 2000). Benefit segmentation as an approach to
understanding and developing segment structures is 4.2. Data analysis and construction of the economic value
demonstrably superior to traditional methods such as portfolio matrix
demographic and geographic segmentation. However,
once benefit segments are developed, marketers do not Five analytical steps were followed in this study
have an effective tool to determine which segments (Table 1). In segmenting the French market to Canada,
they need to pursue in order to maximize profit and the benefits sought in terms of both psychological
return on their marketing dollars spent for targeting benefits and destination attributes were used as the
those segments. A simple and effective tool to segmentation base characteristics. In the first step, 39
evaluate the effectiveness of benefit segments as a final benefit sought items by individual respondents measured
step in segmentation is much needed. The three-stage on a four-point rating scale were factor analyzed to
approach to segmentation suggested by Morrison, derive the underlying construct of the benefit dimensions
Hsieh, and O’Leary (1994) was to divide, differentiate, and to condense the data for ease of interpretation
and describe segments; the current study goes (Table 2). These factors were then used for a cluster
further still in providing a functional model of the analysis of 307 respondents in the second step of the
benefit segment market, which enables destination analysis.
marketers to accurately target the most valuable sub- For the cluster analysis, first, Ward’s method was used
groups based on their expected economic returns at to determine the optimal number of clusters based on
relatively low costs. three criteria (the cubic clustering criterion (CCC), the
5. ARTICLE IN PRESS
580 G. Lee et al. / Tourism Management 27 (2006) 576–588
Table 1
Analytical steps and methods
Analytical Analytical method
steps
Step 1: Develop a benefit scale: Factor analysis of benefit items
Step 2: Divide the market into segments: Cluster analysis (Ward’s and K-means techniques) of the cases based on benefit sought factors
Step 3: Describe and test heterogeneity of segments: ANOVA and Chi-square tests for comparisons across clusters in terms of demographic
characteristics and trip behaviors
Step 4: Develop profit criteria: Economic Value Portfolio Matrix based on Stay-Spend Index (SSI)
Step 5: Evaluate and select target markets: Economic value evaluation of each benefit sought cluster based on the market mix of SSI
pseudo F statistic, and the pseudo t2 statistic). In further most efficiently for DMOs, with their Total Exp PPPD
fine-tuning the clusters, a K-means cluster analysis was being much higher than that of any other SSI group and
applied based on the cluster solution from Ward’s the costs to service them relatively low due to their short
minimum variance method. Even though Ward’s cluster- stays at the destination. Efficiency in generating profit
ing method has been credited with being the most can be achieved when visitors spend intensely with a
popular technique, outlying cases may distort the high level of spending propensity within relatively short
solution (Hair, Anderson, Tatham, & Black, 1995). A trip durations at minimum service costs to a destination.
non-hierarchical method is resistant to outliers; however, For example, if a traveler A stays at a destination for 20
this technique has the drawback that an a priori decision days he may reduce his daily expenses over this rather
on the exact number of clusters must be made by the lengthy trip duration, while consuming travel infra-
researcher (Hair et al., 1995). Therefore, it is desirable to structure and municipal services, which are not necessa-
combine these two clustering techniques to obtain more rily directly paid for by this traveler. Meanwhile,
reliable cluster solutions. traveler B stays in a destination for 15 days but she
After identifying clusters, the cluster pattern was cross may spend her travel expenses more intensely, and
validated using the Analysis of Variance (ANOVA) consume less traveler service/support services than
procedure. Further, in order to incorporate key trip traveler A. However, the final determination of the
related behaviors (e.g., travel mode, satisfaction, revisit value of the priority market when compared to the
intention, expenditure patterns, and vacation activities) favorable market largely depends on the situation and
with benefit sought, an in-depth analysis was conducted strategy of the individual destination marketing organi-
applying ANOVA and w2 tests (see Table 1). zation.
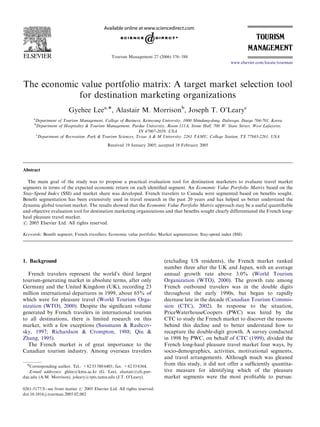
In the final analytical step, the economic value of each In general, travelers in low-value markets tend
benefit cluster was evaluated by means of the Economic to spend much less than average and also take
Value Portfolio Matrix. The EVPM was comprised of shorter trips. Therefore, they generate smaller yield
four quadrants, each of which indicated a stay-spend and Total Exp. PPPD. Back-ups spend less but
index (SSI), a combination of the two factors most stay longer, and thus generate a good yield but with
relevant to estimating the clusters’ profitability to a lower efficiency. Favorable markets usually have the
tourism destination, namely trip expenditures per highest levels of yield, and their revenue efficiency is
person per day (Exp. PPPD) and average length of relatively good. In this way, the Economic Value
stay. By applying the median value of each variable Portfolio can be developed for each identified benefit
(e.g., median expenditure PPPD: 714.28FF and 12 days segment.
for length of stay), the Economic Value Portfolio Matrix The value of each benefit cluster was then assessed by
was created (Fig. 1). Utilizing the median instead of its Economic Value Portfolio and market size. For
mean was appropriate because the distribution of those example, if a cluster included more of the priority
variables was not normal. Thus, the SSI generated four market, then the economic value of the cluster was
categories: low Total Exp. PPPD and short length of evaluated as high. Most of the previous studies
stay group (coded as 1), low Total Exp. PPPD and long compared the aggregated mean value of each variable
stay group (coded as 2), high Total Exp. PPPD and per benefit segment instead of analyzing the structure of
short stay group (coded as 3), and high Total Exp. the segment. The portfolio approach has two major
PPPD and long stay group of travelers (coded as 4). benefits. First, this approach enables destination mar-
Thus, the respondents in all clusters were assigned an keters to analyze the actual economic value profile of
SSI index score. each segment. Second, it helps them avoid misunder-
The respondents coded as ‘‘3’’ comprised the priority standing the true profitability of each segment. It is not
market, since these travelers generated tourism revenues unusual for destination marketers to evaluate the
6. ARTICLE IN PRESS
G. Lee et al. / Tourism Management 27 (2006) 576–588 581
Table 2
Factor analysis of benefits sought by french long-haul pleasure travelers to Canada
Factors and Items (% of total variance explained by each factor) Loading Eigenvalue Reliability alpha
Factor 1: Convenience and deal seeking (31.4%) 3.864 0.8474
Taking advantage of the currency exchange rate 0.730
The best deal I could get 0.711
Good public transportation 0.569
Availability of comprehensive tourist information 0.544
Destination that provides value for my holiday money 0.508
Convenience and frequency of flights to the destination 0.471
Visiting a place I can talk about when I get back home 0.430
Factor 2: Novelty seeking (5.64%) 3.324 0.8246
Going place I have not visited before 0.740
Opportunity to increase one’s knowledge about places, people and things 0.710
Historical buildings and sites 0.630
Interesting rural countryside 0.605
Factor 3: Seeking escape (5.12%) 3.142 0.7988
Getting away from the demands of home 0.725
Getting a change from a busy job 0.679
Escape from the ordinary 0.678
Having fun being entertained 0.582
Finding thrills and excitement 0.565
Factor 4: Seeking environmental quality and safety (4.87%) 3.047 0.8339
Environmental quality and air, water, and soil 0.808
High standards of hygiene and cleanliness 0.723
Personal safety even when traveling alone 0.676
Nice weather 0.449
Outstanding scenery 0.422
Factor 5: Seeking differences (4.14%) 2.916 0.8066
Experiencing a new and different lifestyle 0.674
See people from different ethnic backgrounds 0.647
Opportunity to see or experience unique aboriginal groups 0.602
Trying new foods 0.543
Meeting new and different people 0.527
Factor 6: Roughing it and coping (3.62%) 2.814
Roughing it/wilderness and adventure 0.773
Ease of driving on my own in the destination 0.624
Outdoor activities such as hiking, climbing, 0.573
Being able to practice a foreign language 0.528
Factor 7: Shopping and art/culture (3.22%) 2.032 0.6205
Shopping 0.669
Arts and cultural attractions 0.539
Indulging in luxury 0.504
Just relax 0.493
Factor 8: Seeking activities for the entire family (2.79%) 2.015 0.7924
Activities for the entire family 0.841
Being together as a family 0.823
Factor 9: Visiting friends and relatives (2.67%) 1.608 À0.0284
Visiting friends and relatives À0.695
Visits to appreciate natural ecological sites 0.444
Note: Extraction method: Principal Components Analysis. Rotation method: Varimax with Kaiser Normalization. Total variance explained: 63.5%.
Cronbach’s a for the overall scale: 0.938.
economic value of segments simply by the arithmetic simple matrix provides a very useful tool for market
mean of each segment’s total travel expenditures, which value assessment and gives marketers a clear direction
may mislead them into an inappropriate marketing for effective budgeting of marketing dollars and
budget allocation or ineffective advertising efforts. This strategic market targeting.
7. ARTICLE IN PRESS
582 G. Lee et al. / Tourism Management 27 (2006) 576–588
Average Length of Stay Average Length of Stay that they sought from a trip to Canada. Finally, Cluster
Short Long 4 comprised those who sought opportunities for rough-
Total Expenditure *PPPD: ing it and coping (factor 5). They also rated factor 2
High Priority market Favorable market (novelty seeking) relatively high. One of the initial
clusters was eliminated from the further analysis due to
Total Expenditure PPPD:
Low Low value market Back-ups the small number of cases it contained (n ¼ 25). The
respondents in this cluster rated low on all benefit
Fig. 1. Economic value portfolio matrix based on the stay-spend index
sought factors. Therefore, the remaining analyses were
(SSI) *PPPD ¼ Per person per day. based on four clusters (Table 3).
5.2. Tests for group differences
5. Results
The next step of the analysis was to investigate if these
5.1. Factor-cluster analysis: defining benefit sought clusters had significantly different socio-demographic
market segments and behavioral characteristics applying w2 analysis and
ANOVA procedure. There were statistically significant
Nine factors were derived using a principal compo- differences across clusters in terms of age, occupation,
nents method for initial factor extraction; a Varimax education, and marital status. Cluster 2 contained the
rotation was then applied. An Eigenvalue criterion oldest travelers (53 years), while the youngest group
(factors with an Eigenvalue of greater than 1.0) was used among the four clusters was Cluster 3, with an average
in determining the number of factors. It appeared that age of approximately 38 years. There seemed to be more
the factors fell into two broad categories: psychological female than male travelers to Canada; in particular
benefit factors, including novelty, escape, seeking Clusters 1 and 2 had more females than males, being
differences, and roughing it and coping; and factors composed of 62.2% and 63.0% women respectively. The
derived from destination attributes, such as environ- majority of French travelers to Canada had monthly
mental quality and safety, convenience and deals, household incomes between 13,000FF and 15,999FF.
shopping and art/cultural experiences, activities for the Cluster 1 was the highest income group (almost 68%
entire family, and visiting friends and relatives. Overall, had either middle or high income levels) and Cluster 2
the scale had a high level of internal consistency, the lowest (64.7% were in the lowest income range). The
showing a reliability a of 0.94. Most of the factors, other two clusters, 3 and 4, showed similar income
except for factor 7, had relatively high reliability, above distributions. More than half of each of Clusters 1, 2
or close to 0.8. The nine factors explained 63.5% of the and 3 were employed in white-collar administrative or
total variance. The last factor, namely VFR, was managerial fields. However, the second largest occupa-
excluded from further analysis due to low reliability tional group was non-working class (i.e., housewives,
(Table 2). retired, students, and other); in particular, the majority
Based on the eight benefit sought factors, the of Cluster 2 (61%) belonged to this category. The levels
respondents clustered into five distinctive groups when of education appeared to be correlated with age. The
analyzed by Ward’s and K-means cluster analyses. The youngest cluster (Cluster 3) were better educated than
first cluster was the family oriented (n ¼ 98, 32% of the the other clusters (52% had a college or university
respondents), which had the highest rating on factor 1 education), and especially contrasted with Cluster 2, the
(convenience and deal seeking) and also rated high on oldest group (of which 22.7% had only primary
shopping and art/culture (factor 7) and seeking escape education). Overall, the majority of French travelers to
(factor 3). The family oriented group was the most Canada had either a high school or college education.
different from Cluster 4 (roughing it and coping).
Cluster 2 (n ¼ 46, 15%), the environmental quality 5.3. Behavioral difference among benefit segments
conscious group, gave the highest importance ratings to
environmental quality, personal safety, weather, and AVOVA and w2 tests were applied to the group
outstanding scenery (factor 4). They also ranked the difference among cluster. There was a significant
highest on factor 5 (seeking differences), and were difference (p ¼ 0:000) across the four clusters in terms
relatively high on factors 2 (novelty seeking) and factor of travel arrangements. The French tourists were
1 (convenience and deal seeking). The Cluster 2 categorized based on travel mode (package vs. non-
respondents were markedly different from those in package) and duration and frequency of trips. This
Cluster 3, the culture and luxury indulgent. Cluster 3 yielded three travel arrangement groups: package
(n ¼ 71, 23%) showed the highest interest in shopping travelers, long-stay independent travelers, and frequent
and art and cultural experiences (factor 7), and also short-stay independent travelers. There were relatively
considered novelty (factor 2) to be an important benefit more package travelers in Clusters 1 and 2 (53.1% and
8. ARTICLE IN PRESS
G. Lee et al. / Tourism Management 27 (2006) 576–588 583
Table 3
Benefits sought segments of French long-haul pleasure travelers to Canada
Benefit sought variables Cluster 1: Cluster 2: Cluster 3: Cluster 4: *Test statistic
family environment culture & roughing it
oriented & safety luxury and coping
conscious indulgent
(n ¼ 98, 32%) (n ¼ 46, 15%) (n ¼ 71; 23%) (n ¼ 67, 22%) (F test)
Factor 1: Convenience and deal seeking 0.227 0.225 À0.252 0.0026 3.812
Factor 2: Novelty seeking À0.07 0.326 0.392 0.279 6.733
Factor 3: Seeking escape 0.327 À0.418 0.097 À0.022 6.833
Factor 4: Seeking environmental quality 0.155 0.726 À0.571 0.130 21.138
and safety
Factor 5: Seeking differences 0.065 0.462 À0.497 0.130 13.165
Factor 6: Roughing it and coping À0.084 À1.15 0.274 0.794 58.027
Factor 7: Shopping and art/culture 0.506 À0.161 0.525 À0.984 63.181
Factor 8: Seeking activities for the entire 0.836 À0.708 À0.721 0.120 72.165
family
Note: Factors scores were standardized by Z-scores. *Test statistic indicated po0.001.
Table 4
Travel behaviors of benefit sought segments of French long-haul pleasure travelers to Canada
Trip behavior variables Cluster 1: Cluster 2: Cluster 3: culture Cluster 4: Test statistic p Value
family environment & luxury roughing &
oriented & safety indulgent coping
Conscious
(n ¼ 98, (n ¼ 46, (n ¼ 71, 23% ) (n ¼ 67, (w2 or F)
32%) 15%) 22%)
Number in travel party 2.02 (1.17) 1.80 (1.07) 1.56(1.23) 1.93 (1.47) F ¼ 1:571 0.755
Number of previous visits to Canada 1.34 (1.11) 1.35 (0.95) 1.37 (1.40) 2.04 (2.61) F ¼ 3:561 0.014
Total number of nights stayed in 12.41 (6.04) 12.78 (9.56) 19.75 (25.5) 20.06(19.70) F ¼ 4:499 0.004
Canada
Satisfaction 3.72 (0.47) 3.57 (0.62) 3.80 (0.40) 3.69 (.50) F ¼ 2:276 0.080
Value for the money evaluation 8.42 (1.26) 8.43 (1.07) 8.17 (1.23) 8.16 (1.08) F ¼ 1:112 0.344
Intention to revisit in next 3 years 2.82 (1.13) 2.96 (0.84) 2.91 (0.75) 2.83 (0.95) F ¼ 1:476 0.221
Level of language proficiency:
Speaking English 1.96 (0.99) 0.59 (0.83) 2.56 (0.94) 2.37 (0.93) F ¼ 12:658 0.000
Reading English 1.97 (1.03) 1.57 (0.86) 2.58 (0.95) 2.39 (0.95) F ¼ 12:747 0.000
Travel Arrangements:
Package travelers 53.1% 71.7% 31.0% 31.3%
Long-stay independent travelers 24.5% 19.6% 29.6% 31.3%
Frequent short-stay independent 22.4% 8.7% 39.4% 29.4% w2 ¼ 28:874 0.000
travelers
Note: Numbers in parentheses are standard deviations.
71.7% respectively), while members of Clusters 3 and 4 The respondents were asked to rate their abilities to
tended to be more independent in their travel arrange- communicate in English on a four-point scale, 1 being
ments (Table 4). The total number of previous visits to not at all, 2 not very well, 3 quite well, and 4 very well.
Canada was significantly different across clusters This question should be particularly useful for commu-
(p ¼ 0:014). Cluster 4 (roughing it and coping) had nications strategies. Cluster 3 reported the highest levels
previously visited Canada more than the other clusters, in both speaking and reading ability, rating themselves
having made just over two previous visits. The overall on average 2.56 and 2.58 respectively. These were in the
total number of nights stayed in Canada was 16.1. youngest cluster. Naturally, the oldest cluster (Cluster 2)
Cluster 4 had the longest stay, spending 20.1 days on rated their level of English proficiency the lowest, 1.59 in
average in Canada, followed by Cluster 3 (19.8 days). speaking and 1.57 in reading. There were no significant
Cluster 1 travelers stayed the shortest length of time in differences across clusters in the other variables,
Canada, averaging 12.4 days. including trip party size (overall respondents, 2.13),
9. ARTICLE IN PRESS
584 G. Lee et al. / Tourism Management 27 (2006) 576–588
satisfaction (3.71 on a four-point rating scale), perceived For all French travelers to Canada, cultural experi-
value for money (8.3 on a ten-point scale), and ences such as sampling local food (80% of all
conversion intention in the next 3 years (2.9 on a four- respondents participated), visiting museums and gal-
point scale). In conclusion, French travelers to Canada leries (60%), and seeing local crafts and handiwork
showed a high level of overall destination satisfaction (60%) were the most popular activities, along with
and value for the holiday money but not particularly sightseeing and touring (78%) and visiting friends and
high conversion intention. relatives (30%). Sports activities including golf (3.6%),
fishing/hunting (4.6%), bicycling (8.8%), and water
5.4. Vacation activity participation patterns sports (5.2%) were the least popular activities.
Vacation activity is usually closely related to the 5.5. Expenditure patterns
benefits the travelers seek. Fifty-four dichotomous items
of vacation activities based on multiple responses were In comparing expenditure patterns across the four
categorized into six activity groups: shopping and benefit clusters, three variables were investigated in this
dining, cultural activities, experience of nature and study using ANOVA procedure: total expenditures,
ecology, sports and watching sports events, sightseeing total expenditures per capita (yield), and total exp.
and touring, and visiting friends and relatives (Table 5). PPPD. Overall, French travelers spent 14,729.32 FF on
Then the average amount of participation in each average for their trips to Canada (Table 6). As for the
activity category and total number of activities partici- total expenditures, respondents in Cluster 1 were the top
pated in were calculated for a statistical comparison spenders with an average of 17,337.66 FF, with Clusters
(ANOVA) of groups. There were significant differences 4 and 3 a distant second and third (14,626.62 and
(p ¼ 0:05) across clusters in three activity categories, 14,304.29 respectively). The total expenditures for
namely shopping and dining, cultural activities, and Cluster 2, at 11,022 FF, were far below the overall
sports activities and watching sports events. Cluster 1 average expenditure. When comparing total expendi-
enjoyed shopping and dining more than any other tures per capita, the travelers in Cluster 3 were the top
cluster (2.43). Cluster 2, the oldest female-dominant spenders.
group, participated in cultural activities more than any Another key variable in evaluating the level of
other cluster (6.02), whereas Cluster 4 (roughing it and expenditure is based on total exp. PPPD, which is the
coping) pursued nature and ecological experiences more total expenditure per capita (yield) divided by total
enthusiastically than the others (2.79). The respondents nights of stay. Interestingly, Cluster 1 showed a higher
in Cluster 4 engaged in sports activities more than the level of total exp. PPPD than Cluster 3, once the length
other clusters, showing 1.31 activities participated in for of stay was taken into account. Cluster 4, despite having
this category. As for sightseeing and touring, Cluster 2 the second-largest total trip expenditures among the
had the highest participation among the four clusters four clusters due to long stays, had the smallest amount
(5.78). Overall, Clusters 2 and 4 had the highest levels of of total exp. PPPD, 659.94 FF, which was far below the
participation in total vacation activities, with 17.32 and overall average of 793.26 FF.
17.29, whereas Cluster 3 had the lowest level of activity In addition to the variation in amounts spent, the four
participation, at 15.79. clusters demonstrated different spending patterns,
Table 5
Most popular activities of benefit sought segments of French long-haul pleasure travelers to Canada
Vacation activity participation Cluster 1: Cluster 2: Cluster 3: culture Cluster 4: Test statistic p Value
family environment and luxury roughing it (F)
oriented and safety indulgent (n ¼ 71, and coping
(n ¼ 98, conscious 23%) (n ¼ 67,
32%) (n ¼ 46, 22%)
15%)
Shopping and dining 2.43 (1.10) 2.15 (1.11) 2.25 (1.11) 2.24 (1.18) F ¼ 2:731 0.049
Cultural activity 5.29 (3.02) 6.02 (3.24) 5.14 (2.34) 5.55 (2.73) F ¼ 2:983 0.023
Experience of nature and ecology 2.46 (2.02) 2.30 (1.86) 2.21 (1.88) 2.79 (2.07) F ¼ 1:471 0.122
Sports activities and watching sports 1.13 (1.61) 0.52 (.98) 0.90 (1.28) 1.31 (1.67) F ¼ 3:024 0.036
events
Sightseeing and touring 5.21 (2.36) 5.78 (2.47) 4.86 (2.03) 5.01 (2.20) F ¼ 1:721 0.094
Visiting friends/relatives 0.28 (0.45) 0.24 (0.43) 0.25 (0.44) 0.45 (0.50) F ¼ 2:836 0.039
Total number of activities 16.11 (6.99) 17.32 (7.32) 15.79 (5.25) 17.29 (6.63) F ¼ 2:965 0.033
Note: Numbers in parentheses are standard deviations.
10. ARTICLE IN PRESS
G. Lee et al. / Tourism Management 27 (2006) 576–588 585
Table 6
Travel expenditures of benefit sought segments of French long-haul pleasure travelers to Canada
Expenditures (aFF) Cluster 1: family Cluster 2: Cluster 3: culture & Cluster 4: roughing Test statistic p Value
oriented (n ¼ 93) environment & luxury indulgent it & coping (n ¼ 65) (F)
safety conscious (n ¼ 70)
(n ¼ 46)
Total amount spent on trip to Canada 17,337.66 (11,525.39) 11,022.61 (5344.33) 14,304.29 (8679.97) 14,626.62 (11,673) F ¼ 4:194 0.009
Packages/organized tours 8530.00 (9506.59) 6258.26 (2582.00) 5074.29 (7746.02) 4706.15 (7421.95) F ¼ 3:698 0.024
Meals 1135.11 (2142.19) 475.00 (930. 64) 1367.14 (1670.78) 1407.08 (2199.65) F ¼ 2:667 0.050
Shopping 2393.62 (1722.14) 1671.74 (1036.37) 1912.86 (1653.71) 1807.69 (1608.21) F ¼ 2:985 0.027
Total expenditures per capita 8854.55 (3284.20) 7715.74 (3190.16) 10,895.89 (7694.39) 8754.30 (4238.57) F ¼ 3:118 0.016
Total expenditures per day per capita 841.36 (451.72) 747.34 (323.32) 810.15 (555.73) 659.94 (444.55) F ¼ 2:765 0.028
Note: Numbers in Parentheses are standard deviations.
a
1 FF (French Franc) is about 0.2USD in 2004.
Table 7
Market shares and expenditure comparison by SSI code
Expenditure (in FF) Low value Back-ups Priority market Favorable Test statistic (F) p Value
market (SSI ¼ 2) (SSI ¼ 3) market
(SSI ¼ 1) (SSI ¼ 4)
Market share (volume) 10.8% 39.9% 38.5% 10.8% 100%
Yield (total exp per capita) 4811.29 8313.60 9489.69 15,579.97 F ¼ 32:711 0.000
Total exp. PPPD 555.84 412.06 1198.70 993.08 F ¼ 80:425 0.000
Note: n ¼ 288.
showing significant differences in the expenditure Those who stayed in Canada 12 days or less and spent
categories of package tours, meals, and shopping. It is more than 714.30FF per day per person, and were thus
noteworthy that Cluster 3, who valued art/culture and assigned an SSI value of 3 (the priority market), were
indulging in luxury, spent a significantly larger amount believed to have a comparatively high economic value to
on accommodations than the other clusters (1,138.57 FF DMOs. Benefit Cluster 1, family oriented, seemed to be
compared with the overall average of 785.77 FF). Apart a strong target market for Canadian tourism, being
from package tours and transportation, French travelers composed mainly of the priority market (41%) and the
spent the largest portion of their travel budgets on favorable market (12%), and capturing the largest
shopping (1980 FF, overall) (Table 6). market share (32%). Cluster 2 also had a healthy
economic value portfolio. This segment, however,
garnered only 15% of the overall market; therefore, its
5.6. Economic value evaluation overall value was not significant. A good targeting
opportunity seemed to lie in the second largest segment,
In assessing the economic value of each benefit the culture and luxury indulgent (Cluster 3). Although
segment, the two most effective variables, expenditure there were a good number of back-ups (41%), the
and length of stay, were incorporated to generate the priority and favorable markets together made up more
Economic Value Portfolio Matrix, as presented in Fig. 1. than half of the segment with a considerable market
The French benefit segments were then analyzed based share of 23%. Cluster 4, the roughing it and coping
on the matrix. The profitability of each benefit segment group, who sought wilderness and adventure, enjoying
was evaluated in terms of efficiency of generating travel hiking and climbing and driving around Canada,
and high economic impact, measured by the composi- seemed unattractive to Canadian tourism marketers,
tion of SSI. Yield is believed to be an efficient indicator with a rather poor economic value structure; a majority
of the economic value of a market. As revealed in the of this group were back-ups (55%), which had low profit
study, however, yield alone without consideration of the efficiency.
length of stay does not disclose the real economic value In summary, Canadian tourism marketers may be
of a market in terms of efficiency in generating profit for best off targeting those who seek family togetherness as
a destination. A more analytical tool is the SSI, which their major benefit, and French travelers who seek
facilitates a clearer and more direct comparison among culture and luxury experiences may also generate a
benefit segments (Table 7). rewarding business (Table 8).
11. ARTICLE IN PRESS
586 G. Lee et al. / Tourism Management 27 (2006) 576–588
Table 8
Economic value assessment of benefit sought segments of French long-haul pleasure travelers to Canada
SSI index variable Cluster 1: family Cluster 2: environment Cluster 3: culture and luxury Cluster 4: roughing it and
oriented (n ¼ 93, 32%) and safety conscious indulgent (n ¼ 71, 23% ) coping (n ¼ 65, 22%)
(n ¼ 41, 15%)
Low value market 10.8% 15.6% 7.2% 12.3%
Back-ups 33.3% 33.3% 40.6% 55.4%
Priority market 41.4% 42.2% 34.8% 26.2%
Favorable market 11.8% 8.9% 17.4% 6.2%
Note: The index variables in the four categories were created from variables of the average length of stay and the total expenditure per person per day
(PPPD) spent in Canada based on the median values of each variable.
Economic Value Index was computed by multiplying market share of overall market (100) by proportion of priority market (percentage of each
segment).
6. Conclusions and marketing implications segments with the most economic value to the tourist
destinations. Accordingly, the demand for more effec-
The main goal of the study was to propose a practical tive tools to select the most profitable target segment
tool for evaluating travel market segments in terms of seems to be urgent. These tools should help destination
the expected economic return on each identified marketers to identify the segments that produce the
segment. This was achieved by developing a compre- highest return on dollars invested, and thus to focus on
hensive and objective measure of the economic value key marketing strategies with respect to reaching and
portfolio of the various benefit segments among French communicating with target markets and providing
long-haul pleasure travelers to Canada. In addition, by services and facilities demanded by the markets.
connecting the key variables (e.g., travel mode and Addressing this need, several researchers have sug-
arrangement, satisfaction, perceived value, revisit inten- gested marketing target selection criteria to help DMOs
tion, and vacation activities) with the benefits sought, based on profitability and economic return (McQueen &
the current study aimed to provide DMOs with Miller, 1985; Loker & Perdue, 1992; Kastenholz et al.,
integrated information on each segment. This approach 1999). However, these methods had three main draw-
bridges the gap in the benefit literature, as suggested by backs: complexity, subjectivity, and lack of comprehen-
several researchers (Jang et al., 2000; Morrison, 2002). siveness. Therefore, instead of a complex and costly
Ultimately this approach may help the DMOs gain procedure, a method that is easily applicable at a
insight into product design and communication strate- relatively low cost was suggested here for destination
gies. marketers who are striving to evaluate and select the
In an extremely competitive market environment with most favorable target segments.
increasing pressure for return on marketing dollars, As an advance in this much-needed area, the current
adopting a segmentation strategy for high efficiency in study suggested a simple and practical technique to
generating revenue is a critical task for all destination assess the economic value of segments for target
marketers. The current study indicates that benefit- selection in light of efficiency in generating profit and
based market segmentation is a viable and useful tool market size. Applying an in-depth scale of 39 items
for segmenting the French leisure travel market to covering both psychological and destination attribute-
Canada. As to the usefulness of benefit as a market based benefits, four distinctive benefit segments were
segmentation basis, the result is consistent with previous identified among French leisure travelers to Canada: the
studies (Jang et al., 2000; Yannopoulos & Rotenberg, family oriented, the environment and safety conscious,
1999; Frochot & Morrison, 2000; Morrison et al., 1996; the culture and luxury indulgent, and the roughing it
Moscardo et al., 1996; Woodside & Jacobs, 1985; and coping. These four benefit segments demonstrated
Goodrich, 1976). Several researchers have shown the sharp contrasts not only in their benefit sought but also
superiority of benefit as a predictor for tourist destina- in their travel behaviors. The family oriented (Cluster 1)
tion choice, compared to other psychographics seemed to be the most viable target market for Canadian
and behavior variables (Johar & Sirgy, 1995). These tourism, and targeting the culture and luxury indulgent
research examples, like the current study, have con- (Cluster 3) benefit segment might be rewarding as well.
firmed the usefulness of the benefit segmentation These two benefit segments were relatively substantial
approach as a strategic marketing tool for the industry (32% and 23% of the market share, respectively) and
practitioners. composed largely of priority and favorable markets by
To date, however, few studies (e.g., Jang et al., 2000) virtue of which they had higher profit-generating
have suggested objective and quantitative criteria for the efficiency.
12. ARTICLE IN PRESS
G. Lee et al. / Tourism Management 27 (2006) 576–588 587
Several marketing implications were derived from the Disclaimer Note: The data utilized in this research was
analyses in this study. Overall, the status of the French made available by the Canadian Tourism Commission
market for Canadian tourism seems to be quite (CTC). The data were originally gathered by PriceWa-
favorable. First, the priority and favorable markets terhouseCoopers under arrangement with the CTC.
constituted almost half of the market, while only 11% of Neither the collector of the original data nor the CTC
French travelers were from the low value market. bear any responsibility for the analysis or interpretations
Second, even though back-ups do not generate presented here.
expenditures as efficiently, there is a great opportunity
for Canada to capitalize on this segment, especially
during off-seasons and weak economic periods.
Back-ups made up the largest share at 40% of the References
French travel market to Canada. It is highly recom-
mended that Canadian tourism officials carefully Andereck, K. L., Caldwell, L. L., & Debbage, K. (1991). A market
segmentation analysis of zoo visitors. In Travel and Tourism
identify tactics to turn this low efficiency market into a Research Association 22nd Annual Conference (pp. 359–372). Salt
more lucrative one. Lake City, Utah.
In addition, there seems to be good growth potential Bock, T., & Uncles, M. (2002). A taxonomy of differences between
for Canadian tourism in targeting Clusters 2 and 4. consumers for market segmentation. International Journal of
Research in Marketing, 19, 216–219.
First, Cluster 2 had a positive profit efficiency structure.
Canadian Tourism Commission (2002). Canadian Tourism Facts &
However, the market size was relatively small. There- Figures 2001. Retrieved March 27, 2003 from http://www.canada
fore, it is recommended that Canadian DMOs identify a tourism.com/ctxUploads/en_publications/Tourism2001.pdf.
strategy to enlarge this segment. Based on the informa- Canadian Tourism Commission (1999). France strategic segmentation
tion collected in this study, members of this group were ´,
study. Communique retrieved on June 12, 2003 from http://
typically female, older, non-working, with relatively low www.canadatourism.com/en/ctc/ctx/ctx-news/general/articledetails.
cfm?articleID=10022&language=english
education and a lower level of proficiency in both Davies, A., & Prentice, R. (1995). Conceptualizing the latent visitor to
speaking and reading English. Cluster 4, roughing it and heritage attractions. Tourism Management, 17(7), 491–500.
coping, had the highest proportion of back-ups. It is Frochot, I., & Morrison, A. M. (2000). Benefit segmentation: A review
suggested that Canadian tourism develop marketing of its applications to travel and tourism research. Journal of Travel
& Tourism Marketing, 9(4), 21–45.
strategies to induce more spending from the back-ups by
Gitelson, R. J., & Kerstetter, D. L. (1990). The relationship between
providing more opportunities for them to spend, and sociodemographic variables, benefits sought and subsequent
redesigning services and facilities to better meet their vacation behavior: A case study. Journal of Travel Research,
needs and desires. Connected to this analysis, Cluster 4, 28(3), 24–29.
whose average length of stay was 35 days, were the Goodrich, J. N. (1976). An investigation of consumer perceptions of,
travelers most experienced with Canada, engaging in and preferences for, selected tourist destinations: A multidimen-
sional scaling approach, Unpublished Ph.D. dissertation, State
sports activities, enjoying hiking and climbing, seeking University of New York at Buffalo.
wilderness and adventure, and visiting friends and Goodrich, J. N. (1977). Benefit bundle analysis: An empirical study of
relatives while in Canada. This segment may be better international travelers. Journal of Travel Research, 16(Fall), 6–9.
approached with a VFR marketing strategy. Further- Goodrich, J. N. (1980). Benefit segmentation of US international
more, these travelers seem to seek what Canada offers travelers: An empirical study with American Express. In D.
Hawkins, E. Shafer, & J. Rovelstad (Eds.), Tourism Marketing
best (i.e., wilderness and nature), so this segment has a and Management Issues (pp. 133–147). Washington, DC: George
high compatibility. Hence, the best strategy for this Washington University.
segment may be to induce the back-ups’ spending and to Haley, R. (1968). Benefit segmentation: A decision-orientated research
enlarge short-staying heavy spender market (priority tool. Journal of Marketing, 32(July), 30–35.
Haley, R. (1999). Benefit segmentation—thoughts on its past and its
market).
future. Journal of Segmentation in Marketing, 3(1), 5–11.
Incorporating useful information on travel behaviors Hair, J. F., Anderson, R. E., Tatham, R. L., & Black, W. C. (1995).
and psychological benefits sought, the Economic Value Multivariate data analysis (4th ed.). NJ: Prentice Hall.
Portfolio Matrix technique can help DMOs focus on Jang, S. C., Morrison, A. M., & O’Leary, J. T. (2000). Benefit
their strongest market segments, while also addressing segmentation of Japanese pleasure travellers to the USA and
market weaknesses. The ultimate goal of this research Canada: Selecting target markets based on the profitability and
risk of individual market segments. Tourism Management, 23,
was to assist destination marketers in their target 367–378.
selection by proposing a tool to evaluate at low cost Johar, J. S., & Sirgy, M. J. (1995). Using segment congruence analysis
alternative market segments in terms of profitability to determine actionability of travel/tourism segments. Journal of
with maximum efficiency. However, the best results can Travel & Tourism Marketing, 4(3), 1–17.
be achieved when all market information is integrated Kastenholz, E., Davis, D., & Paul, G. (1999). Segmenting tourism in
rural areas: The case of north and central Portugal. Journal of
based on consideration of the destination’s unique Travel Research, 37(4), 353–363.
market situation and compatibility with the existing Kotler, P., & Armstrong, G. (2003). Principles of marketing (10th ed.).
market position. Upper Saddle River, NJ: Prentice-Hall.
13. ARTICLE IN PRESS
588 G. Lee et al. / Tourism Management 27 (2006) 576–588
Loker, L., & Perdue, R. (1992). A benefit-based segmentation of a World Tourism Organization. (2000). Tourism highlights 2000.
nonresident summer travel market. Journal of Travel Research, Madrid: World Tourism Organization.
31(1), 30–35. Yannopoulos, P., & Rotenberg, R. (1999). Benefit segmen-
Mason, K. J., & Gray, R. (1996). Short haul business travel in the tation of the near-home tourism market: The case of upper
European Union: a segmentation profile. Journal of Air Transport New York state. Journal of Travel & Tourism Marketing, 8(2),
Management, 2(3/4), 197–198. 41–55.
McCool, S. F., & Reilly, M. (1993). Benefit segmentation analysis of
state park visitor stating preference and behavior. Journal of Park
and Recreation Administration, 11(4), 1–14.
McQueen, J., & Miller, K. (1985). Target market selection of tourists:
A comparison of approaches. Journal of Travel Research, 24(1), Further reading
2–6.
Morrison, A. M. (2002). Hospitality and travel marketing. Albany, Andersen, V., Prentice, R., & Wantanabe, K. (2000). Journey for
New York: Delmar Thomson Learning. experiences: Japanese independent travelers in Scotland. Journal of
Morrison, A. M., Hsieh, S., & O’Leary, J. T. (1994). Segmenting the Travel & Tourism Marketing, 9(1/2), 129–151.
Australian domestic travel market by holiday activity participa- Cha, S., McCleary, K., & Uysal, M. (1995). Travel motivations of
tion. Journal of Tourism Studies, 5(1), 39–56. Japanese overseas travellers: A factor-cluster segmentation ap-
Moscardo, G. M., Morrison, A. M., Pearce, P. L., Lang, C. T., & proach. Journal of Travel Research, 34(1), 33–39.
O’Leary, J. T. (1996). Understanding vacation destination choice Chen, J. S. (2003). Market segmentation by tourists’ sentiments.
through travel motivation and activities. Journal of Vacation Annals of Tourism Research, 30(1), 188–191.
Marketing, 2(2), 109–122. Chon, K., & Singh, A. (1995). Marketing resorts to 2000: Review of
Prentice, R. C., Witt, S. F., & Hamer, C. (1998). Tourism as trends in the USA. Tourism Management, 16(6), 463–469.
experience: The case of heritage parks. Annals of Tourism Research, ´
Communique June. (1999). France strategic segmentation study.
25(1), 1–2. Canadian Tourism Commission. (posted 1999-June 01). URL:
Qiu, H., & Zhang, J. (1995). Determinants of tourist arrivals and http://www.canadatourism.com/en/ctc/ctx/ctxnews/general/article-
expenditures in Canada. Journal of Travel Research, 34(2), 43–49. deails.cfm?articleID=10022&language=english
Richardson, S. L., & Crompton, J. (1988). Vacation patterns of French Dickson, P. R., & Ginter, J. L. (1987). Market segmentation, product
and English Canadians. Annals of Tourism Research, 15(3), differentiation, and marketing strategy. Journal of Marketing,
430–435. 51(April), 1–10.
Ryan, C., & Glendon, I. (1998). Application of leisure motivation scale Galloway, G. (2002). Psychographic segmentation of park visitor
to tourism. Annals of Tourism Research, 25(1), 169–184. markets: evidence for the utility of sensation seeking. Tourism
Schul, P., & Crompton, J. L. (1983). Search behavior in international Management, 23, 581–583.
vacationers: Travel-specific lifestyles and sociodemographic vari- Milner, L., Collins, Tachibana, R., & Hiser, R. (2000). The Japanese
ables. Journal of Travel Research, 22(Fall), 25–30. vacation visitor to Alaska: A preliminary examination of peak and
Shoemaker, S. (1994). Segmenting the US travel market according to off season traveler demographics, information source utilization,
benefits realized. Journal of Travel Research, 33(2), 8–21. trip planning, and customer satisfaction. Journal of Travel &
Sussmann, S., & Rashcovsky, C. (1997). A cross-cultural analysis of Tourism Marketing, 9(1/2), 43–56.
English and French Canadians’ vacation patterns. International Oh, H. C., Uysal, M., & Weaver, P. A. (1995). Product bundles and
Journal of Hospitality Management, 16(2), 191–208. market segments based on travel motivations: a canonical
Tian, S., Crompton, J. L., & Witt, P. A. (1996). Integrating constraints correlation approach. International Journal of Hospitality Manage-
and benefits to identify responsive target markets for museum ment, 14(2), 125–136.
attractions. Journal of Travel Research, 35(2), 34–44. Ratneshwar, S., Warlop, L., Mick, D. G., & Seeger, G. (1997).
Woodside, A. G., & Jacobs, L. W. (1985). Step two in benefit International Journal of Research in Marketing, 14, 256.
segmentation: learning the benefits realized by major travel Wendel, M., & Steenkamp, J.-B. E. M. (1989). A clusterwise regression
markets. Journal of Travel Research, 23(Fall), 14–24. approach to benefit segmentation. International Journal of Research
Woodside, A. G., & Pitts, R. E. (1976). Effects of consumer lifestyles, Marketing, 6, 241–258.
demographics, and travel activities on foreign and domestic travel Wind, Y. (1978). Issues and advances in segmentation research.
behaviour. Journal of Travel Research, 14(Winter), 13–15. Journal of Marketing Research, 15, 317–337.