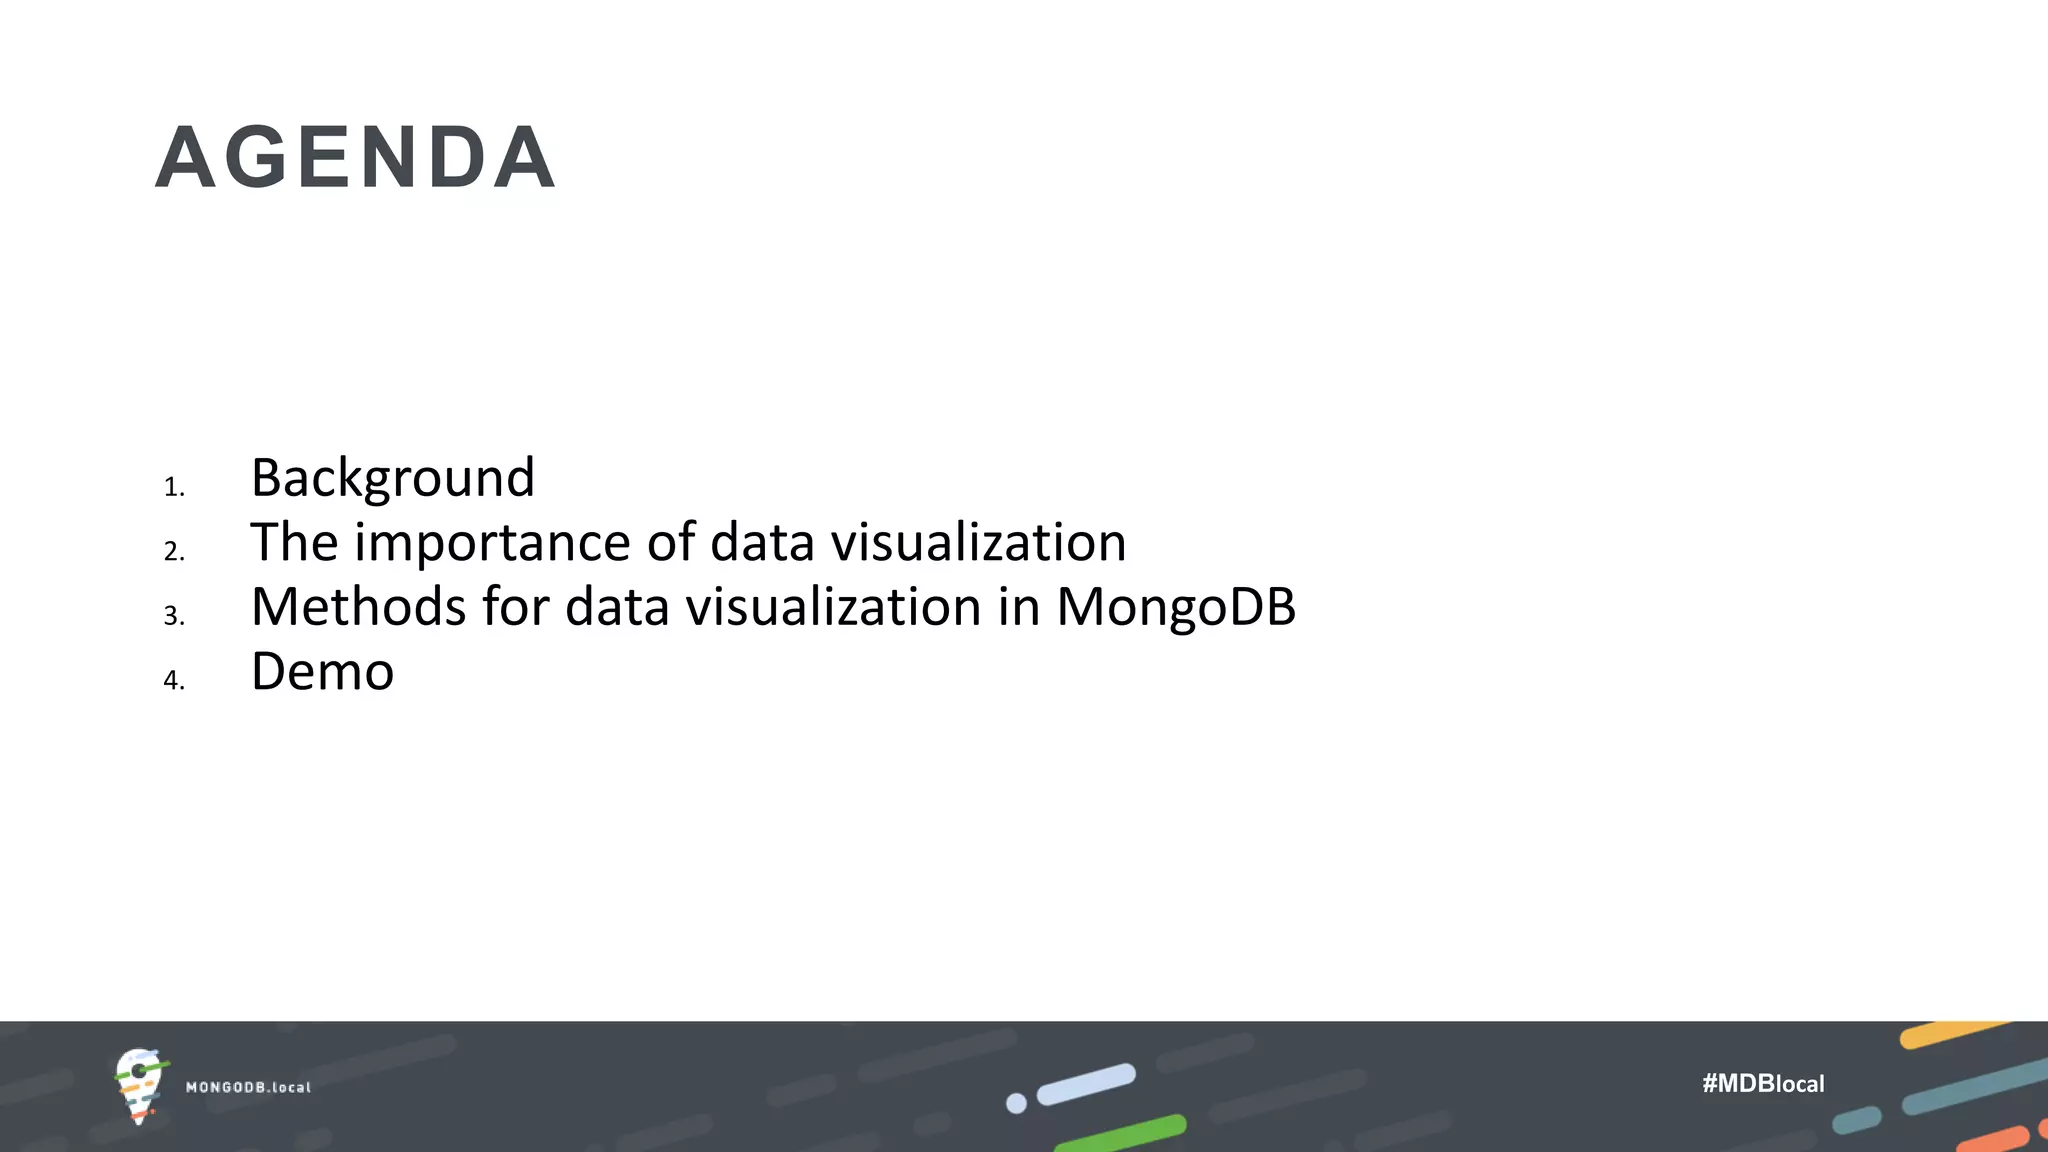
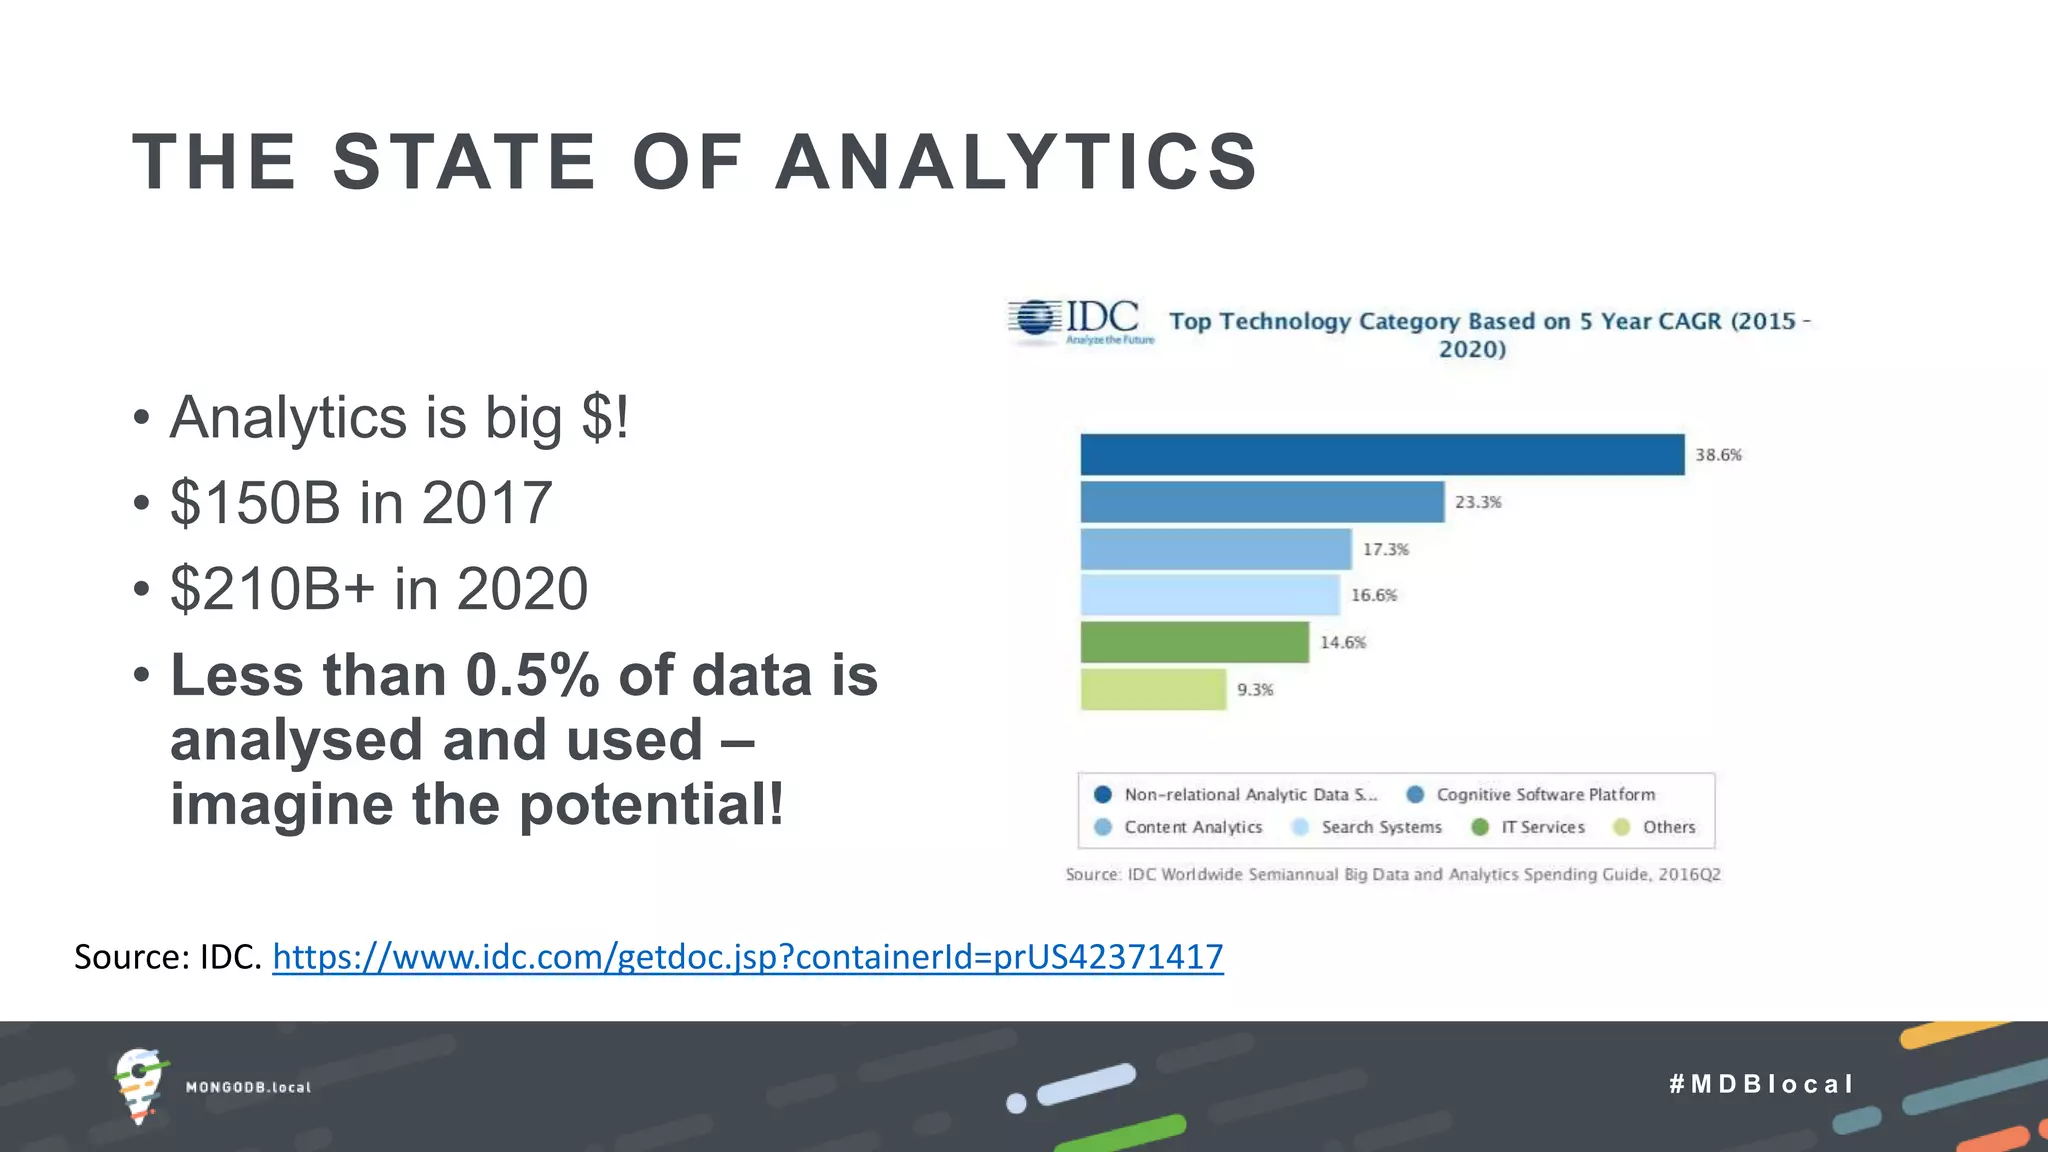
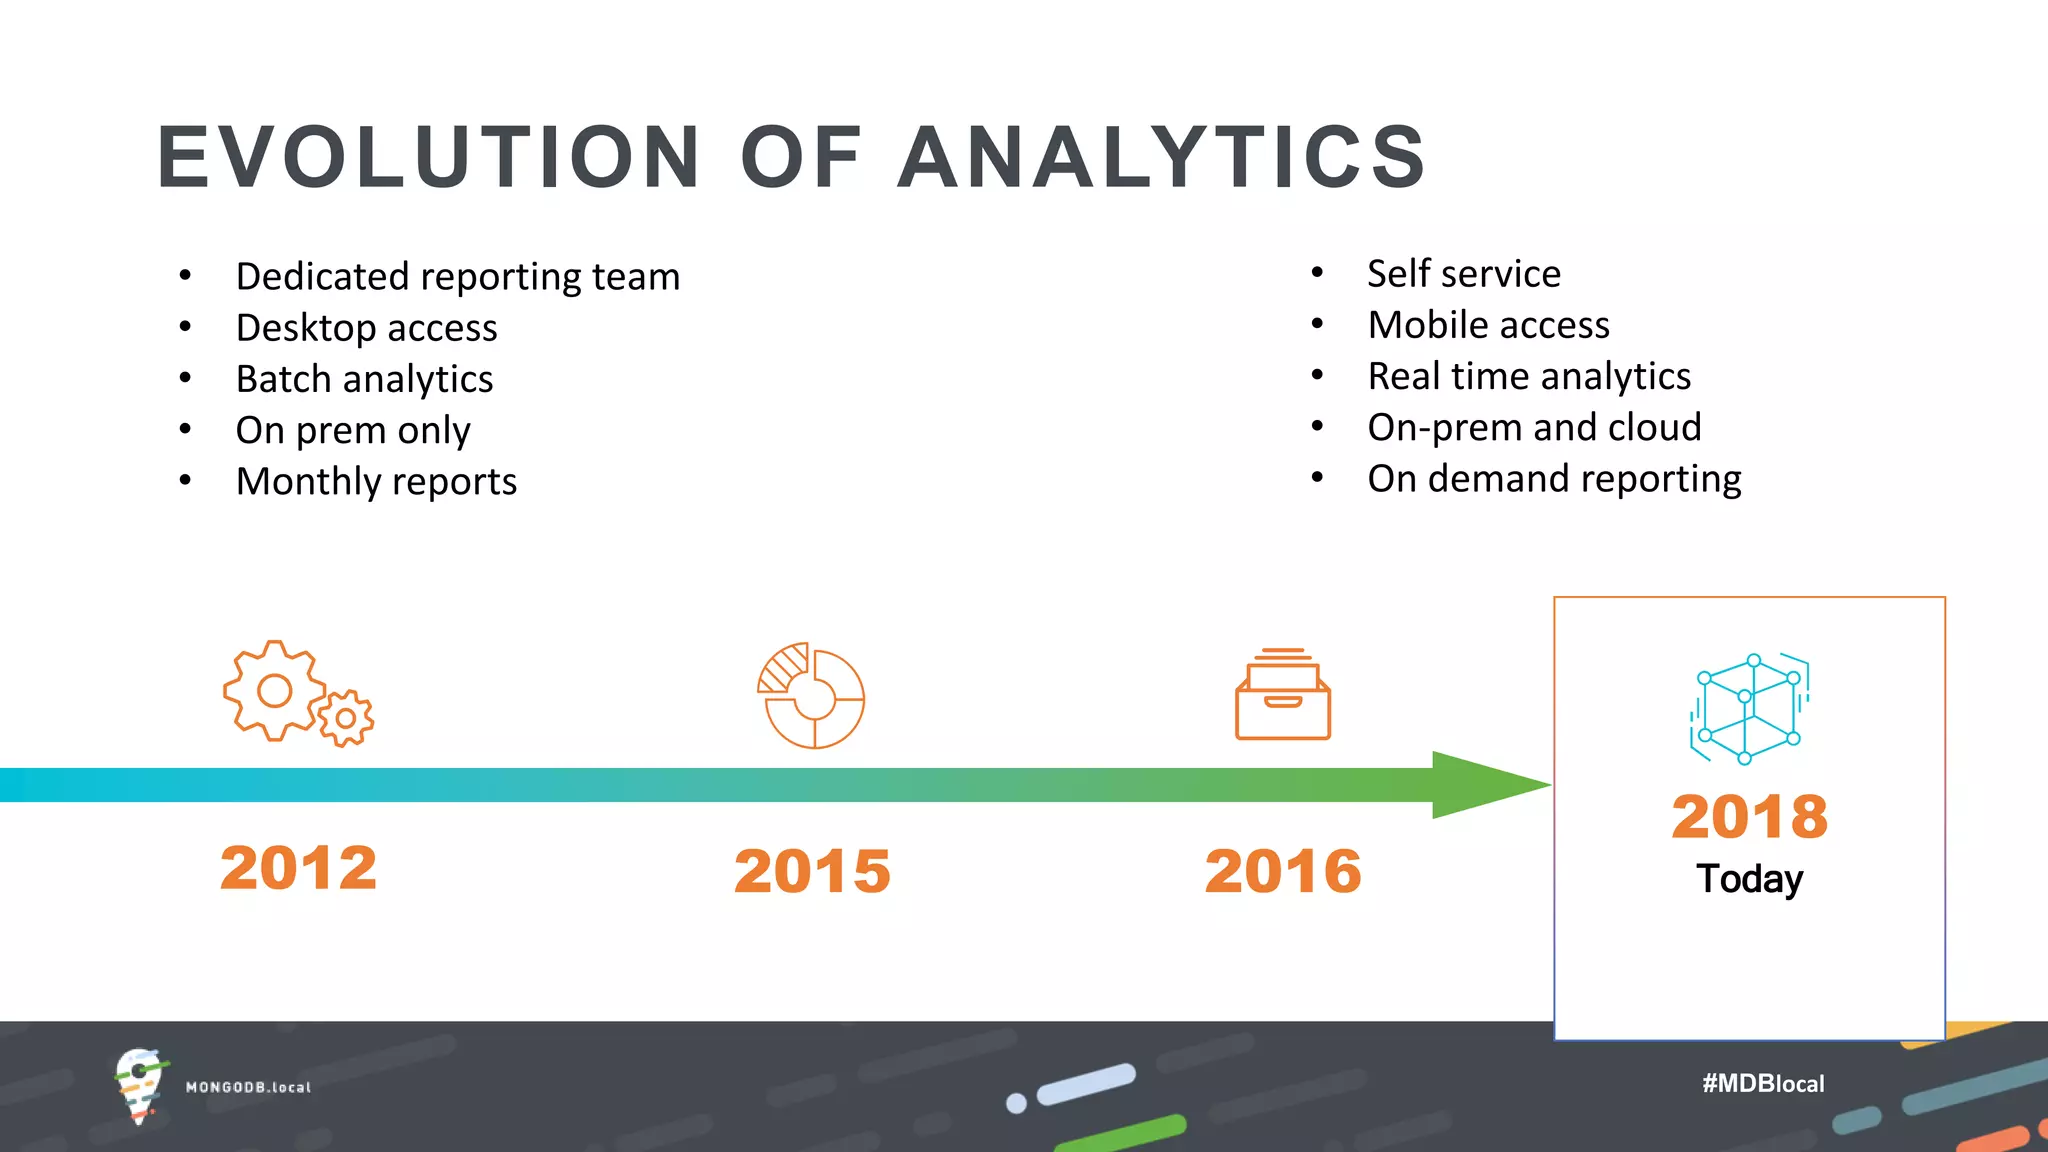
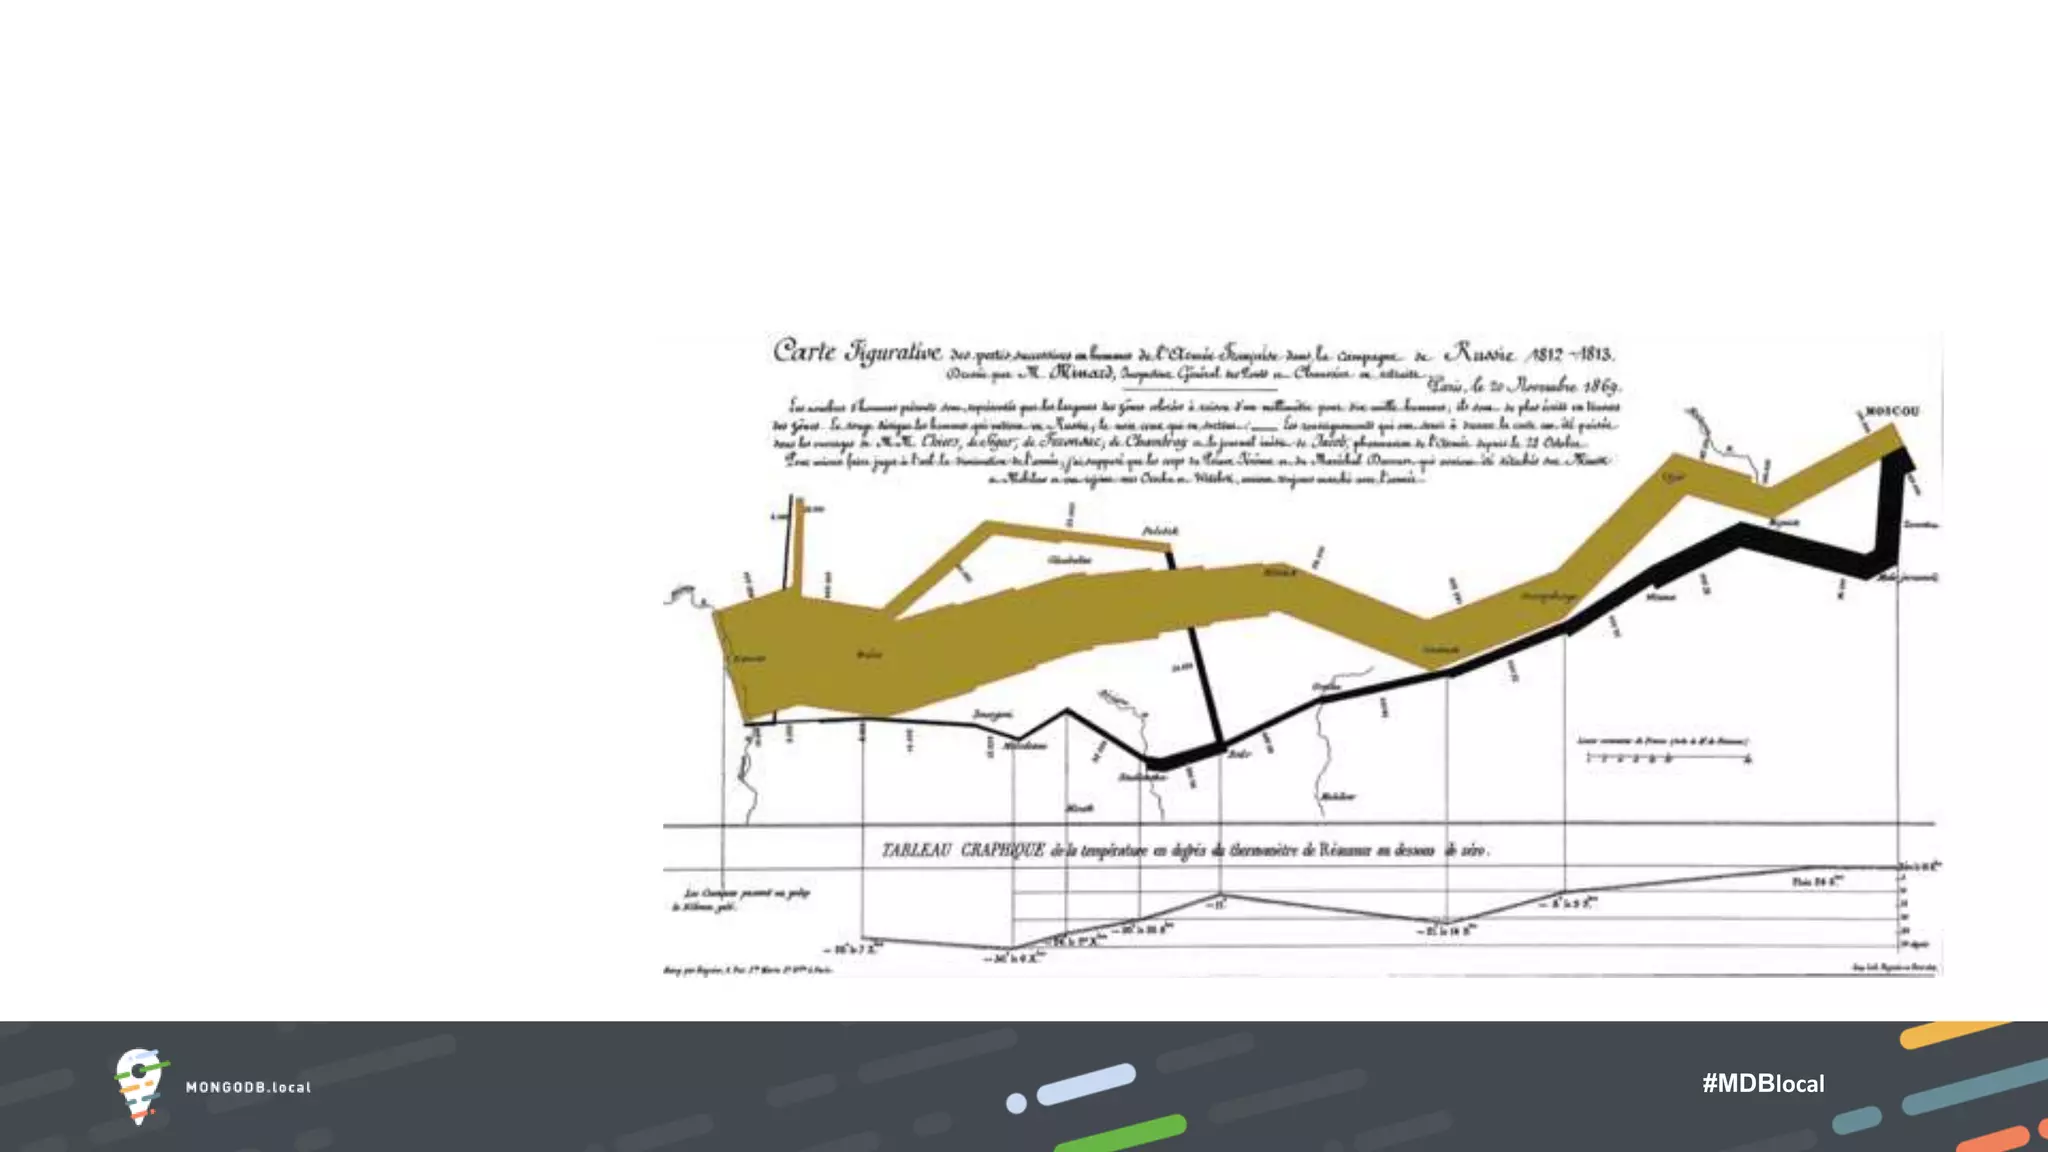
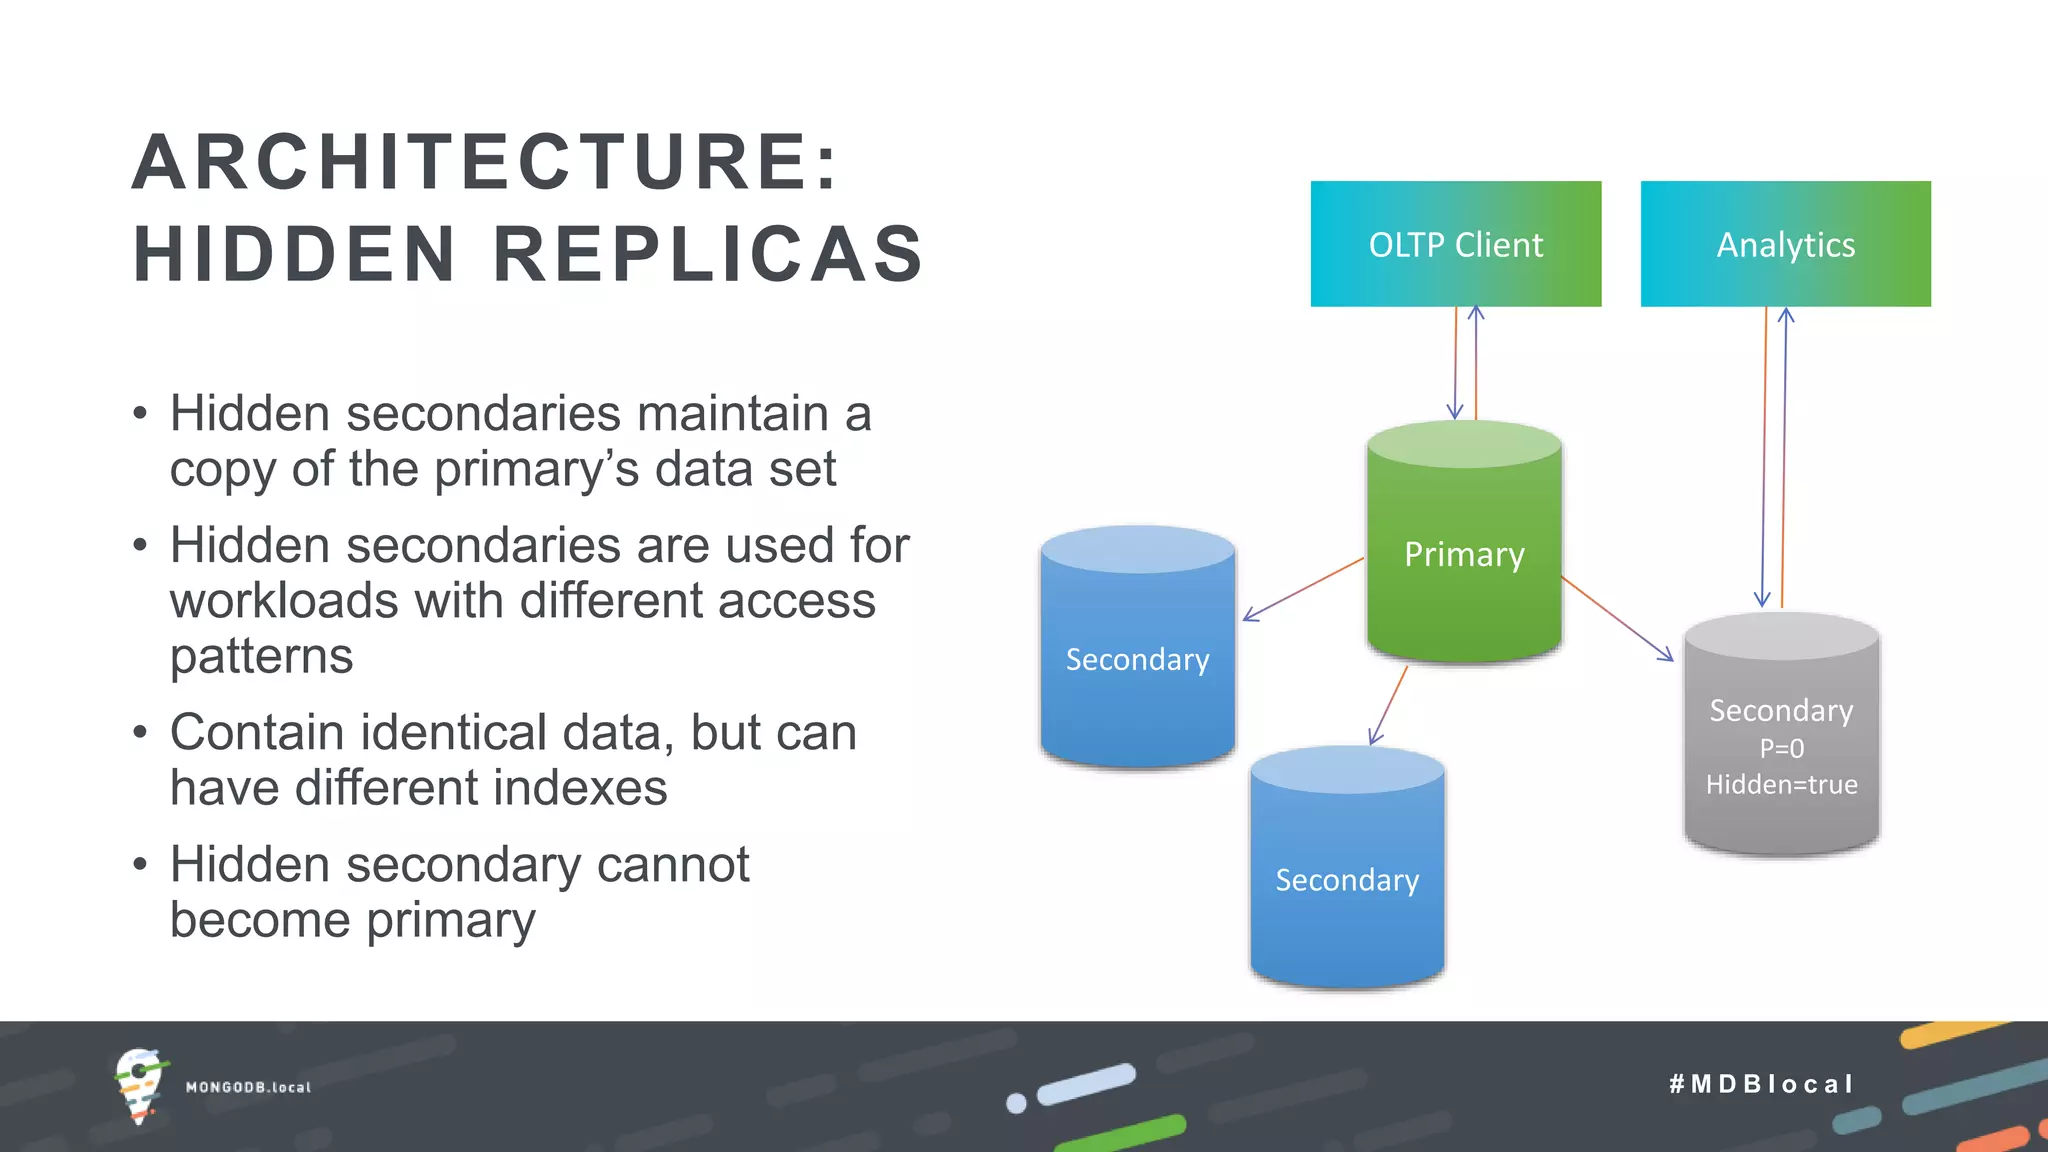
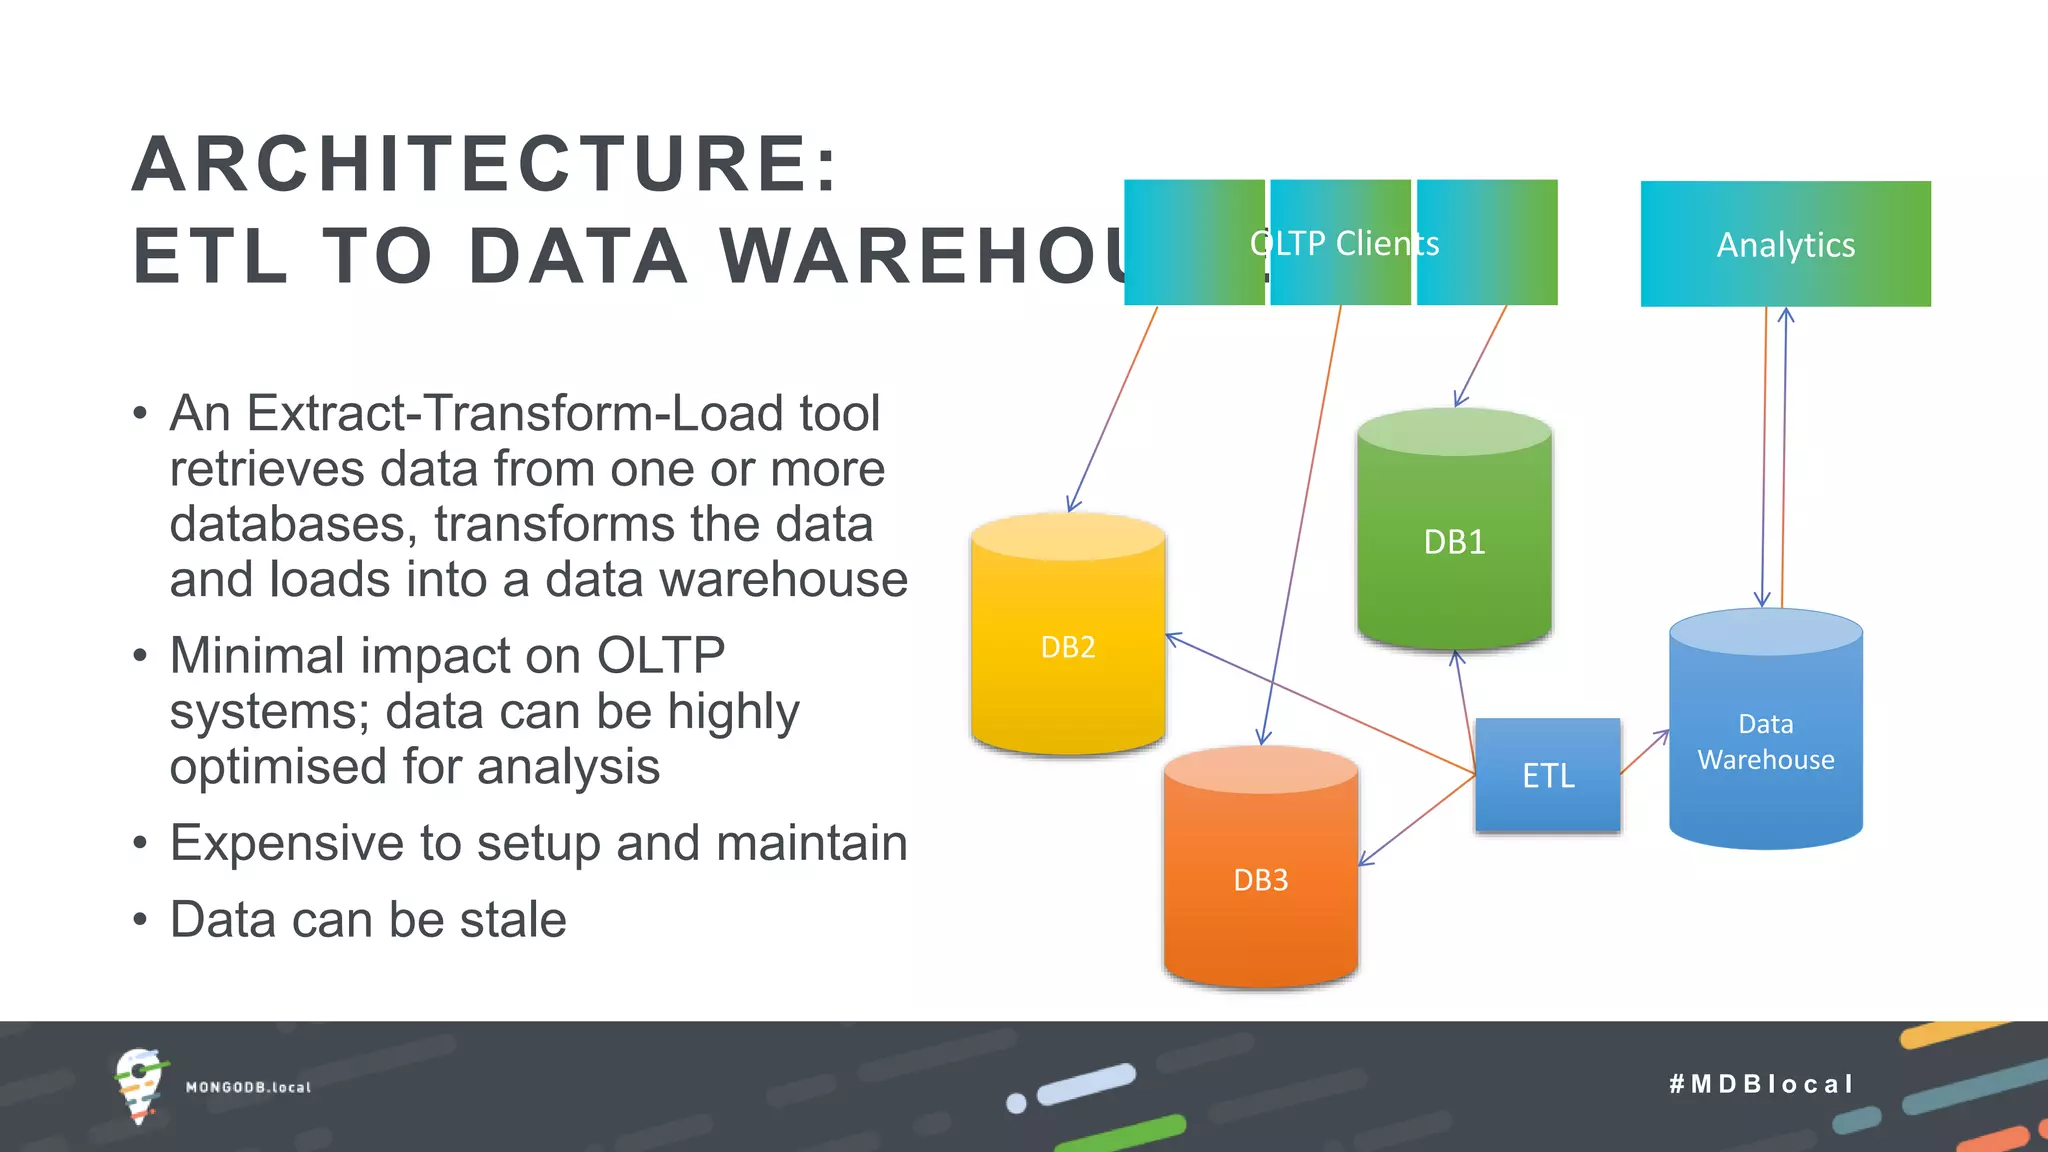
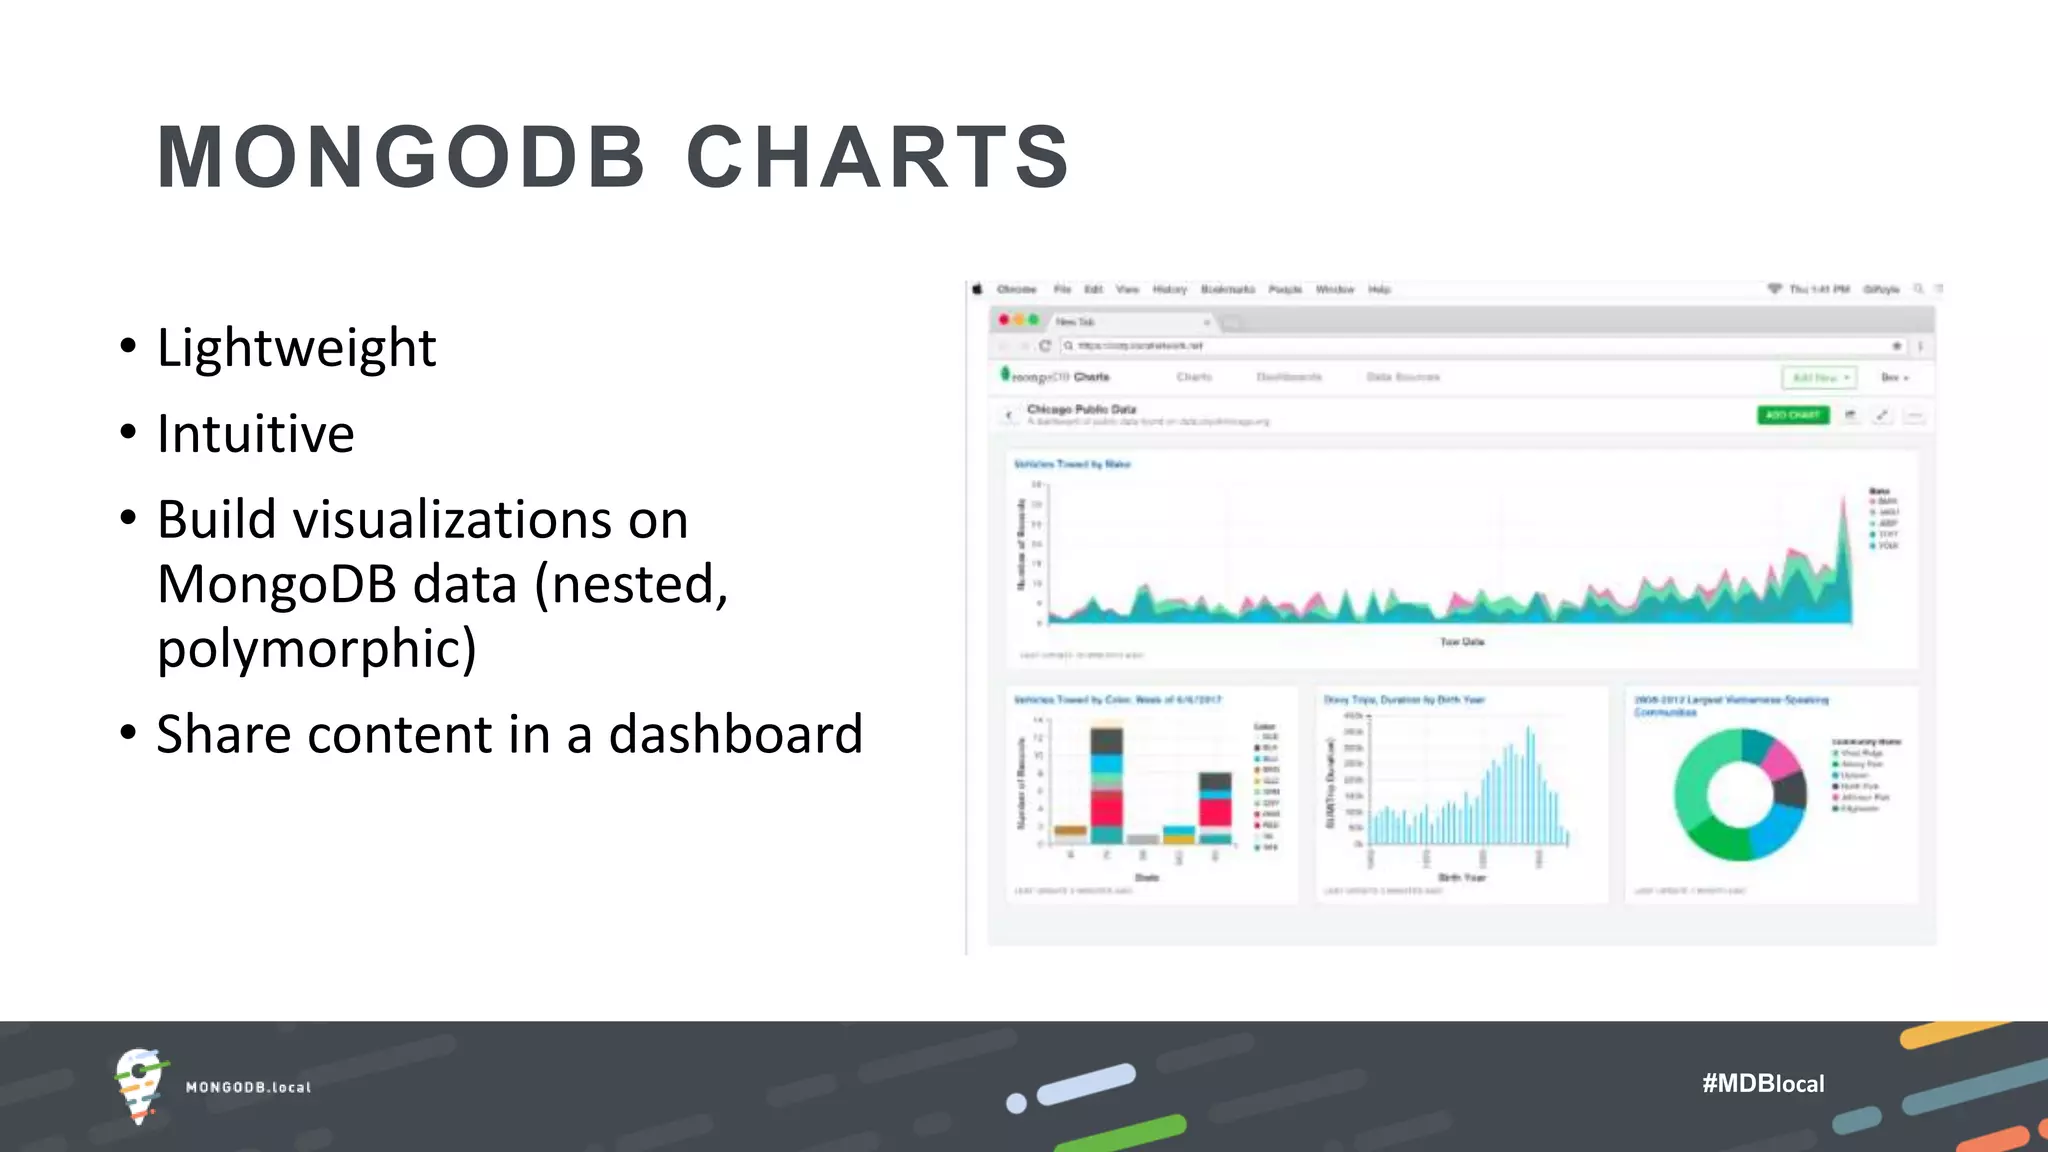
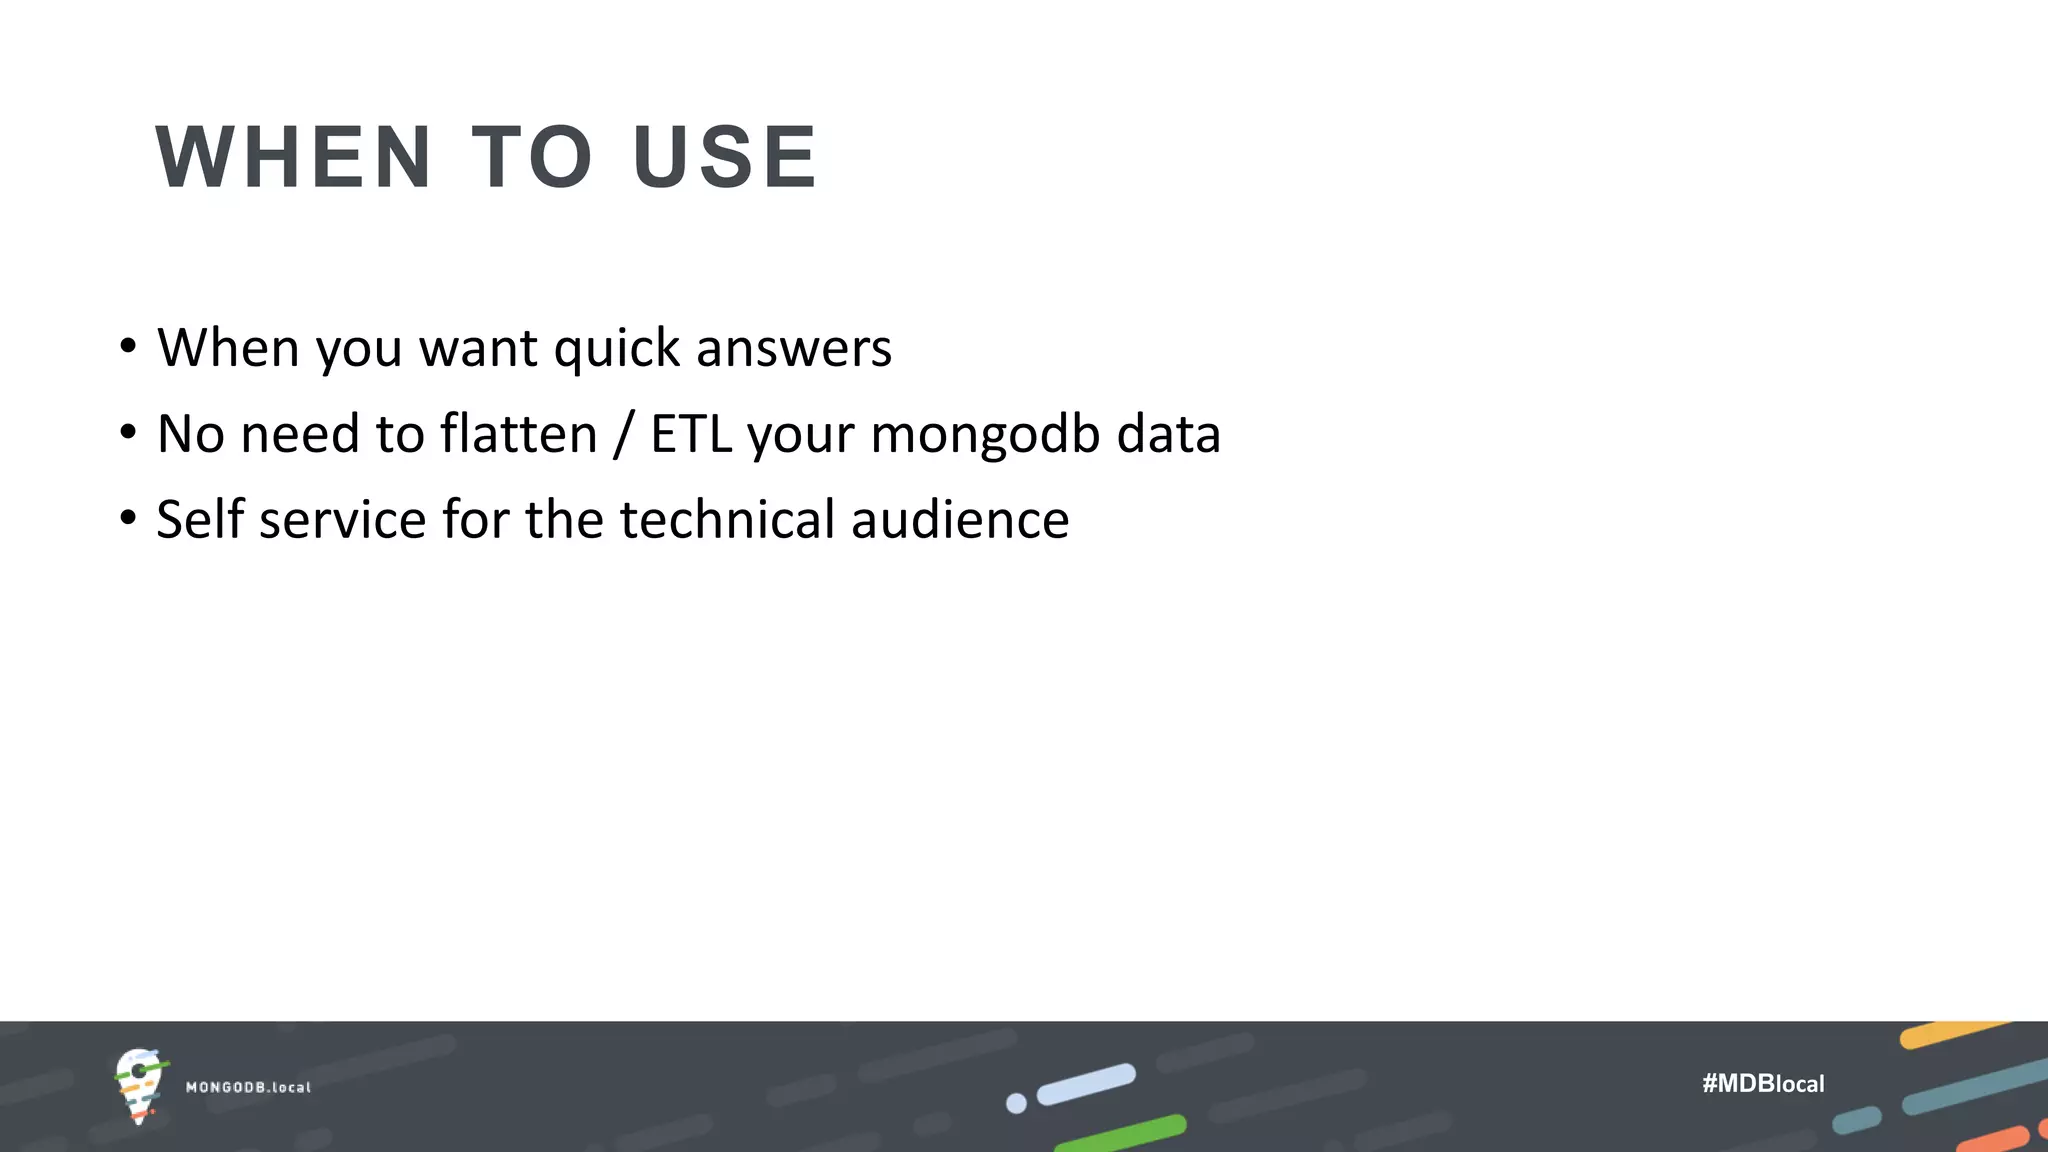
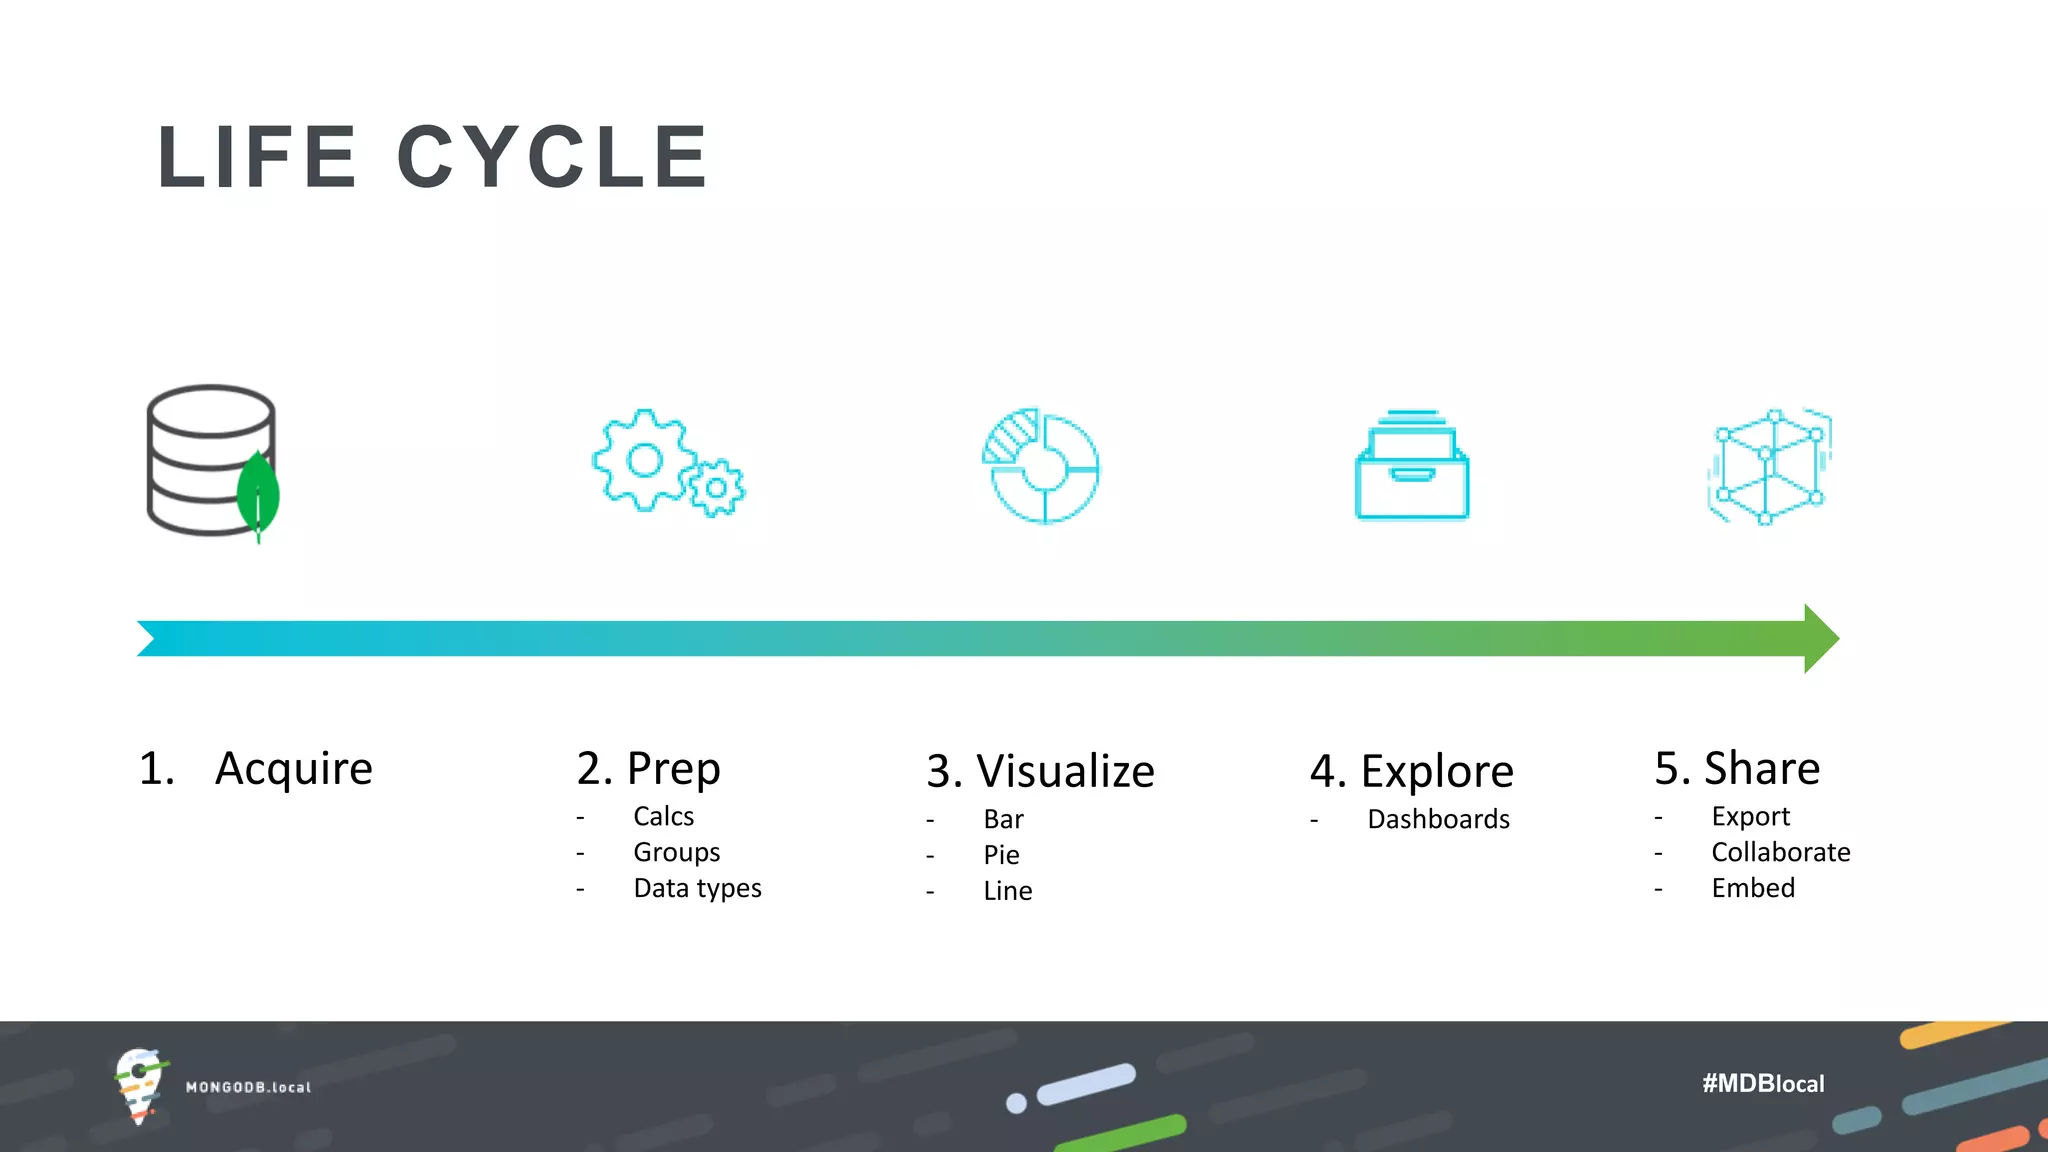
#MDBlocal
THE PATH TO
TRULY UNDERSTANDING
YOUR MONGODB DATA
Bengaluru
#MDBlocal
Vivek Singh
Sr. Solution Architect, MongoDB
#MDBlocal
AGENDA
1. Background
2. The importance of data visualization
3. Methods for data visualization in MongoDB
4. Demo
#MDBlocal
WHERE ARE WE NOW?
#MDBlocal
TERMINOLOGY
“Business
Intelligence” “Business
Analytics”
ANALYTICS
DATA VISUALISATION
#MDBlocal
DATA GROWTH IS EXPLOSIVE
• More data created in the last 2 years
than entire previous history of the
human race
• By 2020:
• 1.7MB per person every second
# M D B l o c a l
• Analytics is big $!
• $150B in 2017
• $210B+ in 2020
• Less than 0.5% of data is
analysed and used –
imagine the potential!
THE STATE OF ANALYTICS
Source: IDC. https://www.idc.com/getdoc.jsp?containerId=prUS42371417
#MDBlocal
EVOLUTION OF ANALYTICS
• Self service
• Mobile access
• Real time analytics
• On-prem and cloud
• On demand reporting
2018
Today2015 20162012
• Dedicated reporting team
• Desktop access
• Batch analytics
• On prem only
• Monthly reports
#MDBlocal
IMPORTANCE OF
DATA VISUALISATION
#MDBlocal
#MDBlocal
EARLY DATA VISUALIZATIONS
Charles Minard (1869)
-- Napolean’s march and
retreat on Moscow in
1812.
#MDBlocal
SO YOU WANT TO VISUALIZE?
# M D B l o c a l
EASY (ish) HARD (er?)
#MDBlocal
• Use the correct architecture
• Determine what your needs are
• Multiple data sources?
• Huge amounts of complex data?
• Quick self service?
• Choose the right solution for you
THINGS TO THINK ABOUT
#MDBlocal
ARCHITECTURE FOR
ANALYTICS
# M D B l o c a l
• Hidden secondaries maintain a
copy of the primary’s data set
• Hidden secondaries are used for
workloads with different access
patterns
• Contain identical data, but can
have different indexes
• Hidden secondary cannot
become primary
ARCHITECTURE:
HIDDEN REPLICAS OLTP Client Analytics
Primary
Secondary
Secondary
Secondary
P=0
Hidden=true
# M D B l o c a l
• An Extract-Transform-Load tool
retrieves data from one or more
databases, transforms the data
and loads into a data warehouse
• Minimal impact on OLTP
systems; data can be highly
optimised for analysis
• Expensive to setup and maintain
• Data can be stale
ARCHITECTURE:
ETL TO DATA WAREHOUSE Analytics
DB1
DB2
DB3
Data
Warehouse
ETL
OLTP Clients
#MDBlocal
TOOLING
#MDBlocal
BUILD YOUR OWN
• Pro’s
• Custom tailored solution: fits exactly as required!
• Con’s
• High investment
• Maintenance
• Deep understanding of the underlying tech and its language(s)
#MDBlocal
USE THE TOOLS WE GIVE
YOU
#MDBlocal
MONGODB COMPASS
• Developer tool
• Data management and
manipulation
• Interesting schema analysis
• Used daily: a good first place to
start
#MDBlocal
WHEN TO USE
• Day-to-day development/operations
• Adding indexes
• Viewing server stats
• Data manipulation
• 10,000->1ft view of data
#MDBlocal
BI CONNECTOR
• Visualize and explore MongoDB
data in SQL-based BI tools:
• Automatically discovers the schema
• Translates complex SQL statements
issued by the BI tool into MongoDB
aggregation queries
• Converts the results into a tabular
format for rendering inside the BI
tool
#MDBlocal
BI CONNECTOR
#MDBlocal
WHEN TO USE
• Multi datasources (not just mongodb)
• Business analysts
• Extremely powerful but high ramp
#MDBlocal
MONGODB CHARTS
• Lightweight
• Intuitive
• Build visualizations on
MongoDB data (nested,
polymorphic)
• Share content in a dashboard
#MDBlocal
WHEN TO USE
• When you want quick answers
• No need to flatten / ETL your mongodb data
• Self service for the technical audience
#MDBlocal
DEMO
#MDBlocal
LIFE CYCLE
1. Acquire 2. Prep
- Calcs
- Groups
- Data types
3. Visualize
- Bar
- Pie
- Line
4. Explore
- Dashboards
5. Share
- Export
- Collaborate
- Embed
#MDBlocal
THANK YOU

[MongoDB.local Bengaluru 2018] The Path to Truly Understanding Your MongoDB Data

Editor's Notes

  • #9 96 DVDs per person per day
  • #14 One of the best statistical drawings ever made. Tells of 400,000 army marching on moscow and returning with 10,000. Shows time and loss of life, routes and river crossings etc.
  • #20 Eye can process 10million bits per second. Roughly the same as Ethernet.