More Related Content
Similar to G6 m1-b-lesson 10-s
Similar to G6 m1-b-lesson 10-s (20)
G6 m1-b-lesson 10-s
- 1. NYS COMMON CORE MATHEMATICS CURRICULUM Lesson 10 6• 1
Lesson 10: The Structure of Ratio Tables: Additive and
Multiplicative
Classwork
Exploratory Challenge
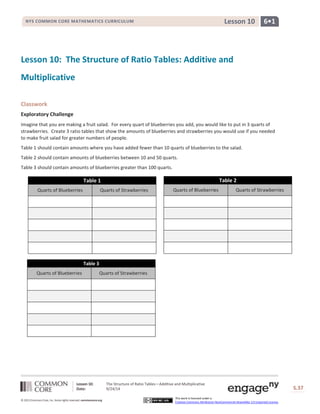
Imagine that you are making a fruit salad. For every quart of blueberries you add, you would like to put in 3 quarts of
strawberries. Create 3 ratio tables that show the amounts of blueberries and strawberries you would use if you needed
to make fruit salad for greater numbers of people.
Table 1 should contain amounts where you have added fewer than 10 quarts of blueberries to the salad.
Table 2 should contain amounts of blueberries between 10 and 50 quarts.
Table 3 should contain amounts of blueberries greater than 100 quarts.
Lesson 10: The Structure of Ratio Tables—Additive and Multiplicative
Date: 9/24/14
S.37
© 2013 Common Core, Inc. Some rights reserved. commoncore.org
This work is licensed under a
Creative Commons Attribution-NonCommercial-ShareAlike 3.0 Unported License.
Table 1
Quarts of Blueberries Quarts of Strawberries
Table 3
Quarts of Blueberries Quarts of Strawberries
Table 2
Quarts of Blueberries Quarts of Strawberries
- 2. NYS COMMON CORE MATHEMATICS CURRICULUM Lesson 10 6• 1
a. Describe any patterns you see in the tables. Be specific in your descriptions.
b. How are the amounts of blueberries and strawberries related to each other?
c. How are the values in the blueberries column related to each other?
d. How are the values in the strawberries column related to each other?
Lesson 10: The Structure of Ratio Tables—Additive and Multiplicative
Date: 9/24/14
S.38
© 2013 Common Core, Inc. Some rights reserved. commoncore.org
This work is licensed under a
Creative Commons Attribution-NonCommercial-ShareAlike 3.0 Unported License.
- 3. NYS COMMON CORE MATHEMATICS CURRICULUM Lesson 10 6• 1
e. If we know we want to add 7 quarts of blueberries to the fruit salad in Table 1, how can we use the table to
Lesson 10: The Structure of Ratio Tables—Additive and Multiplicative
Date: 9/24/14
S.39
© 2013 Common Core, Inc. Some rights reserved. commoncore.org
This work is licensed under a
Creative Commons Attribution-NonCommercial-ShareAlike 3.0 Unported License.
help us determine how many strawberries to add?
f. If we know we used 70 quarts of blueberries to make our salad, how can we use a ratio table to find out how
many quarts of strawberries were used?
- 4. NYS COMMON CORE MATHEMATICS CURRICULUM Lesson 10 6• 1
Exercise 1
The following tables were made incorrectly. Find the mistake that was made, create the correct ratio table, and state
the ratio that was used to make the correct ratio table.
Hours Pay in dollars
Blue Yellow
Lesson 10: The Structure of Ratio Tables—Additive and Multiplicative
Date: 9/24/14
S.40
© 2013 Common Core, Inc. Some rights reserved. commoncore.org
This work is licensed under a
Creative Commons Attribution-NonCommercial-ShareAlike 3.0 Unported License.
a.
Hours Pay in dollars
3 24
5 40
7 52
9 72
Ratio _________________________
b.
Blue Yellow
1 5
4 8
7 13
10 16
Ratio _________________________
- 5. NYS COMMON CORE MATHEMATICS CURRICULUM Lesson 10 6• 1
Lesson 10: The Structure of Ratio Tables—Additive and Multiplicative
Date: 9/24/14
S.41
© 2013 Common Core, Inc. Some rights reserved. commoncore.org
This work is licensed under a
Creative Commons Attribution-NonCommercial-ShareAlike 3.0 Unported License.
Lesson Summary
Ratio tables are constructed in a special way.
Each pair of values in the table will be equivalent to the same ratio.
You can use repeated addition or multiplication to create a ratio table.
There is a constant value that we can multiply the values in the first column by to get the values in the second
column.
red white
3 x4 12
6 x4 24
12 x4 48
21 x4 84
If you add a certain number to each entry in one column, you may not be able to add that same number to the
entries in the other column and keep the same ratio. Instead, the numbers you add to the entries must be related
to the ratio used to make the table. However, if you multiply the entries in one column by a certain number, you
can multiply the entries in the other column by the same number, and the ratio remains.
- 6. NYS COMMON CORE MATHEMATICS CURRICULUM Lesson 10 6• 1
Lesson 10: The Structure of Ratio Tables—Additive and Multiplicative
Date: 9/24/14
S.42
© 2013 Common Core, Inc. Some rights reserved. commoncore.org
This work is licensed under a
Creative Commons Attribution-NonCommercial-ShareAlike 3.0 Unported License.
Problem Set
1.
a. Create a ratio table for making lemonade with a lemon juice-to-water ratio of 1:3. Show how much lemon
juice would be needed if you use 36 cups of water to make lemonade.
b. How is the value of the ratio used to create the table?
2. Ryan made a table to show how much blue and red he mixed to get the shade of purple he will use to paint the
room. He wants to use the table to help him make larger and smaller batches of purple paint.
blue red
12 3
20 5
28 7
36 9
a. What ratio was used to create this table? Support your answer.
b. How are the values in each row related to each other?
c. How are the values in each column related to each other?