1. A SUSTAINABILITY INDEX FOR WATER RESOURCES:
LANDSCAPE IRRIGATION
Michael Igo, P.E., D.WRE, LEED A.P., C.I.D., Irrigation Consulting, Inc.
Master of Science, Tufts University School of Engineering, 2006
From Theory of Games and Economic Behavior Water Resources Sustainability Index Model Control Space
ABSTRACT (von Neumann & Morgenstern, 1944) Dependency
on Resources
"The great progress in every science came when, in the study of problems which were modest as Outside
Sustainability means different things to different design professionals and Roof Runoff:
Conveyed to Weather Sensing: Control Space
Storage Facility
organizations. There are many accepted models and definitions with the most compared with ultimate aims (such as defining Sustainability), methods were developed which could Adjusts Irrigation on
Real-Time Climate
prevalent including three dimensions to consider for sustainable development: be extended further and further”
Irrigation Controls:
Increased Capability
economy, society, and environment. Sustainable designers seek to optimize “The sound procedure to systematically describe everything economic (or Sustainable) is to obtain for Maximum Savings
projects in this context. This paper attempts to fit a standardized numerical first utmost precision and mastery in a limited field, and then to proceed to another, somewhat wider Electric Power:
Purchased from
model of each dimension into accepted definitions of sustainability and achieving one, and so on” Proposed Landscape:
Soil-Plant-Air
Continuum Model
Grid to Power
Irrigation Equipment
Determined by
an aggregate Sustainability Index, S, for design alternative comparisons. “The experience of more advanced sciences, for example physics, indicates that this impatience to
Landscape Architect
and Owner
(See Insert Close Up)
Landscape irrigation is a prevalent design consideration from a water resources describe a larger, unifying theory of economics (or Sustainability) merely delays progress”
development perspective. General irrigation concepts have been simplified to Domestic Water:
Purchased to
create the framework for measuring S. Spreadsheet modeling estimates Therefore, before embarking on a Sustainability Index, we need to:
Makeup
Harvested Water
long-term irrigation performance associated with the three dimensions of
sustainability for many design alternatives. Design alternatives with the lowest S Start Simple, Understand Simple Cases Fully, Then Slowly Add Complexity
values are estimated to be the most sustainable for water consumption. The
index presented here is merely a starting point towards a new optimization of Landscaping Irrigation Design allows us to do just that in a Overland Runoff:
Conveyed to
water resource consumption. "Model Control Space" Storage Facility
Water Harvesting
Storage Facility:
Runoff Overflow to
Varied for
Storm Sewer: Varies
Cost-Benefit Analysis
AGGREGATION OF STANDARDIZED STANDARDIZATION AND LINEARIZATION (FROM 0 TO 1) OF GENERALLY ACCEPTED THREE DIMENSIONS OF SUSTAINABILITY Based on Size of
Storage Facility
SUSTAINABILITY DIMENSIONS WORST AND BEST CASE SCENARIOS FROM REDEFINED FOR THIS NUMERICAL MODEL
BY ACCEPTED DEFINITIONS OF SUSTAINABILITY: TABULATED QUANTITIES FROM SPREADSHEET MODEL
Electrical Demand
DEVELOPMENT OWNERS MUST VALUE EACH DIMENSION EQUALLY: The amount of natural resources required to sustain the
for Irrigation Pump:
ENVIRONMENT, x Factored into
development as originally intended over its life-cycle. In Economic Analysis
SUSTAINABLE DEVELOPMENT DEVELOPMENT TODAY: 0 ENVIRONMENT STANDARDIZED VARIABLE, CAPITAL X 1 (LIFE SUSTAINING) this case, the amount of potable water used for
EQUAL VALUATION UNEQUAL PREFERNCES GALLONS OF WATER irrigation that could be used for drinking, washing, etc.
Zero Potable Water Maximum Water Used in a
SOCIETY Consumed for Base Case: Poor Efficiency
SOCIETY
Landscape Irrigation No Weather Sensing, Etc. The amount or level of the development as a social
SOCIETY, y Irrigation Controls:
Soil-Plant-Air Continuum
resources. In this case, maintaining the landscape as
Plant Vulnerability Curve · ET Based
(SPAC) Model
ECONOMY
0 SOCIETY STANDARDIZED VARIABLE, CAPITAL Y 1 (USE SUSTAINING) originally intended requires plants to be healthy. Thus,
life-cycle plant health (the "use" of the irrigation system) (Measuring Visual Plant Health)
·
·
Soil Moisture
Constant Rate
VISUAL PLANT HEALTH
Plants Retain Perfect Soil Reaches Permanent indicates the quantifiable efficacy of the development.
ENVIRONMENT
ECONOMY Health and Turgid Wilting Point: Irrigated Irrigation Delivery:
ENVIRONMENT · Sprinkler
Vascular Tissue at All Times Landscape Dies · Drip
THEREFORE, BY VALUING EACH DIMENSION EQUALLY, ECONOMY, z The amount of net monetary resources required to · None
sustain the development as originally intended. In this
DIRECT AGGREGATION OF THE DIMENSIONS ARE POSSIBLE, SUCH THAT
A SUSTAINABILITY INDEX, S, FOR EACH DESIGN, i CAN BE DEFINED BY:
0 ECONOMY STANDARDIZED VARIABLE, CAPITAL Z 1 (MONEY SUSTAINING) case, the initial capital cost of installation plus the
LIFE-CYCLE COST inflation-adjusted costs of potable water and electricity.
Zero Net Life-Cycle Cost Equivalent Monetary Cost to
Si = Xi + Yi + Zi BEST CASE = 0 Landscape Type
Achieved Through a Replace Plants that Irrigation from Architects with
WORST CASE = 3 Variety of Harvesting Techniqes is Watering (System Failure)
Root Zone Depth
Irrigation Water
Supply Resources
(See Above)
Example External Theoretical:
Model of Development as Soil Type:
INTERPRETATIONS OF SUSTAINABILITY INDEX Cellular Organism using
Social Resources:
Loss of Site Attractiveness,
Assumed for Analyses
Irrigation Efficiency
and Uniformity of
·
·
·
Field Capacity
Wilting Point
Effective Precipitation
Sustainability Index Utility and Desirability to Visit, Reaching Root Zone
Decreased Safety Model Control Space
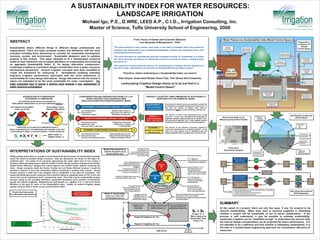
Plotting design alternatives on a graph of environmental (X) and economic (Z) standardized variables
shows the extent of possible design scenarios. Only two dimensions are shown on this figure for S = 3: Maximum Add Net Irrigation to Soil
Add Gross Irrigation to
MINUS
graphical ease. The extent of all scenarios approaching the origin (ideal case at 0,0) creates a External Resources Required; Water Consumed YES Irrigation
ET
Inter-Linkages Between "Certainly Not Sustainable"; End (Harvested or Purchased) for Plants Start
Decision: Subtotal
boundary within the design space called the Pareto Frontier. Design solutions residing on the frontier Sustainability Dimensions
Day #1
Based on Soil
Climate Day #1
SOCIETY Soil Data Soil
Moisture
exhibit Pareto Efficiency: designs that cannot improve one benefit further without worsening the Demonstrating Inter-Dependece Moisture Maintain Subtotal Controller Effective Moisture
other. Design scenarios inside the Pareto Frontier are not Pareto Efficient because it would be
EXAMPLE:
Purchasing with Cash (- Z)
Y Project S-Index 3 > S > 0:
Some Dependency on
Soil Moisture
(No Water Consumed)
NO Type Rain
PLUS
possible to improve X (use less freshwater) without worsening Z (costing more money). Pareto Domestic Water for Irrigation (- X) Outside Resources;
to Improve Landscape (+ Y) "Likelihood of Sustainability" Carry to Next Day
Frontier analysis is valid only if the marginal rate of substitution is the same for everybody. This of Simulation
Higher with Lower S-Values
means that landscape owners using this chart would be willing to substitute some of X for Z and vice ENVIRONMENT ECONOMY Add Net Irrigation to Soil MINUS
Extent of Available Resources
versa if the overall “satisfaction level” remained the same. This holds true for sustainability analysis
X Z S = 0: No External Add Gross Irrigation to
Expected to Reduce Over Time
Resources Required; Water Consumed YES Irrigation
ET
because, based on the accepted definitions, sustainable developers must consider all dimensions "Certainly Sustainable";
End
Day #2
(Harvested or Purchased)
Decision: Subtotal
for Plants
Climate
Start
Day #2
Soil
equally and without weighting. Maximizing the total benefit (i.e., addition of X, Y, and Z) by Pareto Self-Sustaining Soil Based on
Controller Moisture
Data Soil
Moisture Maintain Subtotal Effective Moisture
Efficiency is the goal for users of the Sustainability Index. Ideally, an optimal irrigation design PROJECT Type
Soil Moisture NO Rain
solution will arise when a “knee” occurs on the Pareto Frontier. Example External DEVELOPMENT Example External (No Water Consumed)
PLUS
Environmental Resources: Economic Resources:
Domestic Water, Runoff, Cash, Loans, Credit to Continue Simulation for 25 Year of Climate Data, Tabulating:
Loss of Deep Infiltration Cover Operating Expenses x = Potable Water Used (Gallons) Discretized Spreadsheet
Pareto Chart Generated NOTE: Society Score, Y
y = Relative Percentage of Perfect Plant Health (%)
Equals 0.0 for all Scenarios Model of Sustainability SPAC Simulation
from Simulation Spreadsheet (Perfect Plant Health)
Designers Cannot Extent of Available Resources Expected to z = 25-Year Life-Cycle Cost (Currency, $)
Index over Time with CONTROL Resource Shrink Over Time due to: Inflation,
Shrinking Resources Availability, but can Climate Change, Regulation, Natural Disaster
MITIGATE the Effects (See Model Below)
S=3
Available External Expected Gradual Decrease Rare, but Possible Sudden
SUMMARY
Decrease in Resources
SUSTAINABILITY INDEX, S
Resources at of Resources over Time
Varying Irrigation Controls and Project Start (Inflation, Climate, etc.) (Earthquake, Drought, etc.) At the outset of a project, there are very few ways, if any, for projects to be
Rainwater Harvesting Tank Sizes
SA < SB assured sustainability. Many tools exist to exercise judgment in estimating
Project "A" is whether a project will be sustainable or not to advise stakeholders. If the
B B "More Likely to be process is well understood, it may be possible to estimate sustainability.
Pareto Frontier Project B Trajectory (S = SB)
(Maximum Efficiency)
Sustainable" than Landscape irrigation can be “simplified enough” to understand the process fully
Project "B"
Lowest Index the internal design considerations can be projected for future performance. S is
(Best) at S = 0.36: Project A Trajectory (S = SA)
X = 0.2, Y = 0.0, Z = 0.16 A A not intended to be a definitive and final solution in estimating sustainability: it is
S=0 the start of a system-based engineering approach for consumption efficiency of
Project resources.
0 TIME SCALE
Life-Cycle