1. 1
CHAPTER 1
INTRODUCTION
1.1 INDUSTRY PROFILE
The Indian textile industry has its roots going back several thousand
years. After the industrial revolution in Europe, this sector in India also saw its
growth of an industrial complex. Today the industry contributes around 14
percent to industrial production in the country. It is estimated to directly employ
approximately 35 million people, it accounts to 27 percent of the country’s
exports, and in sum, an important economic engine for the nation.
The size of our Indian textile industry is estimated at Rs.1, 24,000
Crores constituting seven percent of the GDP. The industry has fair global
exposure. Textile exports constitute about 35 percent of the total foreign
exchange earnings of the country.
During the last 10 years, the industry’s actions, government policies as
well as market events have begun to converge, providing several growth
opportunities for the sector domestically as well as in the global market. The
deficiencies of the industry can be broadly classified into three heads: the first
being the gaps in the industry due to fragmented structure and dominance of
small industry, the second are the regulatory disadvantages like the historical
2. 2
reservation of manufacturing for very small companies and the third being the
disadvantages India faces as a country.
In this prevailing situation, building state-of-the-art technology,
liberalizing the government controls and regulations, adoption of latest
management tools and techniques, good technical education for developing the
right king of resources are required to attain and sustain a pre-eminent global
standing.
1.2 COMPANY PROFILE
Cibi International was established in 1988 in the heart of the knitwear
city of South India-Perundurai, as a Fashion house for the manufacture of export
of Textile garments, today it is a fully integrated unit with machines to match
global standards.
The company is located in perundurai at about 20 kms from Erode
railway station and about 80 kms from the Coimbatore airport. The factory area
covers about 10,000sq.ft and it has a processing capacity of 10,000 ps/day .The
present project cost is Rs.75 Crs and turnover is nearly about Rs.120Crs.
To produce quality goods on time, a good production facility, capable
of taking up any challenge is needed. In this regard, Cibi International possesses
the best infrastructure that has the ability and potential to give quality products.
3. 3
All the machines are the latest available in the market, and whenever
required, the company has never shied away from purchasing the most modern
equipments. All their divisions are equipped with the latest equipments to
maintain the quality and timeliness of the output.
The manufacturing process has been vertically integrated to facilitate
all the processes involved in garment manufacture under one roof. This enables
the company to reduce the time spent in completing the order.
The company started with the sole export of knitted garments to USA
and later extended its reach to Europe, Australia, New Zealand and Canada.
The company primarily exports Knitwear’s and woven wears.
Knitwear’s include T-shirts, Polo’s, Pyjamas etc., while woven wears comprise of
Bermudas, Shirts, Work wears etc.
The plant has the capability to meet any level of demand from their
buyers and thus creating a high degree of credibility to the company, in
international markets.
With the in-house production capacity of over 10000 pieces per day,
the company has been consistently able to be on top of the garments export
market. Besides this, the company’s garment production is supplemented by
various companies which can turn out around 15000 pieces per day. It may be
worthwhile to note here that all these products are subjected to thorough
checking by the company’s Quality Assurance Department Personnel.
4. 4
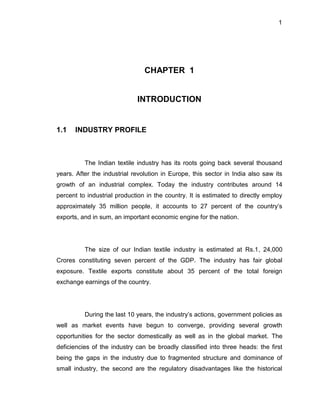
CHART 1.1.1 ORGANISATION STRUCTURE
MANAGING
DIRECTOR
G.M
(FINANCE)
G.M.
(QUALITY CONTROL)
MANAGER
(ADMIN)
MANAGER
(ACCOUNTS)
MANAGER
(PRODUC)
MANAGER
(Q.C)
PERSONNEL
OFFICER
ACCOUNTS
OFFICER
SUPERVISOR
Q.C
INSPECTOR
PERSONAL
ASSISTANTS
CLERK
LINE
SUPERVISOR
LINE
INSPECTOR
G.M.
(PRODUCTION)
5. 5
CHART 1.1.2 PRODUCTION CHART
Merchandising
Pattern Making
Cutting
Tailoring
Checking
Ironing
Trimming
Packing
6. 6
1.3 CONCEPTUAL BACKGROUND
The facilities provided for the workmen in their organization definitely
have a physical and psychological effect on them. Based on this, the problems
are found to be in different dimensions. Due to inadequate welfare facilities there
leads to an increase in health and personal problems.
1.3.1 WORKING CONDITIONS
Working conditions under which the employees are exposed play a
vital role in the relationship between the employee and the management. The
factors like shift timings, workload and the environment under which the workers
are put in kindles the spirit of the employees. The main aim of factories act is to
protect human beings subjected to unduly long hours of bodily strain or mental
work, in order to see that, employers carry out the provisions of the act for the
well being of the workers. Government has appointed inspectors who make
periodical visits to Industries for check - up.
The risks faced by the employees causes injuries in the working place
everyday which may even cause inability to work for the rest of his/her life. This
may be due to the lack of good safety measure, dust and fumes control, noise
control or sufficient space for movement in the working place or lack of
cleanliness or insufficient air circulation or inadequate lighting facilities.
The working conditions include cleanliness, lighting facilities or
proper illumination, ventilation or proper air circulation, work space, safety
measure, noise control, dust and fumes control.
7. 7
The safe working conditions include,
a. Good house keeping
b. Good air circulation
c. Adequate lighting
d. Good work schedule
e. Providing safety devices
f. Properly guarded equipments
g. Safe storage
Definition of working conditions
The modern concept of Industrial healthy working condition is referred
to as the health, which is the outcome of the interaction between the individual
and his environment. The modern concepts anticipate and recognizes potentially
harmful situation and applies engineering control measure before series of injury
results.
According to the joint ILO/WHO committee (1987), Healthy Industrial
working conditions are
i) The prevention and maintenance of physical, mental and social
well being of workers in all occupations.
ii) Prevention of ill-health among workers caused by working
conditions.
iii) Protection of workers in their employment from risks resulting from
factors to health and
iv) Placing and maintenance of the workers in an occupational
environment adapted to his physical and psychological equipment.
8. 8
1.3.1.1 Cleanliness
According to sec 11 of the factories act 1948, every room must be
kept clean from effluvia arising from any drain, privy, or other nuisance. The floor
must be kept clean and there should not be any accumulation of dirt anywhere in
the working place, which affects the health condition of the workers as well as the
quality of the product. The act states that, the floor must be cleaned at least
once in a week by washing and using disinfectors, effective drainage, regular
repainting or revarnishing the inside wall and partitions, white washing or colour
washing of the company. This may be done at least once every 14 months.
Therefore, poor housekeeping will lead to an adverse effect on health of the
workers and productivity.
1.3.1.2 Lighting
According to sec 17 of the factories act 1948,in every part of a factory
where workers are working or passing, there shall be provided sufficient and
suitable lighting, natural or artificial, or both. All the glass windows and lights
must be kept clean on both inner and outer surfaces. Effective measures must be
taken for prevention of glass and formation of shadows, which may cause any
strain, and risk of accidents. Therefore it is most important for an organization to
provide good quality of lighting facilities in order to reduce accidents and make
the workers to perform their duties efficiently without any distraction.
9. 9
1.3.1.3 Ventilation
In the textile industries, ventilation plays a vital role. It is common that
the textile industries are polluted due to cotton flying all over. The workers suffer
from restless and suffocation and various disease of the type due to the polluted
air. So, the need for adequate ventilation has become important. According to
the factory rule 1950,”In every factory, the amount of ventilating openings in a
work room below the caves shall, except where mechanical means of ventilation
as required by sub rule(2) are provided, be often aggregate area not less than
15% of the floor area and so located as to afford the continued supply of fresh
air”.
1.3.1.4 Work Space
Over crowding in factories, where power and machine are made use
of is likely to cause accident to workers. For efficient production also,
overcrowding is not healthy. While the worker is in the process of doing his work,
there should not be any disturbance due to the transportation of materials due to
his co-workers. So, minimum required space must be allotted for each worker to
work peacefully. According to sec16 “there should be 350cubic feet of the space
for each worker employed in factories which where started before 1948 and at
least 500 cubic feet of space for every worker employed in factories which were
started after 1948”.
10. 10
1.3.1.5 Safety Measure
For the purpose of the prevention of accidents and for the safety of
the workers, effective measures should be taken to safeguard the workers. The
machineries should be fenced and while the machine is in motion, there must not
be any distraction. Fire fighting equipments should be provided sufficiently in all
the areas of production. In textile industries machines must be provided with iron
wire fencing and individual mechanical and electrical means of starting and
stopping of such machines.
1.3.1.6 Noise Control
In the case of machines, which generate enormous noise, it is tedious
for the worker to work continuously for a long period. It will damage the ear
drums of the worker. So, the noise should not divert the concentration of the
worker.
1.3.2 LABOUR WELFARE
“Labour welfare” is an important facet of industrial relations, giving
satisfaction to the worker for which there is no other way of compensation.
Modern welfare may be said to have been the outcome of the movement for
better & more efficient management in industry including human angle.
11. 11
The acceptance of the concept Labour welfare all over is mainly due to
(i) The need to provide better life for the workers & to maintain goodwill
among the employees & to increase the productivity
(ii) Growing public & government concern, especially in the economically less
developed countries, over the amelioration of the working & living
conditions of industrial workers as an aspect of national policy.
(iii) Steps to promote labour welfare has become a direct recognition of the
situations like expansion in the advanced countries of the world and
concomitant process of mass production and mass selling rendering the
working class as a source of power.
Labour welfare services may be classified as
a. Intramural and b. Extramural
Intramural services are those, which are provided within the factory
like safety, health and counseling services.
Extramural services are those, which are provided within the factory
like education, housing, transport, recreation etc.
Definition Labour Welfare
Labour welfare is defined as “Efforts to make life worth living for
workmen”. The voluntary effort on the part of the employer to improve the
conditions of employment in the factories forms the scope of labour welfare
efforts. The efforts to initiate the welfare facilities have their origin either in some
statue formed by the state or in some local customer in a collective agreement
or in the employer’s own initiative.
12. 12
1.3.2.1 Welfare Facility
The welfare facilities are
1. Drinking water facilities
2. Latrines and urinals
3. Washing facility
4. First aid facility
1.3.2.2 Drinking Water Facility
According to Factories Act 1948, every organization must provide
adequate drinking water facility invariably to all the employers. It must be placed
with in the department.
1.3.2.3 Latrines and Urinals
Section 19 deals with Latrines and Urinals “In every factory, sufficient
latrine and urinal accommodation of prescribed types shall be provided
conveniently situated and accessible to male and female workers at all times
while they are in the factory”.
1.3.2.4 Washing Facility
According to Section 42 every factory should provide adequate and
suitable washing facilities for male and female workers.
13. 13
1.3.2.5 First Aid Facility
Adequate first aid facility must be provided for the workers in an
organization. Injuries are caused every day and there fore prescribed medicines
and equipments must compulsorily be kept in the first aid box. Whenever the
employer is insured he must be provided first aid treatment and for that purpose,
first aid box must be provided for every one hundred and fifty workers.
1.3.3 REST ROOM FACILITIES
According to section 47, every factory that has more than 150
employees, who are ordinarily employed, there should be a rest room with the
drinking water facility. Therefore it is important to maintain the rest room clean
and tidy and there should be good ventilation.
1.3.4 CANTEEN FACILITIES
According to section 46, for the factory, which has more than two
hundred and fifty workers who are ordinarily employed, there should be a
canteen for the workers. Hence, it is necessary to provide hygienic food with
good quality at a considerable price.
1.3.5 MEDICAL FACILITIES
There must be a hospital within one-kilometer distance from the
factory which the organization should keep in touch for the treatment of the
14. 14
employee. If there is no hospital, then organization should provide separate
medical room.
1.4 NEED FOR THE STUDY
There is a great need for good working condition in an industry. The
improved working condition leads to improved productivity. Some of the basic
reasons for the need for good working conditions are : to increase the loyalty of
the employees towards the organization, to reduce injuries due to bad working
conditions of machineries, to increase productivity, to reduce resistance due to
change, enhancing employees interest towards work, to reduce absenteeism
and tardiness, to strengthen the morale and employee commitment.
The working conditions include cleanliness, lighting facilities or proper
illumination, ventilation or proper air circulation, work space, safety measure,
noise control, dust and fumes control.
It is necessary to improve the conditions of the workers, which will
ultimately lead to high production, and the progress of the country.
It is necessary to save the workers from evils, to increase efficiency of
the workers and to make the country more prosperous. For building up a stable
and efficient labour force, it is essential labour force, it is essential to bring about
a marked improvement in the conditions of the worker’s life and work. For
achieving maximum result, welfare activities have to be under taken in the right
spirit mainly with a view to make the lives of the workers happier and healthier.
15. 15
An employee feels secure when he is placed in organization, which
cares for the welfare of the labourers, and this cares a paternalistic feeling of
them.
1.5 REVIEW OF LITERATURE
Man-Made textiles research organisation(MANTRA) gives top priority
for developing welfare facilities and caters to the multifarious needs of the
industries. It’s primarily aimed at planned and healthy growth of the employees of
the decentralized textile industries. MANTRA has undertaken research on such
areas as pollution control, mechanical and wet processing. Some of the on-going
projects are effluent treatment and cleanliness of drinking water. It’s researches
have proved that good welfare facilities are a must in every organisation.
Peter Rogers Chairman, The strategic forum for construction has taken
up research in industries and have concluded that unsafe, disorganized and dirty
organizations lead to poor standards and settling for a compromise in the needs
mean risking of lives. Spending more on prelims to provide good access, security
and welfare facilities creates a safe working environment, often with reduced
accidents and incident rates and a motivated workforce.
The National Research and Development Centre for Welfare and
Health, Stakes is a society for all–network situated in United Nations. It’s findings
have proved that the facilitation and the integration of the welfare needs of the
people of the organisation, encourage the morale of the workforce of the nation.
16. 16
CHAPTER 2
OBJECTIVES OF THE STUDY
1. To study the welfare facilities existing in the organization.
2. To study the worker’s satisfactory level of labour welfare facilities at Cibi
International.
3. To make constructive suggestions to improve the welfare.
17. 17
CHAPTER 3
RESEARCH METHODOLOGY
3.1 RESEARCH DESIGN
The study adopts descriptive research method. The major purpose of
descriptive research is description of the state of affairs as it exists at present.
The methods of research utilized in descriptive research are survey methods.
The facts and information collected are analysed to make a critical evaluation of
the material.
3.2 SAMPLING DESIGN
i. Area of Study
Cibi International is a textile mill, which has been selected to study the
level of satisfaction of labour welfare facilities.
ii. Sampling unit
Here the lower levels of employees are surveyed and each individual
employee is the sampling unit.
18. 18
iii. Sampling procedure
Out of the total population of 570 employees a sample of 200
respondents are selected for the study. The sampling done randomly according
to stratified quota random sampling.
Strata Population Sample
Cutting & Pattern making 30 11
Stitching 210 74
Checking 135 47
Ironing $ Packing 175 61
Administration 20 7
Total 570 200
Rating Scale
The most commonly used method for study on effectiveness is rating
scale. Under it, a printed form, one for each person to be rated. The traits are
analysed and evaluated on a continuous scale. A ready comparison of scores
among the employees is possible. When ratings are objectively given, they can
provide useful feedback.
19. 19
3.3 DATA COLLECTION
i. Source of Data
The sources were both primary and secondary sources. Primary data
have been collected by means of interview and schedule. The administered
questionnaire consists of particulars like personal profile, working conditions,
welfare facilities, canteen facilities, restroom facilities and medical facilities.
The secondary sources of information regarding details of welfare
facilities and social security has been gathered from various books. Details were
also collected from company books.
ii. Data Collection Method
Fieldwork is actual data collection operation. Data is collected through
interview, schedule and questionnaire method. The respondents were asked to
reveal their opinion regarding the satisfaction level of various welfare facilities
provided by the company. The various departments are grouped as per their
activities.
20. 20
3.4 TOOLS USED FOR ANALYSIS
Simple percentage calculation and chi-square analysis are the
statistical tools used for the analysis.
3.5 LIMITATIONS OF THE STUDY
The sample of respondents belongs to a single organisation i.e.
CIBI International. Therefore, the result of the study cannot be
generalized to other organisations.
The attitude of the workers change from time to time. Hence, the
result of the project may not be applicable in long run.
Due to a limited duration, a detailed and a comprehensive study
could not be made.
21. 21
CHAPTER 4
ANALYSIS AND INTERPRETATIONS
4.1 ANALYSIS OF DATA
TABLE 4.1.1
AGE LEVEL OF THE RESPONDENTS
S.No. Age Level No. of
Respondents
Percentage
1 Below 20 97 48.5
2 20-25 53 26.5
3 Above 25 50 25.0
Total 200 100.0
INFERENCE
From the above table it is inferred that 48.5% of the respondents
belong to the age level below 20 years, 26.5% of the respondents belong to the
age level of 20-25 years and 25.0% of the respondents belongs to the age level
of above 25 years.
23. 23
TABLE 4.1.2
GENDER OF THE RESPONDENTS
S.No. Sex No. of
Respondents
Percentage
1 Male 145 72.5
2 Female 55 27.5
Total 200 100.0
INFERENCE
It is found from the above table that 72.5% of the respondents belong
to male category and 27.5% of the respondents belong to female category.
25. 25
TABLE 4.1.3
EDUCATIONAL QUALIFICATION OF THE RESPONDENTS
S.No. Educational
Qualification
No. of
Respondents
Percentage
1 Upto 5th Std. 96 48.0
2 6th -12th std. 39 19.5
3 College level 65 32.5
Total 200 100.0
INFERENCE
From the above table it is found that 48.0% of the respondents
are qualified upto 5th std. level, 32.5% of the respondents are qualified upto
college level and 19.5% of the respondents are qualified upto 6th-12th std. level.
27. 27
TABLE 4.1.4
EXPERIENCE OF THE RESPONDENTS
S.No. Experience No. of
Respondents
Percentage
1 Below 1 years 56 28.0
2 1 – 3 years 52 26.0
3 Above 3 years 92 46.0
Total 200 100.0
INFERENCE
It is found from the above table that out of 200 respondents, 46.0% of
the respondents have an experience of above 3 years, 28.0% of the respondents
have an experience below 1 year and 26.0% of the respondents have an
experience within 1-3 years.
29. 29
TABLE 4.1.5
MARITAL STATUS OF THE RESPONDENTS
S.No. Marital Status No. of
Respondents
Percentage
1 Married 106 53.0
2 Single 94 47.0
Total 200 100.0
INFERENCE
It is found from the above table that out of 200 respondents, 53.0% of
the respondents are married and 47.0% of the respondents are single.
31. 31
TABLE 4.1.6
MONTHLY INCOME OF THE RESPONDENTS
S.No. Monthly Income No. of
Respondents
Percentage
1 Upto Rs. 1000 66 33.0
2 Rs.1000-Rs.1500 49 24.5
3 Above Rs. 1500 85 42.5
Total 200 100.0
INFERENCE
It is found from the above table that out of 200 respondents, 42.5% of
the respondents are getting a monthly income in the range of above Rs.1500,
33.5% of the respondents are getting a monthly income in the range of below
Rs.1000 and 24.5% of the respondents are getting a monthly income in the
range of Rs.1000 – Rs. 1500.
33. 33
TABLE 4.1.7
NUMBER OF DEPENDENTS OF THE RESPONDENTS
S.No. No. of Dependents No. of
Respondents
Percentage
1 Upto 3 members 46 23.0
2 4 members 34 17.0
3 Above 4 members 120 60.0
Total 200 100.0
INFERENCE
It is found from the above table that out of 200 respondents, 60.0% of
the respondents are having their family size of above 4 members, 23.0% of the
respondents are having their family size of upto 3 members and 17.0% of the
respondents are having their family size of 4 members.
34. 34
4.2 HYPOTHESIS TESTING
AGE AND LEVEL OF SATISFACTION OF WELFARE MEASURES
Null hypothesis:
There is no significant relation between age and level of satisfaction of
welfare facilities.
Alternate hypothesis:
There is close significant relation between age and level of
satisfaction of welfare facilities.
TABLE 4.2.1
AGE AND LEVEL OF SATISFACTION OF WELFARE FACILITIES
Age group
(in years)
Level of Satisfaction of
Welfare Facilities
Total
Low Medium High
Below 20 15 22 60 97
20-25 11 31 11 53
Above 25 11 15 24 50
Total 37 68 95 200
35. 35
CHI - SQUARE ANALYSIS
Calculated 2 value = 26.393
Degree of freedom = 4
Table value = 9.488
Significant result = Significant at 5% level
Conclusion
It is found from the above analysis that calculated chi-square value
greater than the table value at 4 degree of freedom. So, Null Hypothesis (H0)
rejected. Hence, we conclude that, there is close significant relation between age
and level of satisfaction of welfare facilities.
36. 36
GENDER AND LEVEL OF SATISFACTION OF WELFARE FACILITIES
Null hypothesis:
There is no significant relation between gender and level of
satisfaction of welfare facilities.
Alternate hypothesis:
3
There is close significant relation between gender and level of
satisfaction of welfare facilities.
TABLE 4.2.2
GENDER AND LEVEL OF SATISFACTION OF WELFARE FACILITIES
Gender
Level of Satisfaction of
Welfare Facilities Total
Low Medium High
Male 25 57 63 145
Female 12 11 32 55
Total 37 68 95 200
37. 37
CHI - SQUARE ANALYSIS
Calculated 2 value = 6.647
Degree of freedom = 2
Table value = 5.991
Significant result = Significant at 5% level
Conclusion
It is found from the above analysis that calculated chi-square value
greater than the table value at 2 degree of freedom. So, Null Hypothesis (H0)
rejected. Hence, we conclude that, there is close significant relation between
gender and level of satisfaction of welfare facilities.
38. 38
EDUCATIONAL QUALIFICATION AND LEVEL OF SATISFACTION OF
WELFARE FACILITIES
Null hypothesis:
There is no significant relation between educational qualification and
level of satisfaction of welfare facilities.
Alternate hypothesis:
There is close significant relation between educational qualification
and level of satisfaction of welfare facilities.
TABLE 4.2.3
EDUCATIONAL QUALIFICATION AND LEVEL OF SATISFACTION
OF WELFARE FACILITIES
Educational
qualification
Level of Satisfaction of
Welfare Facilities
Total
Low Medium High
Upto 5th Std. 10 40 46 96
6th -12th std. 13 12 14 39
College level 14 16 35 65
Total 37 68 95 200
39. 39
CHI - SQUARE ANALYSIS
Calculated 2 value = 13.476
Degree of freedom = 4
Table value = 9.488
Significant result = Significant at 5% level
Conclusion
It is found from the above analysis that calculated chi-square value
greater than the table value at 4 degree of freedom. So, Null Hypothesis (H0)
rejected. Hence, we conclude that, there is close significant relation between
educational qualification and level of satisfaction of welfare facilities.
40. 40
EXPERIENCE AND LEVEL OF SATISFACTION OF WELFARE
FACILITIES
Null hypothesis:
There is no significant relation between experience and level of
satisfaction of welfare facilities.
Alternate hypothesis:
There is close significant relation between experience and level of
satisfaction of welfare facilities.
TABLE 4.2.4
EXPERIENCE AND LEVEL OF SATISFACTION
OF WELFARE FACILITIES
Experience
Level of Satisfaction of
Welfare Facilities
Total
Low Medium High
Below 1 years 17 15 24 56
1 – 3 years 10 20 22 52
Above 3 years 10 33 49 92
Total 37 68 95 200
41. 41
CHI - SQUARE ANALYSIS
Calculated 2 value = 9.615
Degree of freedom = 4
Table value = 9.488
Significant result = Significant at 5% level
Conclusion
It is found from the above analysis that calculated chi-square value
greater than the table value at 4 degree of freedom. So, Null Hypothesis (H0)
rejected. Hence, we conclude that, there is close significant relation between
experience and level of satisfaction of welfare facilities.
42. 42
MARITAL STATUS AND LEVEL OF SATISFACTION OF WELFARE
FACILITIES
Null hypothesis :
There is no significant relation between marital status and level of
satisfaction of welfare facilities.
Alternate hypothesis:
There is close significant relation between marital status and level of
satisfaction of welfare facilities.
TABLE 4.2.5
MARITAL STATUS AND LEVEL OF SATISFACTION
OF WELFARE FACILTIES
Marital Status
Level of Satisfaction of
Welfare Facilities
Total
Low Medium High
Married 25 46 35 106
Single 12 22 60 94
Total 37 68 95 200
43. 43
CHI - SQUARE ANALYSIS
Calculated 2 value = 18.965
Degree of freedom = 2
Table value = 5.991
Significant result = Significant at 5% level
Conclusion
It is found from the above analysis that calculated chi-square value
greater than the table value at 2 degree of freedom. So, Null Hypothesis (H0)
rejected. Hence, we conclude that, there is close significant relation between
marital status and level of satisfaction of welfare facilities.
44. 44
MONTHLY INCOME AND LEVEL OF SATISFACTION OF WELFARE
FACILITIES
Null hypothesis:
There is no significant relation between monthly income and level of
satisfaction of welfare facilities.
Alternate hypothesis:
There is close significant relation between monthly income and level
of satisfaction of welfare facilities.
TABLE 4.2.6
MONTHLY INCOME AND LEVEL OF SATISFACTION
OF WELFARE FACILITIES
Monthly Income
Level of Satisfaction of
Welfare Facilities
Total
Low Medium High
Upto Rs. 1000 13 19 34 66
Rs.1000-Rs.1500 13 10 26 49
Above Rs. 1500 11 39 35 85
Total 37 68 95 200
45. 45
CHI - SQUARE ANALYSIS
Calculated 2 value = 11.157
Degree of freedom = 4
Table value = 9.488
Significant result = Significant at 5% level
Conclusion
It is found from the above analysis that calculated chi-square value
greater than the table value at 4 degree of freedom. So, Null Hypothesis (H0)
rejected. Hence, we conclude that, there is close significant relation between
monthly income and level of satisfaction of welfare facilities.
46. 46
NUMBER OF DEPENDANTS AND LEVEL OF SATISFACTION OF
WELFARE FACILITIES
Null hypothesis:
There is no significant relation between number of dependants and
level of satisfaction of welfare facilities.
Alternate hypothesis:
There is close significant relation between number of dependants and
level of satisfaction of welfare facilities.
TABLE 4.2.7
NUMBER OF DEPENDANTS AND LEVEL OF SATISFACTION
OF WELFARE FACILTIES
Number of
Dependants
Level of Satisfaction of
Welfare Facilities
Total
Low Medium High
Upto 3 members 12 16 18 46
4 members 10 13 11 34
Above 4 members 15 39 66 120
Total 37 68 95 200
47. 47
CHI - SQUARE ANALYSIS
Calculated 2 value = 9.963
Degree of freedom = 4
Table value = 9.488
Significant result = Significant at 5% level
Conclusion
It is found from the above analysis that calculated chi-square value
greater than the table value at 4 degree of freedom. So, Null Hypothesis (H0)
rejected. Hence, we conclude that, there is close significant relation between
number of dependants and level of satisfaction of welfare facilities.
48. 48
CHAPTER 5
FINDINGS
The following are the findings that could enlighten the Cibi
International workers level and quantity and quality of the workers
5.1 FINDINGS
Most (48.5%) of the respondents were belongs to the age level of
below 20 years
Maximum (72.5%) of the respondents were belongs to male
category.
Majority (48.0%) of the respondents were qualified upto 5th std.
level.
Most (37.0%) of the respondents were working in Stitching section.
Maximum (46.0%) of the respondents have experienced above 3
years.
Most (53.0%) of the respondents were married.
Maximum (42.5%) of the respondents were getting monthly salary
in the range of above Rs.1500.
Majority (60.0%) of the respondents were having their family size of
above 4 members.
49. 49
CHI-SQUARE FINDINGS
There is close significant relation between age and level of
satisfaction of welfare measures.
There is close significant relation between gender and level of
satisfaction of welfare measures.
There is close significant relation between educational qualification
and level of satisfaction of welfare measures.
There is close significant relation between experience and level of
satisfaction of welfare measures.
There is close significant relation between marital status and level
of satisfaction of welfare measures.
There is close significant relation between monthly income and
level of satisfaction of welfare measures.
There is close significant relation between number of dependants
and level of satisfaction of welfare measures.
The overall level of satisfaction of the employees with respect to welfare
facilities has a strong association with the demographic factors.
50. 50
CHAPTER 6
SUGGESTIONS AND CONCLUSION
1. Regarding canteen facilities, free tea can be provided for the third shift
workers. Quality of the food items can be improved and the varieties can
be increased further; proper hygiene can be maintained by providing
boiled utensils to the employees every time.
2. Latrines and urinal facilities can be improved by maintaining cleanliness
and a frequent inspection will be helpful to maintain the cleanliness all
over the organization.
3. Water purifiers can be provided for each and every department, so that
the satisfactory level can be increased further
4. Uniforms and shoes can be provided for the workers.
5. Masks can be given to help in prevention of inhalation of dust particles.
6. Regarding housing facilities, number of quarters can be increased for the
benefit of the workers.
7. Recreational facilities and clubs can be encouraged for the relaxation of
the workers.
8. Transportation facilities can be given for the employees by providing bus
facilities for the employees coming from nearly villages.
9. Education facilities for the children like education allowances can be
provided.
51. 51
CONCLUSION
The study reveals that majority of the employees are satisfied with the
working conditions and welfare facilities. Employee’s satisfactory level can be
enhanced by improving the facilities regarding dust and fumes control, latrines
and urinal facility, cleanliness of the canteen and the quality of food in the
canteen.
A separate labour welfare committee can improve welfare facilities
through regular inspection. This committee can also hear to the needs of the
employees for the further improvements of the welfare facilities.