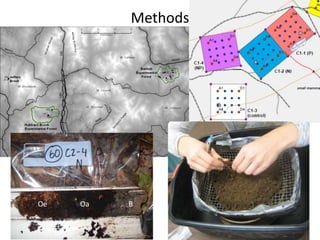
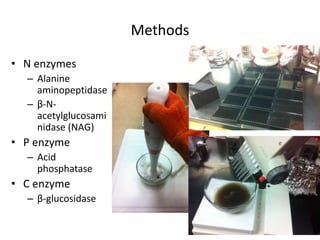
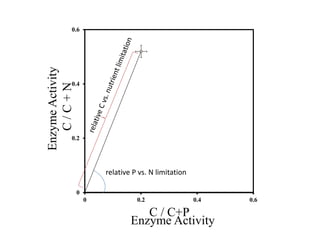
1) The study measured soil enzyme activities to determine whether nitrogen or phosphorus limits microbial decomposer growth.
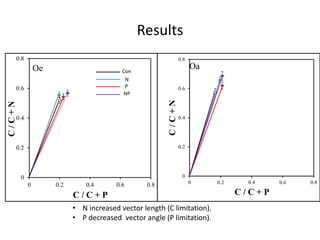
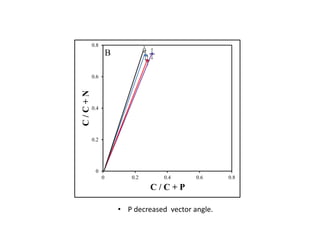
2) It found that phosphatase enzyme activity was higher, indicating higher microbial demand for and limitation by phosphorus.
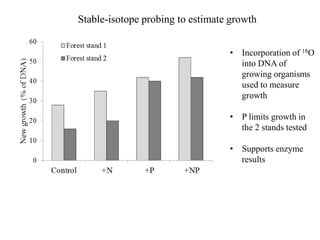
3) Stable isotope probing also supported phosphorus as the limiting nutrient, showing lower microbial growth in soils with phosphorus limitation.
Soil enzyme activity indicates microbial P limitations
1. Soil Enzyme Activity Indicates
Microbial P Limitation
Shan Shan
Miami University
Advisor: Melany Fisk
2. Resource Limitation and Allocation
Responses
• Economic-based analogies for resource
acquisition
• “Efforts” are preferably allocated to acquire
most limiting resources.
• This allocation response tends to increase the
efficiency with which they use the limiting
resources.
– Shoot:root ratios
– Extracellular enzymes
3. Extracellular Enzymes
• Mediate nutrient acquisition from organic matter
• Indicators of soil organisms nutrient demand
• Production and activity correspond to nutrient
stoichiometry
– High activity=high demand for the target nutrient
6. Methods
• N enzymes
– Alanine
aminopeptidase
– β-N-
acetylglucosami
nidase (NAG)
• P enzyme
– Acid
phosphatase
• C enzyme
– β-glucosidase
7. 0
0.2
0.4
0.6
0 0.2 0.4 0.6
C/C+N
C / C+P
relative P vs. N limitation
EnzymeActivity
Enzyme Activity
8. • N increased vector length (C limitation).
• P decreased vector angle (P limitation).
0
0.2
0.4
0.6
0.8
0 0.2 0.4 0.6 0.8
C/C+N
C / C + P
Oe
0
0.2
0.4
0.6
0.8
0 0.2 0.4 0.6 0.8
C/C+N
C / C + P
Oa
Results
9. • P decreased vector angle.
0
0.2
0.4
0.6
0.8
0 0.2 0.4 0.6 0.8
C/C+N
C / C + P
B
10. • Incorporation of 18O
into DNA of
growing organisms
used to measure
growth
• P limits growth in
the 2 stands tested
• Supports enzyme
results
Stable-isotope probing to estimate growth
11. Conclusions
• P limitation is suggested by enzyme activities
in stands of all ages.
• Elevated N availability increases C limitation in
forest floor.
Plants and microbes respond to resource limitation by adjusting their allocations. The allocation responses are usually generalized based on economic analogies. That is, plant preferably allocate efforts to the acquisiztion of the most limiting resources, in order to increase the efficiency with which they use the limiting resources. Effort here means biomass or C. For example, under nutrient limitation, plants can change their root:shoot ratio, …soil organisms can produce enzymes
extracellular enzymes are an important example for decomposer microorganisms.
Variation in the availability of growing-factors in the environment, such as nutrient, water, CO2 and light, drives plants to strategize in partitioning resources among plant organs in order to optimize the uptake of these resources and maximize plant growth.
Generalizations are based mostly on economic analogies and especially cost-benefit analysis.
Carbon (C) is a frequently advised resource as the “currency” in allocation
Plants use three principal mechanisms of compensation: (1) They can change the relative amounts of the different tissues responsible for uptake of different elements. (2) They can change both the concentration and the kinetics of the biochemical uptake machinery within those tissues. (3) They can change the relative efficiency of element recovery from dying leaves and other plant parts.
Soil organisms can release enzymes into soil to catalyze the decomposition of soil organic matter and release of essential nutrients. Based on the allocation theory, microbes can produce more enzymes for a certain nutrient element when that nutrient is limiting their growth. For example, high N acquiring enzyme activity means high N demand of the soil microbes.
Extracellular enzymes allow microbes and plant roots to acquire resources from complex molecules, and catalyze the rate-limiting step in soil carbon and nutrient cycling.
In northern hardwood forests, the mul…
That leads our question that: does soil enzyme activity reflect the similar nutrient limitation regime in soil microbes of our northern hardwood forests.
it is hard to measure microbial growth, so enzymes are the next best thing…
Remember I’m describing the design so all you have to do is mention sampling from treated plots!
b-1,4-Glucosidase (BG) and cellobiohydrolase (CBH) are enzymes that contribute to the degradation of cellulose and other beta-1,4 glucans. The principal function of BG is hydrolysis of cellobiose to glucose, but many of these enzymes are active against other substrates as well. CBH hydrolyzes cellobiose dimers from the non-reducing ends of cellulose molecules. b-N-acetylglucosaminidase (NAG) plays a role in the degradation of chitin and other b-1,4-linked glucosamine polymers that are analogous to the role of BG in cellulose degradation. Leucine aminopeptidase (LAP) hydrolyzes leucine and other hydrophobic amino acids from the N terminus of polypeptides. There are other classes of aminopeptidases, but assays of environmental samples generally show the greatest activities towards leucine- and alanine-linked substrates, so LAP activity is broadly used as an indicator of peptidase potential. Phosphatases (alkaline and acid, AP) hydrolyze phosphomonoesters, and in some cases phosphodiesters, releasing phosphate. The degradation of polyphenols (e.g. lignin, tannin and their degradation products) is an oxidative process. Two classes of enzymes have a large role. Phenol oxidases (POX, e.g. laccases) have Cu-containing prosthetic groups with redox potentials sufficient to extract electrons from phenolic groups.
the proportional activity of C vs. N acquiring enzymes (BG/[BG þ NAG þ LAP]) was plotted against C vs. P acquiring enzymes (BG/[BG þ AP]).We then calculated the length and angle of the vector created by connecting a line between the plot origin and point represented by these proportions; the length quantifies relative C vs. nutrient limitation and the angle quantifies the relative P vs. N limitation. Sediments had the greatest vector lengths, suggesting highest relative C limitation, consistent with the highest proportional values of C vs. nutrient acquisition for both nutrient highest vector angle, indicating the strongest P limitation,
1:1 line is where N and P enzyme have the same magnitude.
Little pattern with successional time
P response