1. Home Price Declines Continue to Abate According to
the S&P/Case-Shiller Home Price Indices
New York, July 28, 2009 – Data through May 2009, released today by Standard & Poor’s for its
S&P/Case-Shiller 1 Home Price Indices, the leading measure of U.S. home prices, show that, although
still negative, the annual rate of decline of the 10-City and 20-City Composites improved for the fourth
consecutive month in 2009.
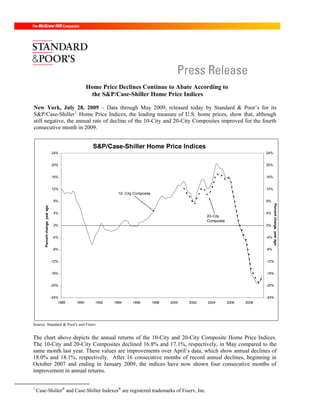
S&P/Case-Shiller Home Price Indices
24% 24%
20% 20%
16% 16%
12% 12%
10 -City Composite
8% 8%
Percent change, year ago
Percent change, year ago
4% 4%
20-City
Composite
0% 0%
-4% -4%
-8% -8%
-12% -12%
-16% -16%
-20% -20%
-24% -24%
1988 1990 1992 1994 1996 1998 2000 2002 2004 2006 2008
Source: Standard & Poor's and Fiserv
The chart above depicts the annual returns of the 10-City and 20-City Composite Home Price Indices.
The 10-City and 20-City Composites declined 16.8% and 17.1%, respectively, in May compared to the
same month last year. These values are improvements over April’s data, which show annual declines of
18.0% and 18.1%, respectively. After 16 consecutive months of record annual declines, beginning in
October 2007 and ending in January 2009, the indices have now shown four consecutive months of
improvement in annual returns.
1
Case-Shiller! and Case-Shiller Indexes! are registered trademarks of Fiserv, Inc.
2. “The pace of descent in home price values appears to be slowing” says David M. Blitzer, Chairman of
the Index Committee at Standard & Poor’s. “There is a clear inflection point in the year-over-year data,
due to four consecutive months of improved rates of return, after the steep decline that began in the fall
of 2005. In addition to the 10-City and 20-City Composites, 17 of the 20 metro areas also saw
improvement in their annual returns compared to those of April. Looking at the monthly data, 13 of the
20 metro areas reported positive returns; and the 10-City and 20-City Composites reported positive
returns for the first time since the summer of 2006. To put it in perspective, these are the first time we
have seen broad increases in home prices in 34 months. This could be an indication that home price
declines are finally stabilizing”.
“While many indicators are showing signs of life in the U.S. housing market, we should remember that
on a year-over-year basis home prices are still down about 17% on average across all metro areas, so we
likely do have a way to go before we see sustained home price appreciation.” Mr. Blitzer added.”
S&P/Case-Shiller Home Price Indices
250 250
20-City
225 Composite 225
200 200
175 175
Both indices are back to their
mid 2003 levels
150 150
125 10 -City Composite 125
100 100
75 75
50 50
1987 1989 1991 1993 1995 1997 1999 2001 2003 2005 2007 2009
Source: Standard & Poor's and Fiserv
The chart above shows the index levels for the 10-City and 20-City Composite Indices. As of May 2009,
average home prices across the United States are at similar levels to where they were in the middle of
2003, indicating that the three years of appreciation that occurred from 2003-2006 were all given back in
the following three years. From the peak in the second quarter of 2006, the 10-City Composite is down
33.3% and the 20-City Composite is down 32.3%.
In terms of annual declines, the numbers remain relatively somber with all metro areas and the two
composites in negative territory, and 16 out of the 20 metro areas are reporting double digit declines. Las
Vegas, Los Angeles, Miami, Phoenix, Seattle and Tampa posted their lowest index levels in May since
their respective peaks. From peak to trough Phoenix and Las Vegas are the worst off, down 54.5% and
53.4%, respectively. More upbeat news is seen in the monthly data; Dallas and Denver have reported
three consecutive months of positive returns. Atlanta, Boston, Cleveland, San Francisco and Washington
3. D.C. each reported two consecutive months of positive returns. Eight of the 13 MSAs reporting positive
monthly returns for May were greater than +1.0%.
The table below summarizes the results for May 2009. The S&P/Case-Shiller Home Price Indices are
revised for the 24 prior months, based on the receipt of additional source data. More than 22 years of
history for these data series is available, and can be accessed in full by going to
www.homeprice.standardandpoors.com
May 2009 May/April April/March
Metropolitan Area Level Change (%) Change (%) 1-Year Change (%)
Atlanta 105.69 0.3% 0.3% -15.0%
Boston 148.77 1.6% 0.4% -7.2%
Charlotte 119.80 0.9% -0.5% -10.0%
Chicago 123.68 1.1% 0.0% -17.5%
Cleveland 102.11 4.1% 1.2% -6.2%
Dallas 116.54 1.9% 1.7% -4.1%
Denver 123.78 1.3% 1.5% -4.6%
Detroit 70.05 0.2% -1.5% -24.5%
Las Vegas 109.49 -2.6% -3.5% -32.0%
Los Angeles 159.18 -0.1% -0.9% -19.8%
Miami 144.59 -0.8% -2.0% -25.2%
Minneapolis 109.77 1.2% -0.8% -21.7%
New York 170.51 0.0% -1.6% -12.2%
Phoenix 103.56 -0.9% -2.2% -34.2%
Portland 146.97 0.1% -0.6% -16.3%
San Diego 145.06 0.4% -0.1% -18.5%
San Francisco 120.16 1.4% 0.6% -26.1%
Seattle 148.96 -0.3% 0.2% -16.6%
Tampa 140.35 0.0% -0.7% -20.8%
Washington 169.49 1.3% 0.8% -14.9%
Composite-10 151.00 0.4% -0.7% -16.8%
Composite-20 139.84 0.5% -0.6% -17.1%
Source: Standard & Poor's and Fiserv
Data through May 2009
The S&P/Case-Shiller Home Price Indices are published on the last Tuesday of each month at 9:00 am
ET. They are constructed to accurately track the price path of typical single-family homes located in each
metropolitan area provided. Each index combines matched price pairs for thousands of individual houses
from the available universe of arms-length sales data. The S&P/Case-Shiller National U.S. Home Price
Index tracks the value of single-family housing within the United States. The index is a composite of
single-family home price indices for the nine U.S. Census divisions and is calculated quarterly. The
S&P/Case-Shiller Composite of 10 Home Price Index is a value-weighted average of the 10 original
metro area indices. The S&P/Case-Shiller Composite of 20 Home Price Index is a value-weighted
average of the 20 metro area indices. The indices have a base value of 100 in January 2000; thus, for
example, a current index value of 150 translates to a 50% appreciation rate since January 2000 for a
typical home located within the subject market.
These indices are generated and published under agreements between Standard & Poor’s and Fiserv, Inc.
The S&P/Case-Shiller Home Price Indices are produced by Fiserv, Inc. In addition to the S&P/Case-
Shiller Home Price Indices, Fiserv also offers home price index sets covering thousands of zip codes,
4. counties, metro areas, and state markets. The indices, published by Standard & Poor's, represent just a
small subset of the broader data available through Fiserv.
About Standard & Poor’s Index Services
Standard & Poor's Index Services, the world’s leading index provider, maintains a wide variety of
investable and benchmark indices to meet an array of investor needs. Over $1 trillion is directly indexed
to Standard & Poor's family of indices, which includes the S&P 500, the world's most followed stock
market index, the S&P Global 1200, a composite index comprised of seven regional and country
headline indices, the S&P Global BMI, an index with approximately 11,000 constituents, and the S&P
GSCI, the industry's most closely watched commodities index. For more information, please visit
www.standardandpoors.com/indices.
About Standard & Poor’s
Standard & Poor's, a subsidiary of The McGraw-Hill Companies (NYSE:MHP), is the world's foremost
provider of independent credit ratings, indices, risk evaluation, investment research and data. With
offices in 23 countries and markets, Standard & Poor's is an essential part of the world's financial
infrastructure and has played a leading role for nearly 150 years in providing investors with the
independent benchmarks they need to feel more confident about their investment and financial decisions.
For more information, visit http://www.standardandpoors.com
For more information contact:
David Blitzer David Guarino
Chairman of the Index Committee Communications
Standard & Poor’s Standard & Poor’s
212 438 3907 1 212 438 1471
david_blitzer@standardandpoors.com dave_guarino@standardandpoors.com