SlideShare a Scribd company logo
1 of 2
Download to read offline
ENTIDAD PRESTADORA DE SERVICIOS DE SANEAMIENTO DE LAMBAYEQUE S.A.

BALANCE GENERAL
2005
Efectivo y Equivalente de efectivo
Cuentas por cobrara comerciales
Otras cuentas por cobrar
Existencias
Gastos contratados por anticipado
ACTIVO CORRIENTE
Inmuebles Maq. Y Eq.
Activos Intangibles
ACTIVO NO CORRIENTE
TOTAL ACTIVO
Sobregiro Bancario
Obligaciones Financieras
Cuentas por pagar comerciales
Otras cuentas por pagar
Provisiones
PASIVO CORRIENTE
Obligaciones Financieras
Ingresos diferidos
PASIVO NO CORRIENTE
TOTAL PASIVO
Capital
Capital Adicional
Otras Reservas

650,965.00
10,184,780.00
600,549.00
706,732.00
16,990,151.00
29,133,177.00

%
0.2%
3.0%
0.2%
0.2%
5.0%
8.6%

2006
3,820,608.00
10,589,377.00
13,878,983.00
720,902.00
15,587,564.00
44,597,434.00

%
1.1%
3.0%
4.0%
0.2%
4.4%
12.7%

2007
5,018,154.00
10,432,453.00
8,478,266.00
635,043.00
14,190,979.00
38,754,895.00

%
1.4%
3.0%
2.4%
0.2%
4.0%
11.0%

2008
5,653,002.00
6,318,672.00
3,929,626.00
812,579.00
12,686,059.00
29,399,938.00

%
1.6%
1.8%
1.1%
0.2%
3.7%
8.5%

2009
7,022,875.00
4,274,311.00
4,276,007.00
824,411.00
11,163,738.00
27,561,342.00

%
2.0%
1.2%
1.2%
0.2%
3.2%
7.9%

304,416,542.00 90.0% 302,091,838.00 86.1% 311,849,720.00 88.2% 314,360,995.00 91.0% 321,638,676.00 92.1%
4,700,030.00
1.4%
4,278,806.00
1.2%
2,926,696.00
0.8%
1,701,374.00
0.5%
153,122.00
0.0%
309,116,572.00 91.4% 306,370,644.00 87.3% 314,776,416.00 89.0% 316,062,369.00 91.5% 321,791,798.00 92.1%
338,249,749.00 100.0% 350,968,078.00 100.0% 353,531,311.00 100.0% 345,462,307.00 100.0% 349,353,140.00 100.0%

1,015,609.00
25,372,449.00
13,260,181.00

0.3%
7.5%
3.9%

484,612.00
25,665,877.00
12,448,249.00

0.1%
7.3%
3.5%

39,648,239.00

11.7%

38,598,738.00

11.0%

72,028,842.00

21.3%

72,028,842.00

20.5%

72,028,842.00 21.3%

72,028,842.00 20.5%

19,841,364.00
1,249,216.00
36,998,160.00
12,746.00
58,101,486.00

5.6%
0.4%
10.5%
16.4%

57,091,664.00 16.1%
23,266,835.00
80,358,499.00 22.7%

22,349,946.00
907,661.00
40,519,409.00
12,746.00
63,789,762.00

6.5%
0.3%
11.7%
18.5%

49,336,501.00 14.3%
24,352,025.00
73,688,526.00 21.3%

8,272.00
65,965,685.00
753,785.00
11,902,150.00
12,820.00
78,642,712.00

18.9%
0.2%
3.4%
22.5%

40,216,310.00 11.5%
24,717,753.00
64,934,063.00 18.6%

111,677,081.00 33.0% 110,627,580.00 31.5% 138,459,985.00 39.2% 137,478,288.00 39.8% 143,576,775.00 41.1%
232,932,011.00
21,201,215.00
27.00

68.9% 232,932,011.00
6.3% 40,105,219.00
0.0%
27.00

66.4% 232,932,011.00
11.4% 24,640,441.00
0.0%
27.00

65.9% 232,932,011.00
7.0% 25,553,695.00
0.0%
27.00

67.4% 232,932,011.00
7.4% 33,915,795.00
0.0%
27.00

66.7%
9.7%
0.0%
Resultados Acumulados
Resultados del Ejercicio
PATRIMONIO
TOTAL PASIVO Y PATRIMONIO

-28,544,232.00 -8.4% -28,747,444.00 -8.2% -33,605,581.00 -9.5% -43,312,792.00 -12.5% -58,762,903.00 -16.8%
983,647.00
0.3% -3,949,315.00 -1.1% -8,895,572.00 -2.5% -7,188,922.00 -2.1% -2,308,565.00 -0.7%
226,572,668.00 67.0% 240,340,498.00 68.5% 215,071,326.00 60.8% 207,984,019.00 60.2% 205,776,365.00 58.9%
338,249,749.00 100.0% 350,968,078.00 100.0% 353,531,311.00 100.0% 345,462,307.00 100.0% 349,353,140.00 100.0%

Fuente: Estados Financieros - Subgerencia Contabilidad y Finanzas EPSEL S.A.

More Related Content

Similar to Cuadros

MA PRESENTATION FOR COLLEGE VERY IMP.pptx
MA PRESENTATION FOR COLLEGE VERY IMP.pptxMA PRESENTATION FOR COLLEGE VERY IMP.pptx
MA PRESENTATION FOR COLLEGE VERY IMP.pptxsamyakpatwa
 
Financial Statement Analysis - 2009 presentation
Financial Statement Analysis - 2009 presentationFinancial Statement Analysis - 2009 presentation
Financial Statement Analysis - 2009 presentationFelix Yamasato
 
12-Basic Financial Statement
12-Basic Financial Statement12-Basic Financial Statement
12-Basic Financial StatementWahyu Wijanarko
 
Casper Van Leeuwen - Why cash flow should be a focal point
Casper Van Leeuwen - Why cash flow should be a focal pointCasper Van Leeuwen - Why cash flow should be a focal point
Casper Van Leeuwen - Why cash flow should be a focal pointFDMagazine
 
Name Date Targe.docx
Name                                         Date  Targe.docxName                                         Date  Targe.docx
Name Date Targe.docxroushhsiu
 
Name Date Targe.docx
Name                                         Date  Targe.docxName                                         Date  Targe.docx
Name Date Targe.docxgemaherd
 
Name Date Targe.docx
Name                                         Date  Targe.docxName                                         Date  Targe.docx
Name Date Targe.docxdohertyjoetta
 
Strategies To Overcome Bankruptcy PowerPoint Presentation Slides
Strategies To Overcome Bankruptcy PowerPoint Presentation SlidesStrategies To Overcome Bankruptcy PowerPoint Presentation Slides
Strategies To Overcome Bankruptcy PowerPoint Presentation SlidesSlideTeam
 
Financial Accounting Common Sizing Analysis Report
Financial Accounting Common Sizing Analysis ReportFinancial Accounting Common Sizing Analysis Report
Financial Accounting Common Sizing Analysis ReportNicholas Espinosa
 
Iomart end-of-financial-year-presentation - 2015 final
Iomart end-of-financial-year-presentation - 2015 finalIomart end-of-financial-year-presentation - 2015 final
Iomart end-of-financial-year-presentation - 2015 finalCompany Spotlight
 
How to Prepare Budgets & Projections
How to Prepare Budgets &  ProjectionsHow to Prepare Budgets &  Projections
How to Prepare Budgets & ProjectionsTraklight.com
 
Measuring cash flows or statement of cash flows
Measuring cash flows or statement of cash flowsMeasuring cash flows or statement of cash flows
Measuring cash flows or statement of cash flowsMuhammad Zubair
 
Measuring cash flows or statement of cash flows
Measuring cash flows or statement of cash flowsMeasuring cash flows or statement of cash flows
Measuring cash flows or statement of cash flowsMuhammad Zubair
 
Hubspot marketing-3q15-v6-final
Hubspot marketing-3q15-v6-finalHubspot marketing-3q15-v6-final
Hubspot marketing-3q15-v6-finalIR_HubSpot
 
financial management of great eastern shipping co.
financial management of great eastern shipping co.financial management of great eastern shipping co.
financial management of great eastern shipping co.hemantahire03
 
8 Metrics for Creative Service Companies
8 Metrics for Creative Service Companies8 Metrics for Creative Service Companies
8 Metrics for Creative Service CompaniesSummit CPA Group
 

Similar to Cuadros (20)

MA PRESENTATION FOR COLLEGE VERY IMP.pptx
MA PRESENTATION FOR COLLEGE VERY IMP.pptxMA PRESENTATION FOR COLLEGE VERY IMP.pptx
MA PRESENTATION FOR COLLEGE VERY IMP.pptx
 
Financial Statement Analysis - 2009 presentation
Financial Statement Analysis - 2009 presentationFinancial Statement Analysis - 2009 presentation
Financial Statement Analysis - 2009 presentation
 
12-Basic Financial Statement
12-Basic Financial Statement12-Basic Financial Statement
12-Basic Financial Statement
 
ch 03 Fin stmts
ch 03 Fin stmtsch 03 Fin stmts
ch 03 Fin stmts
 
Casper Van Leeuwen - Why cash flow should be a focal point
Casper Van Leeuwen - Why cash flow should be a focal pointCasper Van Leeuwen - Why cash flow should be a focal point
Casper Van Leeuwen - Why cash flow should be a focal point
 
Name Date Targe.docx
Name                                         Date  Targe.docxName                                         Date  Targe.docx
Name Date Targe.docx
 
Name Date Targe.docx
Name                                         Date  Targe.docxName                                         Date  Targe.docx
Name Date Targe.docx
 
Name Date Targe.docx
Name                                         Date  Targe.docxName                                         Date  Targe.docx
Name Date Targe.docx
 
Name Date Targe.docx
Name                                         Date  Targe.docxName                                         Date  Targe.docx
Name Date Targe.docx
 
Strategies To Overcome Bankruptcy PowerPoint Presentation Slides
Strategies To Overcome Bankruptcy PowerPoint Presentation SlidesStrategies To Overcome Bankruptcy PowerPoint Presentation Slides
Strategies To Overcome Bankruptcy PowerPoint Presentation Slides
 
Financial Accounting Common Sizing Analysis Report
Financial Accounting Common Sizing Analysis ReportFinancial Accounting Common Sizing Analysis Report
Financial Accounting Common Sizing Analysis Report
 
Iomart end-of-financial-year-presentation - 2015 final
Iomart end-of-financial-year-presentation - 2015 finalIomart end-of-financial-year-presentation - 2015 final
Iomart end-of-financial-year-presentation - 2015 final
 
How to Prepare Budgets & Projections
How to Prepare Budgets &  ProjectionsHow to Prepare Budgets &  Projections
How to Prepare Budgets & Projections
 
Harshita sharma copy
Harshita sharma   copyHarshita sharma   copy
Harshita sharma copy
 
Measuring cash flows or statement of cash flows
Measuring cash flows or statement of cash flowsMeasuring cash flows or statement of cash flows
Measuring cash flows or statement of cash flows
 
Measuring cash flows or statement of cash flows
Measuring cash flows or statement of cash flowsMeasuring cash flows or statement of cash flows
Measuring cash flows or statement of cash flows
 
Hubspot marketing-3q15-v6-final
Hubspot marketing-3q15-v6-finalHubspot marketing-3q15-v6-final
Hubspot marketing-3q15-v6-final
 
Total Nigeria Plc HY 2014 financial results
Total Nigeria Plc HY 2014 financial results Total Nigeria Plc HY 2014 financial results
Total Nigeria Plc HY 2014 financial results
 
financial management of great eastern shipping co.
financial management of great eastern shipping co.financial management of great eastern shipping co.
financial management of great eastern shipping co.
 
8 Metrics for Creative Service Companies
8 Metrics for Creative Service Companies8 Metrics for Creative Service Companies
8 Metrics for Creative Service Companies
 

More from Luis Santiago Garcia Merino (15)

Guia para presentacion de portafolio docente presencial (1) (1)
Guia para presentacion de portafolio docente presencial (1) (1)Guia para presentacion de portafolio docente presencial (1) (1)
Guia para presentacion de portafolio docente presencial (1) (1)
 
Tipos de comprensión
Tipos de comprensiónTipos de comprensión
Tipos de comprensión
 
ADMINISTRACION Y FINANZAS EPSEL S.A.- LUIS SANTIAGO GARCIA MERINO
ADMINISTRACION Y FINANZAS EPSEL S.A.- LUIS SANTIAGO GARCIA MERINOADMINISTRACION Y FINANZAS EPSEL S.A.- LUIS SANTIAGO GARCIA MERINO
ADMINISTRACION Y FINANZAS EPSEL S.A.- LUIS SANTIAGO GARCIA MERINO
 
ADMINISTRACION Y FINANZAS EPSEL S.A.- LUIS SANTIAGO GARCIA MERINO
ADMINISTRACION Y FINANZAS EPSEL S.A.- LUIS SANTIAGO GARCIA MERINOADMINISTRACION Y FINANZAS EPSEL S.A.- LUIS SANTIAGO GARCIA MERINO
ADMINISTRACION Y FINANZAS EPSEL S.A.- LUIS SANTIAGO GARCIA MERINO
 
ADMINISTRACION Y FINANZAS EPSEL S.A.- LUIS SANTIAGO GARCIA MERINO
ADMINISTRACION Y FINANZAS EPSEL S.A.- LUIS SANTIAGO GARCIA MERINOADMINISTRACION Y FINANZAS EPSEL S.A.- LUIS SANTIAGO GARCIA MERINO
ADMINISTRACION Y FINANZAS EPSEL S.A.- LUIS SANTIAGO GARCIA MERINO
 
ADMINISTRACION Y FINANZAS EPSEL S.A.- LUIS SANTIAGO GARCIA MERINO
ADMINISTRACION Y FINANZAS EPSEL S.A.- LUIS SANTIAGO GARCIA MERINOADMINISTRACION Y FINANZAS EPSEL S.A.- LUIS SANTIAGO GARCIA MERINO
ADMINISTRACION Y FINANZAS EPSEL S.A.- LUIS SANTIAGO GARCIA MERINO
 
LUIS SANTIAGO GARCIA MERINO
LUIS SANTIAGO GARCIA MERINOLUIS SANTIAGO GARCIA MERINO
LUIS SANTIAGO GARCIA MERINO
 
Bibliografia
BibliografiaBibliografia
Bibliografia
 
Conclusiones
ConclusionesConclusiones
Conclusiones
 
Capitulo iii
Capitulo iiiCapitulo iii
Capitulo iii
 
Capitulo 2
Capitulo 2Capitulo 2
Capitulo 2
 
Capitulo i
Capitulo iCapitulo i
Capitulo i
 
Introduc resumen
Introduc resumenIntroduc resumen
Introduc resumen
 
Indice
IndiceIndice
Indice
 
HOJA DE VIDA PROFESIONAL
HOJA DE VIDA PROFESIONALHOJA DE VIDA PROFESIONAL
HOJA DE VIDA PROFESIONAL
 

Cuadros

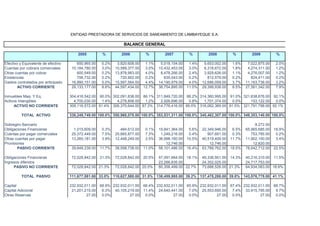
  • 1. ENTIDAD PRESTADORA DE SERVICIOS DE SANEAMIENTO DE LAMBAYEQUE S.A. BALANCE GENERAL 2005 Efectivo y Equivalente de efectivo Cuentas por cobrara comerciales Otras cuentas por cobrar Existencias Gastos contratados por anticipado ACTIVO CORRIENTE Inmuebles Maq. Y Eq. Activos Intangibles ACTIVO NO CORRIENTE TOTAL ACTIVO Sobregiro Bancario Obligaciones Financieras Cuentas por pagar comerciales Otras cuentas por pagar Provisiones PASIVO CORRIENTE Obligaciones Financieras Ingresos diferidos PASIVO NO CORRIENTE TOTAL PASIVO Capital Capital Adicional Otras Reservas 650,965.00 10,184,780.00 600,549.00 706,732.00 16,990,151.00 29,133,177.00 % 0.2% 3.0% 0.2% 0.2% 5.0% 8.6% 2006 3,820,608.00 10,589,377.00 13,878,983.00 720,902.00 15,587,564.00 44,597,434.00 % 1.1% 3.0% 4.0% 0.2% 4.4% 12.7% 2007 5,018,154.00 10,432,453.00 8,478,266.00 635,043.00 14,190,979.00 38,754,895.00 % 1.4% 3.0% 2.4% 0.2% 4.0% 11.0% 2008 5,653,002.00 6,318,672.00 3,929,626.00 812,579.00 12,686,059.00 29,399,938.00 % 1.6% 1.8% 1.1% 0.2% 3.7% 8.5% 2009 7,022,875.00 4,274,311.00 4,276,007.00 824,411.00 11,163,738.00 27,561,342.00 % 2.0% 1.2% 1.2% 0.2% 3.2% 7.9% 304,416,542.00 90.0% 302,091,838.00 86.1% 311,849,720.00 88.2% 314,360,995.00 91.0% 321,638,676.00 92.1% 4,700,030.00 1.4% 4,278,806.00 1.2% 2,926,696.00 0.8% 1,701,374.00 0.5% 153,122.00 0.0% 309,116,572.00 91.4% 306,370,644.00 87.3% 314,776,416.00 89.0% 316,062,369.00 91.5% 321,791,798.00 92.1% 338,249,749.00 100.0% 350,968,078.00 100.0% 353,531,311.00 100.0% 345,462,307.00 100.0% 349,353,140.00 100.0% 1,015,609.00 25,372,449.00 13,260,181.00 0.3% 7.5% 3.9% 484,612.00 25,665,877.00 12,448,249.00 0.1% 7.3% 3.5% 39,648,239.00 11.7% 38,598,738.00 11.0% 72,028,842.00 21.3% 72,028,842.00 20.5% 72,028,842.00 21.3% 72,028,842.00 20.5% 19,841,364.00 1,249,216.00 36,998,160.00 12,746.00 58,101,486.00 5.6% 0.4% 10.5% 16.4% 57,091,664.00 16.1% 23,266,835.00 80,358,499.00 22.7% 22,349,946.00 907,661.00 40,519,409.00 12,746.00 63,789,762.00 6.5% 0.3% 11.7% 18.5% 49,336,501.00 14.3% 24,352,025.00 73,688,526.00 21.3% 8,272.00 65,965,685.00 753,785.00 11,902,150.00 12,820.00 78,642,712.00 18.9% 0.2% 3.4% 22.5% 40,216,310.00 11.5% 24,717,753.00 64,934,063.00 18.6% 111,677,081.00 33.0% 110,627,580.00 31.5% 138,459,985.00 39.2% 137,478,288.00 39.8% 143,576,775.00 41.1% 232,932,011.00 21,201,215.00 27.00 68.9% 232,932,011.00 6.3% 40,105,219.00 0.0% 27.00 66.4% 232,932,011.00 11.4% 24,640,441.00 0.0% 27.00 65.9% 232,932,011.00 7.0% 25,553,695.00 0.0% 27.00 67.4% 232,932,011.00 7.4% 33,915,795.00 0.0% 27.00 66.7% 9.7% 0.0%
  • 2. Resultados Acumulados Resultados del Ejercicio PATRIMONIO TOTAL PASIVO Y PATRIMONIO -28,544,232.00 -8.4% -28,747,444.00 -8.2% -33,605,581.00 -9.5% -43,312,792.00 -12.5% -58,762,903.00 -16.8% 983,647.00 0.3% -3,949,315.00 -1.1% -8,895,572.00 -2.5% -7,188,922.00 -2.1% -2,308,565.00 -0.7% 226,572,668.00 67.0% 240,340,498.00 68.5% 215,071,326.00 60.8% 207,984,019.00 60.2% 205,776,365.00 58.9% 338,249,749.00 100.0% 350,968,078.00 100.0% 353,531,311.00 100.0% 345,462,307.00 100.0% 349,353,140.00 100.0% Fuente: Estados Financieros - Subgerencia Contabilidad y Finanzas EPSEL S.A.