
Recommended
More Related Content
Similar to Fy21 q2 consolidated_financial_statements
Similar to Fy21 q2 consolidated_financial_statements (20)
More from los_pinos
More from los_pinos (9)
Recently uploaded
Recently uploaded (20)
Fy21 q2 consolidated_financial_statements
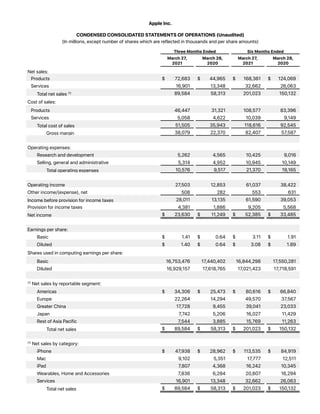
- 1. Apple Inc. CONDENSED CONSOLIDATED STATEMENTS OF OPERATIONS (Unaudited) (In millions, except number of shares which are reflected in thousands and per share amounts) Three Months Ended Six Months Ended March 27, 2021 March 28, 2020 March 27, 2021 March 28, 2020 Net sales: Products $ 72,683 $ 44,965 $ 168,361 $ 124,069 Services 16,901 13,348 32,662 26,063 Total net sales (1) 89,584 58,313 201,023 150,132 Cost of sales: Products 46,447 31,321 108,577 83,396 Services 5,058 4,622 10,039 9,149 Total cost of sales 51,505 35,943 118,616 92,545 Gross margin 38,079 22,370 82,407 57,587 Operating expenses: Research and development 5,262 4,565 10,425 9,016 Selling, general and administrative 5,314 4,952 10,945 10,149 Total operating expenses 10,576 9,517 21,370 19,165 Operating income 27,503 12,853 61,037 38,422 Other income/(expense), net 508 282 553 631 Income before provision for income taxes 28,011 13,135 61,590 39,053 Provision for income taxes 4,381 1,886 9,205 5,568 Net income $ 23,630 $ 11,249 $ 52,385 $ 33,485 Earnings per share: Basic $ 1.41 $ 0.64 $ 3.11 $ 1.91 Diluted $ 1.40 $ 0.64 $ 3.08 $ 1.89 Shares used in computing earnings per share: Basic 16,753,476 17,440,402 16,844,298 17,550,281 Diluted 16,929,157 17,618,765 17,021,423 17,718,591 (1) Net sales by reportable segment: Americas $ 34,306 $ 25,473 $ 80,616 $ 66,840 Europe 22,264 14,294 49,570 37,567 Greater China 17,728 9,455 39,041 23,033 Japan 7,742 5,206 16,027 11,429 Rest of Asia Pacific 7,544 3,885 15,769 11,263 Total net sales $ 89,584 $ 58,313 $ 201,023 $ 150,132 (1) Net sales by category: iPhone $ 47,938 $ 28,962 $ 113,535 $ 84,919 Mac 9,102 5,351 17,777 12,511 iPad 7,807 4,368 16,242 10,345 Wearables, Home and Accessories 7,836 6,284 20,807 16,294 Services 16,901 13,348 32,662 26,063 Total net sales $ 89,584 $ 58,313 $ 201,023 $ 150,132
- 2. Apple Inc. CONDENSED CONSOLIDATED BALANCE SHEETS (Unaudited) (In millions, except number of shares which are reflected in thousands and par value) March 27, 2021 September 26, 2020 ASSETS: Current assets: Cash and cash equivalents $ 38,466 $ 38,016 Marketable securities 31,368 52,927 Accounts receivable, net 18,503 16,120 Inventories 5,219 4,061 Vendor non-trade receivables 14,533 21,325 Other current assets 13,376 11,264 Total current assets 121,465 143,713 Non-current assets: Marketable securities 134,539 100,887 Property, plant and equipment, net 37,815 36,766 Other non-current assets 43,339 42,522 Total non-current assets 215,693 180,175 Total assets $ 337,158 $ 323,888 LIABILITIES AND SHAREHOLDERS’ EQUITY: Current liabilities: Accounts payable $ 40,127 $ 42,296 Other current liabilities 45,660 42,684 Deferred revenue 7,595 6,643 Commercial paper 5,000 4,996 Term debt 8,003 8,773 Total current liabilities 106,385 105,392 Non-current liabilities: Term debt 108,642 98,667 Other non-current liabilities 52,953 54,490 Total non-current liabilities 161,595 153,157 Total liabilities 267,980 258,549 Commitments and contingencies Shareholders’ equity: Common stock and additional paid-in capital, $0.00001 par value: 50,400,000 shares authorized; 16,686,305 and 16,976,763 shares issued and outstanding, respectively 54,203 50,779 Retained earnings 15,261 14,966 Accumulated other comprehensive income/(loss) (286) (406) Total shareholders’ equity 69,178 65,339 Total liabilities and shareholders’ equity $ 337,158 $ 323,888
- 3. Apple Inc. CONDENSED CONSOLIDATED STATEMENTS OF CASH FLOWS (Unaudited) (In millions) Six Months Ended March 27, 2021 March 28, 2020 Cash, cash equivalents and restricted cash, beginning balances $ 39,789 $ 50,224 Operating activities: Net income 52,385 33,485 Adjustments to reconcile net income to cash generated by operating activities: Depreciation and amortization 5,463 5,602 Share-based compensation expense 4,001 3,407 Deferred income tax benefit (207) (651) Other (474) (259) Changes in operating assets and liabilities: Accounts receivable, net (2,347) 7,284 Inventories (1,226) 699 Vendor non-trade receivables 6,792 7,923 Other current and non-current assets (4,333) (8,866) Accounts payable (1,997) (13,520) Deferred revenue 1,642 1,223 Other current and non-current liabilities 3,045 7,500 Cash generated by operating activities 62,744 43,827 Investing activities: Purchases of marketable securities (74,424) (66,489) Proceeds from maturities of marketable securities 39,605 39,738 Proceeds from sales of marketable securities 21,645 27,762 Payments for acquisition of property, plant and equipment (5,769) (3,960) Payments made in connection with business acquisitions, net (9) (1,134) Other — (572) Cash used in investing activities (18,952) (4,655) Financing activities: Proceeds from issuance of common stock 561 430 Payments for taxes related to net share settlement of equity awards (3,160) (1,566) Payments for dividends and dividend equivalents (7,060) (6,914) Repurchases of common stock (43,323) (39,280) Proceeds from issuance of term debt, net 13,923 2,210 Repayments of term debt (4,500) (5,250) Proceeds from commercial paper, net 22 1,518 Proceeds from repurchase agreement — 2,556 Other (38) (51) Cash used in financing activities (43,575) (46,347) Increase/(Decrease) in cash, cash equivalents and restricted cash 217 (7,175) Cash, cash equivalents and restricted cash, ending balances $ 40,006 $ 43,049 Supplemental cash flow disclosure: Cash paid for income taxes, net $ 10,276 $ 7,505 Cash paid for interest $ 1,327 $ 1,689