1. Original Study Journal of Veterinary Emergency and Critical Care 24(5) 2014, pp 502–508
doi: 10.1111/vec.12214
Evaluation of acid–base disorders in dogs and
cats presenting to an emergency room. Part 2:
Comparison of anion gap, strong ion gap, and
semiquantitative analysis
Kate Hopper, BVSc, PhD; Steven E. Epstein, DVM; Philip H. Kass, DVM, PhD and
Matthew S. Mellema, DVM, PhD
Abstract
Objective – To compare the diagnostic performance of the anion gap (AG) with 2 physicochemical approaches
to identify unmeasured anions.
Design – Prospective cohort study.
Setting – University teaching hospital.
Animals – Eighty-four dogs and 14 cats presenting to a university teaching hospital emergency room.
Interventions – All dogs and cats in which venous blood samples for acid–base, lactate, and serum biochemical
analysis were all collected within 60 minutes of each other, over a 5-month enrollment period. Unmeasured
anions were quantified using each of three approaches: the anion gap (AG), strong ion gap (SIG), and a
semiquantitative approach (XA).
Measurements and Main Results – An increased AG metabolic acidosis was evident in 34/98 of cases. The
Stewart approach identified an increased SIG acidosis in 49/98 of cases. There was a strong correlation between
SIG and AG (r = 0.89; P < 0.001). The semiquantitative approach identified increased unmeasured anions in
68/98 of cases. There was a moderate correlation between AG and XA (r = 0.68; P < 0.001) and a slightly
stronger correlation between SIG and XA (r = 0.75; P < 0.001). Plasma lactate concentrations and AG were
poorly correlated (r = 0.22; P = 0.029) and there was no correlation between lactate concentrations and BE
(r = 0.19; P = 0.069).
Conclusions – Unmeasured anions occurred commonly in this sample of small animal emergency room patients
and physiochemical approaches identified more animals with unmeasured anions than the traditional AG
calculation. Further studies are needed to determine if the results of the physicochemical approach improves
clinical management and warrants the associated increases in cost and complexity.
(J Vet Emerg Crit Care 2014; 24(5): 502–508) doi: 10.1111/vec.12214
Keywords: albumin, strong ion difference, stewart approach, unmeasured anions
Introduction
Metabolic acidosis is a common acid–base disorder,
reported to occur in 49% of all animals undergoing
blood gas analysis for any reason at a veterinary
teaching hospital.1
Metabolic acidosis can be broadly
From the Departments of Veterinary Surgical and Radiological Sciences,
(Hopper, Epstein, Mellema) and Population, Health and Reproduction
(Kass), School of Veterinary Medicine, University of California at Davis,
Davis, CA, 95616.
The authors declare no conflicts of interests.
Address correspondence and request for reprints to
Dr. Kate Hopper, Department of Veterinary Surgical and Radiological Sci-
ences, Room 2112 Tupper Hall, University of California at Davis, Davis, CA
95616, USA. Email: khopper@ucdavis.edu
Submitted February 23, 2013; Accepted July 04, 2014.
Abbreviations
AG anion gap
BE base excess
SIDapp strong ion difference apparent
SIDeff strong ion difference effective
ATOT total quantity of weak acids
SIG strong ion gap
XA semiquantitative measure of unmeasured ions
categorized into those associated with an increase in
unmeasured anions and those that are not. Recognizing
the presence of unmeasured anions in a patient can aid
502 C
Veterinary Emergency and Critical Care Society 2014
2. Unmeasured anions
in understanding the cause of acid–base imbalance and
may help direct the therapeutic approach. There are
several methods available to estimate the quantity of
unmeasured anions in the clinical patient. The relative
diagnostic performance of these methods remains
controversial in human medicine and has not been
evaluated to date in veterinary medicine.2–9
The AG is the traditional measure of unmeasured an-
ions. It is based on the principle of electroneutrality;
the total number of cations in the system must equal
the total number of anions. The majority of the cations
in the blood are measured routinely, but the charge of
several major anions is not easily quantified, particu-
larly albumin and phosphorus. These anions contribute
to the normal AG present in a healthy patient. The AG is
increased by the accumulation of anions other than chlo-
ride or bicarbonate, many of which are conjugate bases of
acids (eg, the sulfate ion from sulfuric acid accumulation
in renal azotemia).10
The Stewart approach to acid–base analysis utilizes
three variables: PCO2, SID, and ATOT, the total quantity
of nonvolatile weak acids.11
Strong ions are those that
are fully dissociated at physiologic pH and SID is the
difference in quantity between the strong cations and
strong anions. The parameter ATOT is a measure of the
acid–base influence of weak acids, namely albumin and
phosphorus. There are 2 methods by which the SID can
be estimated, SIDapp based on measured cations and
the anion chloride, and SIDeff based on bicarbonate and
ATOT. Several formulas have been proposed for the cal-
culation of these two SID parameters.12,13
In the normal
healthy animal the values for SIDapp and SIDeff are
very similar and the difference between them, a quan-
tity known as SIG (Table 1), is close to zero.14,15
Increases
in unmeasured anions are identified by the associated
increase in the SIG.
A third approach, developed by Fencl and colleagues,
combines concepts from the Stewart physicochemi-
cal method with the BE, determined via traditional
analysis.6,9
This semiquantitative approach quantifies
the influence of several individual acid–base processes
on the patient’s BE. These individual processes are
marked by changes in albumin, phosphorus, chloride,
sodium, and lactate concentration. Formulas are used to
calculate the influence on BE for a given change in each
parameter (Table 1). Unmeasured anions (XA) are then
determined by calculating the difference between the
sum total of the individual contributors and the patients
measured BE (Table 1).9
Acid–base disorders in critically ill and injured human
patients have been shown to have diagnostic and prog-
nostic value and the quantity of unmeasured anions have
frequently been reported to be one of the most useful
acid–base parameters evaluated.3,5–7,16,17
However, the
most accurate method to assess unmeasured anions in
these studies varies. The aim of this study was to com-
pare the diagnostic performance of three methods by
which to quantify unmeasured anions in venous blood
samples collected from dogs and cats on presentation to
an emergency room. This is a companion study to a com-
parison of three methods of acid–base analysis (Part 1)
using the same dataset.18
Materials and Methods
This was a prospective, observational study. All dogs
and cats presenting to a university teaching hospital in
which venous blood samples for acid–base, lactate, and
serum biochemical analysis were all collected within
60 minutes of each other, over a 5-month enrollment
period, were included. The timing and choice of blood
sample type and diagnostic tests performed was at the
clinician’s discretion. Patients that qualified for enroll-
ment were recorded on a data sheet by the emergency
room clinician or technician at the time of blood sample
collection. The patient signalment and primary clinical
diagnoses were recorded.
Comparison values
Venous blood samples from 10 healthy dogs and
8 healthy cats were obtained for the purposes of com-
parison of acid–base, lactate, and electrolyte values (see
Table 1 of the companion article)18
on the ICU point-of-
care machine with those obtained from clinical patients.a
This range was derived from the mean ± 2 standard
deviations. These animals were determined to be in
good health on the basis of history, physical examina-
tion, packed cell volume, and total protein measurement.
The standard reference values at the clinical pathological
laboratories of the University of California-Davis were
used for the phosphorus and albumin concentrations
measured on a serum biochemistry panel. The formulas
used to determine all calculated variables are provided
in Table 1.10,12,13,19,20
Measurements
Heparinized blood samples for acid–base, electrolyte,
and lactate values were measured immediately follow-
ing sample collection on a point-of-care analyzer.a
The
majority of samples were collected as whole blood and
immediately transferred to 125 L heparinized clini-
tubes, purpose-made for the blood gas machine. Some of
the samples were transferred to commercial heparinized
tubes containing 50 units of heparin with a minimum
volume of 1 mL of blood.
Blood samples for phosphorus and albumin con-
centrations were submitted to the hospital diagnostic
C
Veterinary Emergency and Critical Care Society 2014, doi: 10.1111/vec.12214 503
3. K. Hopper et al.
Table 1: Formulas for calculated acid base parameters10,12.13,18,19
Parameter Formula
Anion gap ([Na+
] + [K+
]) – ([HCO3
−
] + [Cl−
])
SID apparent ([Na+
] + [K+
] + [Ca2+
]) – [Cl−
]
Albumin contribution Measured albumin × ((0.123 × pH) – 0.631) × 10
Phosphorus contribution Measured phosphorus × 0.323 × ((0.309 × pH) – 0.469)
ATOT Albumin contribution + Phosphorus contribution
SID effective [HCO3-] + Albumin contribution + Phosphorus contribution
Strong ion gap SID apparent – SID effective
Free water effect 0.25([Na+
] – mid-normal [Na+
])
Dogs cats 0.22([Na+
] – mid-normal [Na+
])
Corrected chloride Measured [Cl−
] × (mid-normal [Na+
]/measured [Na+
])
Chloride effect Mid-normal [Cl−
] – corrected [Cl−
]
Phosphate effect 0.58 (mid-normal [phosphorus] – measured [phosphorus])
Albumin effect 3.7(mid-normal albumin – measured [albumin])
Lactate effect –1 × [lactate]
Sum of effects Free water effect + chloride effect + phosphate effect + albumin effect + lactate effect
Unmeasured anion effect Base excess – sum of effects
Note: Mid-normal values were determined as the central value of the comparison range shown in Table 1 of the companion article. Albumin g/dL;
Phosphorus mg/dL; Electrolytes and lactate mmol/L.
SID, strong ion difference; ATOT, total weak acids.
laboratory for analysis.b
The results of the blood gas,
electrolyte, lactate, and serum biochemistry tests were
imported from the computer-based laboratory data bank
to a commercial spreadsheet application for analysis.c
Calculated variables
Bicarbonate and BE were calculated by the analyzer us-
ing the Henderson–Hasselbalch and Van Slyke equa-
tions, respectively.21,22
The BE equation used was that
recommended by the Clinical Laboratory Standards In-
stitute (C46-A2). Table 1 of the companion article lists
the formulas used for all other calculated acid–base vari-
ables. The value for CO2 solubility (SCO2) in plasma used
by the blood gas machinea
was 0.03 mmol/L/mmHg.
The equation used for the determination of bicarbonate
was:
HCO3 = SCO2 × PCO2 X10(pH−pK
1)
Where the pK’1 used was derived from the formula:
pK’1 = 6.125–log[1 + 10(pH-8.7)
]
Acid–base analysis
The metabolic acid–base diagnosis for each patient was
determined using each of three approaches: the tradi-
tional approach, Stewart approach, and a semiquantita-
tive approach, as described in the companion paper.18
Statistics
Abnormal values for definitions of each acid–base dis-
order were considered as those that were two standard
deviations above or below the mean of the comparison
values. A reference range for AG, SIDapp, SIDeff, and
SIG was determined from the normal values collected,
for dogs and cats, respectively. A reference range for the
semiquantitative parameters of free water effect, chlo-
ride effect, albumin effect, and phosphorus effect was
determined by using the high and low value of the nor-
mal range for each variable (provided in Table 1 of the
companion article).18
Results are reported as median and range. Linear re-
gression was used to evaluate the relationship between
AG, albumin, SIG, and XA, as well as the relationship
between lactate and BE and lactate and AG.d
A P-value
of 0.05 was considered significant.
Results
A total of 98 animals were enrolled with 84 dogs and 14
cats. The acid–base, electrolyte, lactate, albumin, phos-
phorus, and calculated acid–base values are shown in
Table 3 of the companion article.18
The clinical diagnoses
and specific acid base diagnosis of these patients are pro-
vided in the companion article.
Traditional acid–base analysis identified metabolic
acidosis in 53/98 of cases and an increased AG metabolic
acidosis was evident in 34/98 of cases (Table 2). Hyper-
lactatemia was evident in 49/98 and hyperphosphatemia
in 18/98 patients in this study. Regression analysis found
no correlation between AG and serum albumin concen-
tration (r = 0.07; P = 0.5).
The Stewart approach identified one or more acidotic
processes in 34/98 of cases and coexisting alkalotic and
acidotic processes in another 36/98 cases. An increased
504 C
Veterinary Emergency and Critical Care Society 2014, doi: 10.1111/vec.12214
4. Unmeasured anions
Table 2: Comparison of values for unmeasured anion quantity
using traditional, Stewart and a semiquantitative approach for
metabolic acid–base diagnosis of 84 dogs and 14 cats presented
to an emergency room
Unmeasured anion parameter %
Elevated anion gap 35
Elevated strong ion gap 50
XA–Elevated unmeasured anions 73
SIG acidosis was present in 49/98 of cases (Table 2). There
was a strong correlation between SIG and AG (r = 0.89;
P 0.001).
The semiquantitative approach identified one or more
acidotic processes in 38/98 cases and coexisting alkalotic
and acidotic processes in another 54/98 cases. Increased
unmeasured anions (XA) were evident in 68/98 of cases
(Table 2). Unmeasured cations (XA+) were present in
17/98 of cases (Table 7 of the companion article).18
There was a moderate correlation between AG and
XA (r = 0.68; P 0.001) and a strong correlation between
SIG and XA (r = 0.75; P 0.001) (Fig. 1). Plasma lactate
concentrations and AG were poorly correlated (r = 0.22;
P = 0.029) and there was no correlation between lactate
concentrations and BE (r = 0.19; P = 0.069).
Discussion
The identification of abnormal unmeasured anions in the
cases evaluated in this study varied depending on the
method used. The traditional acid–base parameter AG
identified an increased level of unmeasured anions in
34/98 animals while the Stewart parameter SIG was
increased in 49/98 cases and the semiquantitative en-
tity XA was increased in 68/98 of cases. Previous hu-
man studies have also found the Stewart and semiquan-
titative approaches diagnose more abnormalities than
the traditional approach.2,6–9
This may suggest that the
physicochemical approaches (Stewart and semiquantita-
tive) have an increased sensitivity for detection of abnor-
mal unmeasured anions. Alternatively, it is possible that
the physicochemical approaches are more prone to error
as they are based on calculations from a larger number
of parameters.
The AG is a common method used to identify un-
measured anions. The normal range for AG will depend
on the normal values of electrolytes and bicarbonate for
the analyzer used.23
The normal range of AG for dogs
and cats in the present study was within that previously
reported.24
The most common cause of an increase in
AG is a metabolic acidosis due to the accumulation of
endogenous acids such as lactic acid, uremic acids, and
ketoacids or the intake of exogenous acids or acid pre-
cursors such as ethylene glycol. Hyperlactatemia was
evident in 49/98 of patients and hyperphosphatemia in
18/98 of patients in this study. None of the enrolled pa-
tients were diagnosed with ethylene glycol intoxication.
Other potential sources of unmeasured anions may in-
clude substances such as D-lactate, acids associated with
the Krebs cycle, or unidentified toxins.25
The negative charge of albumin constitutes the ma-
jority of the normal AG, as such a strong correlation
between albumin concentration and AG would be ex-
pected. This is supported by a study in human patients
with nephrotic syndrome, while Feldman and colleagues
reported a moderate correlation (r = 0.5) in a popula-
tion of 5,328 human patients.26,27
In contrast, the present
study found no correlation between albumin and AG.
This reflects the animals included in this study that had a
high incidence of unmeasured anions and variable albu-
min concentrations. These changes are not unexpected
in human critical illness or injury.2,3,28,29
As albumin is
the major contributor to the normal AG, the presence
of hypoalbuminemia can confound interpretation of the
AG, making it an unreliable predictor of the presence of
unmeasured anions.27,29,30,e
In human medicine, various
formulas to correct the AG for changes in albumin con-
centration have been utilized to increase its sensitivity.
The calculation of an albumin-corrected AG improves
its diagnostic performance in the identification of un-
measured anions.7,27,29,31
Formulas for the correction of
the AG in dogs and cats have been proposed, but the
diagnostic performance and clinical benefit of such cal-
culations are yet to be investigated.24,e
Unlike the AG, the SIG is not impacted by changes
in albumin concentration. In the normal patient the SIG
should approach zero. The comparison values for SIG in
the present study are similar to what has been reported
previously for dogs and cats.14,32–34
The SIG identified
more patients with unmeasured anions than the AG in
this study. Human studies have reported similar find-
ings although there is little difference in performance
if the AG is corrected for hypoalbuminemia.2,7,29,35
The
SIG was strongly correlated with the AG in the current
study, and it is likely that the small difference in di-
agnostic performance between these parameters would
be further reduced if the effect of hypoalbuminemia on
AG were to be accounted for. The calculation of SIG re-
quires measurement of anything from 5 to 9 variables,
depending on the formula utilized. Although the SIG
may perform better when abnormalities in albumin are
present, it remains to be shown if the increased complex-
ity and expense associated with its calculation provides
substantial clinical benefit.
The parameter XA identified the presence of unmea-
sured anions in more patients than AG or SIG, a finding
supported by previous studies.6,9
There was a reason-
ably strong correlation between XA and both AG and
C
Veterinary Emergency and Critical Care Society 2014, doi: 10.1111/vec.12214 505
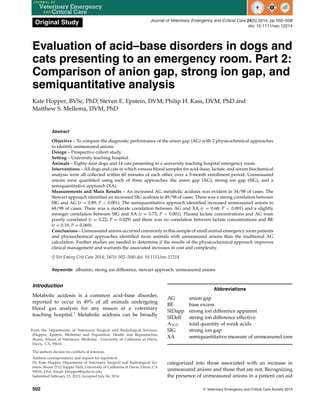
5. K. Hopper et al.
Figure 1: Correlation between strong ion gap and anion gap in 84 dogs and 14 cats presenting to an emergency room (R = 0.89, P
0.001).
SIG, suggesting that all three parameters are identifying
similar abnormalities in animals, with XA having greater
sensitivity. A similar finding was reported in a study of
critically ill human patients.36
Determination of XA re-
quires the sum of 5 calculations and the BE. With every
calculation there is an inherent degree of error so a pa-
rameter utilizing multiple calculations is vulnerable to
cumulative error, and it is possible this factor may con-
tribute to the high rate of abnormal XA values in this
study. The normal range for XA in this study was very
small (–0.5 to 0.5 mmol/L), as a consequence a small er-
ror could easily result in determination of an abnormal
XA. Many of the abnormal XA values for dogs in this
study were small in magnitude, as the median value of
–1.5 mmol/L indicates. The accuracy of this approach to
acid–base analysis has not been validated in vivo and the
clinical relevance of small abnormalities in XA remains
unknown. The parameter XA has been associated with
mortality in critically ill human patients in some, but not
all investigations.5,6,36
Lactate is a useful diagnostic and monitoring tool in
critically ill or injured patients.37,38
When direct lactate
measurement is unavailable, the BE and AG have been
used to predict hyperlactatemia. Previous human and
veterinary studies evaluating the reliability of this ap-
proach have provided contradictory results. Some stud-
ies have found poor correlation, while others have re-
ported that AG or BE can be reliable surrogate measures
of lactate concentration.6,36,39,40
In the present study, there
was poor correlation between lactate and both BE and
the AG. Hypoalbuminemia and the presence of unmea-
sured anions other than lactate are the likely reasons for
this finding. In small animal emergency room patients,
direct measurement of lactate concentration is essential
for ideal patient management.
The identification of increased unmeasured anions is
generally assumed to indicate the presence of a metabolic
acidosis. This is true in many, but not all, clinical scenar-
ios. The acidosis associated with lactate generation can
be masked by the concurrent presence of alkalotic pro-
cesses. In this study, concurrent metabolic alkalotic and
acidotic processes were common, as identified by the
Stewart and semiquantitative approaches in the com-
panion study published elsewhere in this issue.18
Sim-
ilarly, mixed acid–base abnormalities associated with a
normal pH and BE were evident in 20% of critically ill hu-
man patients with severe hyperlactatemia.41
In addition,
lactate generation is not always associated with acid pro-
duction. Causes of hyperlactemia such as increased gly-
colytic rate, as can happen in response to catecholamines
or cytokine stimulation, will increase lactate concentra-
tion but will not change pH.42
Blood samples contam-
inated with sodium lactate will also show an increase
in unmeasured anions without an associated acidosis.43
The interpretation of parameters such as AG, SIG, and
XA should be integrated with the acid–base status of
the patient and some understanding of the underlying
disease processes present.
The semiquantitative approach identified the pres-
ence of unmeasured cations in 17/98 of the cases in
this study. There are few reports of unmeasured cations
in the literature; causes have included lithium intoxi-
cation and paraproteinemias.44,45
Increased concentra-
tion of organic cations, primarily guanidines, have been
described in human patients with chronic renal failure
and may be a reason for the presence of unmeasured
cations in some of the patients in this study.46
Elevations
in magnesium would also be represented as unmeasured
cations in this study and could further contribute to this
finding. As the formula used for the contribution of al-
bumin to base excess was one determined for human
albumin, it may well underestimate the true contribu-
tion of canine and feline albumin, and could result in the
erroneous calculation of unmeasured cations. Low or
506 C
Veterinary Emergency and Critical Care Society 2014, doi: 10.1111/vec.12214
6. Unmeasured anions
negative values for AG and SIG can also indicate the
presence of unmeasured cations. Given the impact of
hypoalbuminemia on AG, a low AG is an insensitive
marker of unmeasured cations. A negative AG may be
due to laboratory error, substances such as bromide or
iodide interfering with measurement of chloride concen-
tration, or the presence of unmeasured cations.44,45,47–49
The causes of a low or negative (below the reference
range) SIG would be similar. There were many patients
in this study with low AG and SIG values; there were no
negative values for either parameter. The impact of un-
measured cations on AG or SIG could not be determined
in this study.
This study has several limitations. For accuracy, it
would have been ideal to evaluate all the measured pa-
rameters on the same blood sample. In this study, we
allowed a 60-minute time interval for blood sample col-
lection so we cannot rule out the possibility that fluid
therapy given during the sample collection period may
have impacted our results. The majority of samples in
this study were collected simultaneously so the effect
of this issue is likely to be minimal. Another limitation
is the small number of cats included in this study. As
such, these results should be applied to cats with caution.
This study was performed in a tertiary referral institu-
tion, so the nature of the emergency room population
included may not be representative of general clinical
practice. Another limitation is the small number of dogs
and cats used to determine the comparison acid–base
values for this study. Although not ideal, this was con-
sidered preferable to using previously published normal
acid–base values measured on different blood gas ma-
chines, often on small numbers of animals.
The results of this study demonstrate that excess un-
measured anions were commonly found in dogs and cats
presented to a university emergency service whose clin-
icians chose to obtain a venous blood gas, lactate, and
serum biochemistry profile.
Physiochemical approaches identified more animals
with unmeasured anions than the traditional AG calcu-
lation did. It is likely that parameters such as SIG and
XA will be superior in identifying unmeasured anions in
hypoalbuminemic patients. Further studies are needed
to determine if the results of the physicochemical ap-
proaches can improve clinical management, and war-
rant the associated increases in cost and complexity in
all patients or if they should be reserved for a subset of
critically ill or injured patients.
Footnotes
a
ABL 705, Radiometer Medical A/S, Copenhagen, Denmark.
b
Hitachi 717 chemistry analyzer, Roche Diagnostics, Indianapolis, IN.
c
Microsoft Excel 2008, Microsoft Corp, Santa Rosa, CA.
d
LogXact 8 for Windows, Cytel Software Corporation, Cambridge, MA.
e
Hayes G, Mathews K, Bersenas A, Dewey C. (Abstract) J Vet Emerg Crit
Care 2010; 20(S1):A4.
References
1. Hopper K, Epstein SE. Incidence, nature and etiology of metabolic
acidosis in dogs and cats. J Vet Intern Med 2012; 26:1107–1114.
2. Martin M, Murray J, Berne T, Demetriades D, Belzberg H. Diagnosis
of acid-base derangements and mortality prediction in the trauma
intensive care unit: the physicochemical approach. J Trauma 2005;
58:238–243.
3. Kaplan LJ, Kellum JA. Initial pH, base deficit, lactate, anion gap,
strong ion difference, and strong ion gap predict outcome from
major vascular injury. Crit Care Med 2004; 32:1120–1124.
4. Murray DM, Olhsson V, Fraser JI. Defining acidosis in postoperative
cardiac patients using Stewart’s method of strong ion difference.
Pediatr Crit Care Med 2004; 5:240–245.
5. Cusack RJ, Rhodes A, Lochhead P, et al. The strong ion gap does
not have prognostic value in critically ill patients in a mixed medi-
cal/surgical adult ICU. Intensive Care Med 2002; 28:864–869.
6. Balasubramanyan N, Havens PL, Hoffman GM. Unmeasured anions
identified by the Fencl-Stewart method predict mortality better than
base excess, anion gap and lactate in the pediatric intensive care unit.
Crit Care Med 1999; 27:1577–1581.
7. Dubin A, Menises MM, Masevicius FD, et al. Comparison of three
different methods of evaluation of metabolic acid-base disorders.
Crit Care Med 2007; 35:1264–1270.
8. Boniatti MM, Cardoso PR, Castihlo RK, Vieira SR. Acid-base disor-
ders evaluation in critically ill patients: we can improve our diag-
nostic ability. Intensive Care Med 2009; 35:1377–1382.
9. Fencl V, Jabor A, Kazda A, Figge J. Diagnosis of metabolic acid-base
disturbances in critically ill patients. Am J Respir Crit Care Med
2000; 162:2246–2251.
10. DiBartola SP. Introduction to acid-base disorders, In: DiBartola SP.
ed. Fluid Therapy in Small Animal Practice, 4th ed. St Louis: Elsevier
Saunders; 2012, pp. 231–252.
11. Stewart PA. Modern quantitative acid-base chemistry. Can J Physiol
Pharmacol 1983; 61:1444–1461.
12. Constable PD. Clinical assessment of acid-base status: comparison
of the Henderson-Hasselbalch and strong ion approaches. Vet Clin
Pathol 2000; 29:115–128.
13. Corey HE. Stewart and beyond: new models of acid-base balance.
Kidney Int 2003;64:777–787.
14. Durocher LL, Hinchcliff KW, DiBartola SP, Johnson SE. Acid-base
and hormonal abnormalities in dogs with naturally-occurring dia-
betes mellitus. J Am Vet Med Assoc 2008; 232:1310–1320.
15. Gunnerson KJ, Srisawat N, Kellum JA. Is there a difference between
strong ion gap in healthy volunteers and intensive care unit pa-
tients? J Crit Care 2010; 25:520–524.
16. Fidkowski C, Helstrom J. Diagnosing metabolic acidosis in the crit-
ically ill: bridging the anion gap, Stewart, and base excess methods.
Can J Anesth 2009; 56:247–256.
17. Shull RM. The value of anion gap and osmolal gap determination
in veterinary medicine. Vet Clin Pathol 1978; 7:12–14.
18. Hopper K, Epstein SE, Kass PH, et al. Evaluation of acid-base dis-
orders in dogs and cats presenting to an emergency room. Part 1:
Comparison of three methods of acid-base analysis. J Vet Emerg Crit
Care 2014; 25(5):493–501.
19. de Morais HSA, DiBartola SP. Ventilatory and metabolic compen-
sation in dogs with acid-base disturbances. J Vet Emerg Crit Care
1991; 1:39–42.
20. de Morais HSA. A nontraditional approach to acid-base disorders,
In: DiBartola SP. ed. Fluid Therapy in Small Animal Practice, 1st
ed.
Philadelphia: WB Saunders; 1992, pp. 297–320.
21. Lawrence J, Henderson LJ. Concerning the relationship between
the strength of acids and their capacity to preserve neutrality. Am J
Physiol 1908; 21:173–179.
22. Siggaard-Andersen O, Fogh-Andersen N. Base excess or buffer base
(strong ion difference) as a measure of a non-respiratory acid-base
disturbance. Acta Anaesth Scand 1995; 39:123–128.
C
Veterinary Emergency and Critical Care Society 2014, doi: 10.1111/vec.12214 507
7. K. Hopper et al.
23. Winter SD, Pearson JR, Gabow PA, et al. The fall of the serum anion
gap. Arch Intern Med 1990; 150:311–313.
24. Kaae J, de Morais HSA. Anion gap and strong ion gap: a quick
reference. Vet Clin Small Anim 2008; 38:443–447.
25. Bruegger D, Kemming GI, Jacob M, et al. Causes of metabolic acido-
sis in canine hemorrhagic shock: role of unmeasured ions. Crit Care
2007; 11:R130.
26. Corey HE. The anion gap (AG): studies in the nephrotic syndrome
and diabetic ketoacidosis (DKA). J Lab Clin Med 2006; 147:121–125.
27. Feldman M, Soni N, Dickson B. Influence of hypoalbuminemia or
hyperalbuminemia on the serum anion gap. J Lab Clin Med 2005;
146:317–320.
28. Horowitz IN, Tai K. Hypoalbuminemia in critically ill children. Arch
Pediatr Adolesc Med 2007; 161:1048–1052.
29. Figge J, Jabor A, Kazda A, Fencl V. Anion gap and hypoalbumine-
mia. Crit Care Med 1998; 26:1807–1810.
30. Story DA, Poustie S, Bellomo R. Estimating unmeasured anions
in critically ill patients: anion-gap, base-deficit and strong-ion-gap.
Anaesth 2002; 57:1102–1133.
31. Moviat M, van Haren F, van der Hoeven H. Conventional or phys-
iochemical approach to intensive care unit patients with metabolic
acidosis. Critical Care 2003; 7:R41–R45.
32. Fettig PK, Bailey DB, Gannon KM. Determination of strong ion gap
in healthy dogs. J Vet Emerg Crit Care 2012; 22:447–452.
33. Constable PD, Stämpfli HR. Experimental determination of net pro-
tein charge and ATOT and Ka of nonvolatile buffers in canine plasma.
J Vet Intern Med 2005; 19:507–514.
34. McCullough SM, Constable PD. Calculation of the total plasma con-
centration of nonvolatile weak acids and the effective dissociation
constant of nonvolatile buffers in plasma for use in the strong ion
approach to acid-base balance in cats. Am J Vet Res 2003; 64:1047–
1051.
35. Kellum JA, Bellomo R, Kramer DJ, Pinsky MR. Splanchnic buffering
of metabolic acid during early endotoxemia. J Crit Care 1997; 12:
7–12.
36. Rocktaeschel J, Morimatsu H, Uchino S, Goldsmith D et al. Acid-
base status of critically ill patients with acute renal failure: analysis
based on Stewart-Figge methodology. Crit Care 2003; 7:R60-R66.
37. Smith I, Kumar P, Molloy S, et al. Base excess and lactate as prog-
nostic indicators for patients admitted to intensive care. Intensive
Care Med 2001; 27:74–83.
38. Nguyen HG, Rivers EP, Knoblich BP, et al. Early lactate clearance
is associated with improved outcome in severe sepsis and septic
shock. Crit Care Med 2004; 32:1637–1642.
39. Stillion JR, Fletcher DJ. Admission base excess as a predictor of
transfusion requirement and mortality in dogs with blunt trauma:
52 cases (2007–2009). J Vet Emerg Crit Care 2012; 22:588–594.
40. Martin MJ, FitzSullivan E, Salim A, Brown CVR, Demetriades D,
Long W. Discordance between lactate and base deficit in the surgical
intensive care unit: which one do you trust? Am J Surg 2006; 191:
625–630.
41. Tuhay G, Pein MC, Masevicius FD, et al. Severe hyperlactemia with
normal base excess: a quantitative analysis using conventional and
Stewart approaches. Crit Care 2008; 12:R66–R73.
42. Mizock BA. Controversies in lactic acidosis. Implications in critically
ill patients. J Am Med Assoc 1987; 258:497–501.
43. Jackson EV, Wiese J, Sigal B. et al. Effects of crystalloid solutions on
circulating lactate concentrations: Part 1. Implications for the proper
handling of blood specimens obtained from critically ill patients.
Crit Care Med 1997; 25:1840–1846.
44. Kelleher SP, Raciti A, Arbeit LA. Reduced or absent serum anion
gap as a marker of severe lithium carbonate intoxication. Arch Intern
Med 1986; 146:1839–1840.
45. Mansoor S, Siddiqui I, Adil S, et al. Anion gap among patients
of multiple myeloma and normal individuals. Clin Biochem 2007;
40:226–229.
46. Parikh C, Gyamiani G, Panililo N, Carvounis CP. Unmeasured
cations: probable cause of relatively low anion gap in chronic re-
nal failure. Ren Fail 2001; 23:91–96.
47. Kraut JA, Madias NE. Serum anion gap: its uses and limitations in
clinical medicine. Clin J Am Soc Nephrol 2007; 2:162–174.
48. Fischman RA, Fiarclough GF, Cheigh JS. Iodide and negative anion
gap. N Engl J Med 1978; 298:1035–1036.
49. Ruiz JP, Oster JR, Navarro J, et al. Low anion gap resulting from un-
explained exposure to bromide in a patient with renal amyloidosis.
J Toxicol Clin Toxicol 1992; 30:663–676.
508 C
Veterinary Emergency and Critical Care Society 2014, doi: 10.1111/vec.12214