SlideShare a Scribd company logo
1 of 38
Download to read offline
NIST Special Publication 260-161
Certification of SRM 114q: Part I
Chiara F. Ferraris
William Guthrie
Ana Ivelisse Avilés
Robin Haupt
Bruce S. MacDonald
NIST Special Publication 260-161
Certification of SRM 114q: Part I
Chiara F. Ferraris
Materials and Construction Research Division
Building and Fire Research Laboratory
William Guthrie
Ana Ivelisse Avilés
Statistical Engineering Division
Information Technology Laboratory
Robin Haupt
Materials and Construction Research Division
Construction Materials Reference Laboratory
Bruce S. MacDonald
Measurement Services Division
Technology Services
National Institute of Standards and Technology
Gaithersburg, MD 28099
July 2005
U.S. DEPARTMENT OF COMMERCE
Carlos M. Gutierrez, Secretary
TECHNOLOGY ADMINISTRATION
Michelle O’Neill, Acting Under Secretary of Commerce for Technology
NATIONAL INSTITUTE OF STANDARDS AND TECHNOLOGY
Hratch G. Semerjian, Acting Director
Certain commercial entities, equipment, or materials may be identified in this
document in order to describe an experimental procedure or concept adequately. Such
identification is not intended to imply recommendation or endorsement by the
National Institute of Standards and Technology, nor is it intended to imply that the
entities, materials, or equipment are necessarily the best available for the purpose.
National Institute of Standards and Technology Special Publication 260-161
Natl. Inst. Stand. Technol. Spec. Publ. 260-161, 36 pages (July 2005)
CODEN: NSPUE2
U.S. GOVERNMENT PRINTING OFFICE
WASHINGTON: 2005
_________________________________________
For sale by the Superintendent of Documents, U.S. Government Printing Office
Internet: bookstore.gpo.gov — Phone: (202) 512-1800 — Fax: (202) 512-2250
Mail: Stop SSOP, Washington, DC 20402-0001
Abstract
The standard reference material (SRM) for fineness of cement, SRM 114, is an integral
part of the calibration material routinely used in the cement industry to qualify cements.
Being a powder, the main physical properties of cement, prior to hydration, are its surface
area and particle size distribution (PSD). Since 1934, NIST has provided SRM 114 for
cement fineness and it will continue to do so as long as the industry requires it. Different
lots of SRM 114 are designated by a unique letter suffix to the SRM number, e.g., 114a,
114b, …. ,114q. A certificate that gives the values obtained using ASTM C204 (Blaine),
C115 (Wagner) and C430 (45 µm sieve residue) is included with each lot of the material.
The supply of SRM 114p, which was released in 1994, was depleted in 2004.
Therefore, a new batch of SRM 114 needed to be developed. This process included
selection of the cement, packaging the cement in small vials, and determination of the
values for the ASTM tests reported. In this case, the Blaine, Wagner and 45 µm sieve
residue were the tests used. Later the particle size distribution (PSD) will be added.
The purpose of this report is to provide a detailed description of the process used to
package and certify SRM 114q. All measurements used for the certifications are provided
along with descriptions of the statistical analyses.
iii
Acknowledgements
The authors would like to thank all participants of the round-robin (listed below in
alphabetical order by institution) for providing time and staff to perform the Blaine,
Wagner, and particle size distribution (PSD)1
tests used for certification of this material.
Also, we would like to thank Stephen Small and the staff of the Cement and Concrete
Reference Laboratory (CCRL), who were instrumental in providing the samples to the
round-robin participants and making sieve residue measurements.
The authors would also like to thank some NIST key persons without whom this
certification could not have being completed: Max Peltz for the PSD measurements; John
Winpigler for the homogeneity measurements using loss of ignition; Mark Cronise and
Curtis Fales for packaging all the materials; and Vince Hackley of the Materials Science
and Engineering Laboratory for the numerous discussions during the planning stage.
Round-Robin Participants (Alphabetical)
American Engineering Testing, Inc., St. Paul, MN: Ken Prom
Armstrong Cement, Cabot, PA: Eugene Szymborski
Ash Grove Cement Co., Chanute, KS: Marc Melton
Ash Grove Cement Co., Louisville, NE: Doug Jaquier
Ash Grove Technical Center, Overland Park, KS: Kristen Freeman
Buzzi Unicem USA Greencastle, IN: John Wachal
Buzzi Unicem USA (formerly Lone Star), Greencastle, IN: W.D. Henry Robinson
Buzzi Unicem USA, Inc. Independence KS Plant, Independence, KS: Jan J Benson
Buzzi Unicem USA, New Orleans Slag Facility, New Orleans, LA: Ronald J. Rajki
California Portland Cement Co., Mojave, CA: Rebecca Lara
Cementa Research AB, Slite: Roger Lehrberg
Cemento De El Salvador S.A., EL Espino Antiguo Cuscatlan: Guillermo Osorio
Cementos Andino-Planta Betania, Bogota, Colombia: Maria M. Penaloza
Cementos Andino-Planta San Gil, Bogota, Colombia: Joost E. Oostra
Cementos del Norte,S.A.,Cortes: Jorge A. De J. Bueso
Cementos Progreso, S.A. Planta San Miguel, La Pedrera Lic.: Luis Velasquez
Cemex Inc. Fairborn, Xenia, OH: Rusty Strader
CEMEX-Central Plans LLC, Dixon, IL: Guido Tenaglia
CEREC-Cementos Progreso, S.A., La Pedrera: Emilio Beltranena
Ciment Quebec Inc., St-Basile (Quebec): Serge Vallerand
Concrete Technology-CECON-INTI, Buenos-Aires: Alejandra Benitez
Connecticut DOT Research & Materials Testing, Rocky Hill, CT: John R. Giannini
Construction Technology Laboratories, Skokie, IL: Ella Shkolnik
Delaware DOT, Dover, DE: Karl Zipf
ESSROC, Logansport, IN: Kevin Jensen
1
PSD data will be discussed in another report under preparation
iv
ESSROC San Juan, San Juan: Fernando Silvagnoli
ESSROC Bessemer Laboratory, Bessemer, PA: Patricia Dubchak
ESSROC Cement Corporation (Plant 1& Plant 3), Nazareth, PA: Bill Fink
ESSROC Italcementi Group, Picton Ontario: Melissa Eaton
F.L. Smidth A/S, LaboratoryCopenhagen: Bjarne Osbaeck
GCC Dacotah, Rapid City, SD: Larry Paulsen
Glens Falls Lehigh Cement, Glens Falls, NY: Donna Malone
Hanson Permanante Cement, Cupertino, CA: John Lacy
Hawaii DOT Materials Testing and Research Branch, Honolulu, HI: Jonathan Yee
Hawaiian Cement-Cement Division, Kapolei, HI: Len B. Lagunoy
Hellenic Cement Research Center (EKET) Attikis: Vassilis Kaloidas
Hercules Cement Company, Stockertown, PA: Charles R. Ogle
Holcim Group Support Ltd., Holderbank: Werner Flueckiger
Holcim US Inc. Theodore Plant, Theodore, AL: Alissa Collins
Kansas DOT Central Laboratory, Topeka, KS: Rodney Montney
Lafarge - St. Constant, St. Constant, Quebec: Julie Arsenault
Lafarge North America, Ravena, NY: Randy Bitely
Lafarge North America, Calera, AL: Liz Higgins
Lafarge North America Alpena Plant, Alpena, MI: William Ulrich
Lafarge North America Exshaw Plant, Exshaw, Alberta: Carol Zaleski
Lafarge North America Joppa Plant, Grand Chain, IL: Eric Bowman
Lafarge North America Paulding Plant, Paulding, OH Tim Rawlsky
Lafarge North America Sugar Creek Plant, Sugar Creek, MO: Nick Ewing
Lehigh Cement Company, Leeds, AL: Michael Reylander
Lehigh Cement Company, Waco, TX: J.W.Davis
Lehigh Cement Company Union Bridge, Union Bridge, MD: Jeff Hook
Lehigh Southwest Cement Co., Tehachapi, CA: Garry Bell
Lone Star Industries- Buzzi Unicem USA, Pryor, OK: Mike Trimble
Master Builders, Inc., Cleveland, OH: Brad Hulvey
MD State Hwy Administration, Lutherville, MD: Vicki R. Stewart
Minnesota DOT, Maplewood, MN: Rod Patrin
Mississippi DOT, Jackson, MS: Richard Sheffield
Mitsubishi Cement Corp., Lucerne Valley, CA: Tom Gepford
Montana DOT.-Mat.Bureau ,Helena, MO: R. Scott Barnes
National Cement Co., Ragland, AL:Frank Holcomb
ND DOT, Bismarck, ND: Dennis Blasl
Nebraska Dept. of Roads-Mat.& Res. Div.,Lincoln, NE: George Woolstrum
NORCEM AS, Brevik Brevik: David Verdu
Ohio DOT, Office of Materials Mgmt. Columbus, OH: Bryan Struble
Penn DOT Materials & Testing Lab,Harrisburg, PA: Roy Trout
RMC Pacific Materials Inc.,Davenport, CA: Chow Yip
St. Lawrence Cement, Inc., Mississauga, Ontario: John Falletta
St. Marys Cement, Detroit, MI: Linda Harris
St. Marys Cement, St.Marys : Walter Pearce
Texas Lehigh Cement Co., Buda, TX: Jim Jarl
Texas Midlothian Cement Plant, Midlothian, TX: Jeff Wendel
v
The Euclid Chemical Co., Cleveland, OH: Bob Bucheral
TPI Polene Standard Laboratory, Saraburi: Zaw Zaw Hlaing
Texas DOT, Austin, TX: Lisa Lukefahr
TXI Hunter Cement,New Braunfels, TX: Herman Borchers
TXI Riverside Cement Co., Riverside, CA: Syed A. Rasheed
TXI Riverside Cement Co., Oro Grande Plant , Oro Grande, CA: Bob Sylvia
vi
Table of Contents
1 Introduction................................................................................................................. 1
2 Description of methods used....................................................................................... 2
2.1 Blaine ASTM C 204 ........................................................................................... 2
2.2 Wagner ASTM C 115......................................................................................... 2
2.3 Sieve Residue ASTM C 430............................................................................... 3
3 Materials ..................................................................................................................... 4
3.1 Characteristics of the cement.............................................................................. 4
3.2 Packaging............................................................................................................ 5
3.3 Homogeneity determination................................................................................ 5
4 Experiment Design and Data Analysis ....................................................................... 7
4.1 Blaine ASTM C 204 ........................................................................................... 7
4.2 Wagner ASTM C 115......................................................................................... 8
4.3 Sieve Residue ASTM C 430............................................................................... 9
4.3.1 Cross check of the residue ........................................................................ 14
5 Summary of Certified Values ................................................................................... 15
6 Process Improvement................................................................................................ 16
6.1 Packaging.......................................................................................................... 16
6.2 Testing............................................................................................................... 16
7 Acknowledgments..................................................................................................... 16
8 References................................................................................................................. 17
9 Appendices................................................................................................................ 18
10 Certificate of SRM 114q....................................................................................... 23
vii
List of Tables
Table 1: Chemical composition .......................................................................................... 4
Table 2: Cement compounds according to ASTM C150.................................................... 5
Table 3: Results from the LOI tests.................................................................................... 6
Table 4: ANOVA Output from the Fit of a Nested, Random-Effects Model with Factors
Box, Lab, and Vial to the Blaine Data........................................................................ 7
Table 5: Summary of the Specific Surface Area Results for SRM 114q using the Blaine
Procedure .................................................................................................................... 8
Table 6: ANOVA Output from the Fit of a Nested, Random-Effects Model with Factors
Box, Lab, and Vial to the Wagner Data...................................................................... 9
Table 7: Summary of the Specific Surface Area Results for SRM 114q: Wagner
Procedure .................................................................................................................... 9
Table 8: ANOVA Output from the Fit of a Nested, Random-Effects Model with Factors
Box and Vial to the Sieve Residue Data for the 38 µm Sieve.................................. 11
Table 9: ANOVA Output from the Fit of a Nested, Random-Effects Model with Factors
Box and Vial to the Sieve Residue Data for the 47 µm Sieve.................................. 11
Table 10: ANOVA Output from the Fit of a Nested, Random-Effects Model with Factors
Box and Vial to the Sieve Residue Data for the 56 µm Sieve.................................. 12
Table 11: Residue Verification Using SRM’s 114p and 114q ......................................... 15
List of Figures
Figure 1: Plot of sieve residue data showing two outliers (square plotting symbols) from a
vial that had been noted as containing cement of a different color than the other
vials........................................................................................................................... 10
Figure 2: Plot of sieve residue data for the 47 µm sieve (with the outlier omitted) that
shows evidence of day-to-day variation in the measurement process...................... 10
Figure 3: A Brooks-Gelman-Rubin plot [12] showing the ratio (upper trace) of the
variation between and within (lower pair of traces) four parallel Markov chains that
were simulated for this model. The fact that the ratio approaches 1 and the variation
within and between chains levels off by 50 000th iteration indicates convergence. 13
Figure 4: The posterior probability distribution of the sieve residue for a 45 µm sieve. 14
viii
1 Introduction
A standard reference material (SRM) is a material that has been well characterized with
regard to its chemical composition, physical properties, or both. National Institute of
Standards and Technology (NIST) provides over 1300 different SRMs to industry and
academia. These materials are used in quality assurance programs, for calibration, and to
verify the accuracy of experimental procedures. Every NIST SRM is provided with a
certificate of analysis that gives the official characterization of the material’s properties.
In addition, supplementary documentation, such as this report, that describes the
development, analysis and use of SRMs is also often published by NIST to provide the
context necessary for effective use of these materials.
There are several SRMs related to cement (http://ts.nist.gov/ts/htdocs/230/232/232.htm).
SRM 114 is related to the fineness of cement, as measured by various indirect methods
giving its surface area and by passing the material through a fine sieve. This SRM is an
integral part of the calibration material routinely used in the cement industry to qualify a
cement. Being a powder, the main physical properties of cement are its surface area and
particle size distribution (PSD). Since 1934, NIST has provided SRM 114 for cement
fineness and it will continue to do so as long as the industry requires it. Different lots of
SRM 114 are designated by a unique letter suffix to the SRM number. A certificate that
gives the values obtained using ASTM C 204 (Blaine) [1], C 115 (Wagner) [2] and C 430
(45-µm residue) [3] is included with each lot of the material.
In 1934, only the Wagner test and the 45 µm residue were listed. In 1944, the Blaine
measurement was added to the certificate of the SRM 114. In 2003, the PSD measured by
laser diffraction was added as an information value, i.e., not certified. The PSD was
obtained under the sponsorship of ASTM Task Group C01.25.01 [4, 5, 6].
The supply of SRM 114p, which was released in 1994, was depleted in 2004. Therefore,
a new batch of SRM 114 needed to be developed. The development process included the
selection of a cement, packaging of the cement in small vials, and determination of the
values for the ASTM tests reported. In this case, the Blaine, Wagner and 45 µm sieve
residue were the tests used. Later the particle size distribution (PSD) will be added.
The values given in this report were obtained through a round-robin inter-laboratory
study by volunteer participants from companies participating in the CCRL certification
program. The particle size distribution by laser diffraction was also collected in the same
round-robin study but will be discussed in a separate report.
The purpose of this report is to provide the description of the development of SRM 114q.
It includes a detailed description of the process used to package and certify the cement.
Also a brief description of the ASTM tests in the certificate is given. All measurements
used for the certifications are provided along with the statistical analysis.
1
2 Description of methods used
2.1 Blaine ASTM C 204
The Blaine measurement described in ASTM C 204 was adopted by ASTM in 1946.
R.L. Blaine published the test in 1943 [7]. The principle of operation is that the
permeability of a bed of fine particles is proportional to the fineness of the particles.
Therefore, the test is a measurement of the flow rate of air through a bed of cement
particles. From the beginning, it was stated that this is a relative test as it depends on the
shape of the particles, and the compaction level or porosity of the bed. For this reason,
ASTM C 204 section 4.1 states that the calibration of the instrument needs to be done by
using a reference material, such as SRM 114 [8].
In brief, the test is carried out by packing the cement to be measured in a cell of known
volume and placing it on top of a U-tube manometer that contains a non-hygroscopic
liquid of low viscosity and density, e.g., dibutyl phthalate or a light grade of mineral oil.
The cell is placed on the U-tube in such a way that a tight seal is created and a vacuum is
created under the cement cell so that the liquid in the manometer is higher toward the
cell. Then, the air is allowed to flow back only through the cement sample. The time for
the liquid in the manometer to descend a set distance is measured. This time is used to
calculate the fineness quantified by the surface area S of the cement defined using the
following formula:
s
s
T
TS
S =
(1)
where Ss is the surface area of the reference material, i.e., SRM 114
Ts is the time of flow using the reference material, i.e., SRM 114
T is the time of flow of the material under test
S is the surface area of the material under test
Therefore, the surface area of the material tested can be calculated from the reference
material.
The results requested from the participants in the round-robin study to determine the
value of SRM 114q were calculated using SRM 114p as the reference material. All
participants were requested to measure the SRM 114p material immediately before
measuring the SRM 114q material and to report both results.
2.2 Wagner ASTM C 115
The Wagner test method described in ASTM C115 was adopted by ASTM in 1934 after a
paper published by L.A. Wagner in 1933 [9]. This test is also referred as the turbidimeter
fineness test because it measures the turbidity of a cement suspension in kerosene.
2
A source of light shines through the cement suspension and is detected by a photoelectric
cell. The intensity of the current generated by the cell is recorded. The calibration is done
by calculation of a calibration factor, K, which depends on the cell used. To determine
this factor a reference material, such as SRM 114, must be used.
Using a reference with known surface area, this test can be used to obtain the surface area
of materials similar to the reference, (i.e. Portland cements), by comparing the two
relative levels of turbidity. This method could also determine the particle size
distribution, but is limited to particles larger than 7.5 µm. Due to this bound on particle
size and various other sources of error, it is rarely used for PSD determinations.
The results requested from the participants in the round-robin study for SRM 114q used
SRM 114p as the calibrant.
2.3 Sieve Residue ASTM C 430
The principle of this test is to measure the residue or retained amount of cement on a
calibrated sieve. The sieve was selected as having a 45 µm opening (No. 3252
). Since a
direct certification of sieve openings is impractical and expensive for production-scale
work, sieves are calibrated by using a reference material, such as SRM 114. A sieve
correction factor is calculated by measuring SRM 114 on the selected sieve and
correcting the result with the certified value of the SRM 114.
To avoid the need to propagate the SRM 114p uncertainty in the certification of the sieve
residue for the SRM 114q material, however, three sieves with nominal openings of 38
µm, 47 µm, and 56 µm were directly calibrated for use in reference material certification.
Interpolation was then used to obtain the value at 45 µm.
Although direct sieve calibration was also used for previous generations of this material,
The procedure used for the 114q material was different in several respects from the
certification of the two preceding lots of SRM 114:
• For SRM 114n sieves with openings of 42 µm to 43.9 µm were used. The average
results were plotted against the average sieve opening. The certified value was
calculated by extrapolation to 45 µm.
• For SRM 114p sieves with openings of 42 µm to 46 µm were used and all data
points (rather than the averages) were plotted against the minimum sieve opening.
The certified value was calculated by interpolation to 45 µm.
2
Sieve number follow the USA definition given in ASTM E11
3
3 Materials
3.1 Characteristics of the cement
Based on the properties of past lots of SRM 114, CCRL and NIST identified a plant with
a suitable cement for SRM 114q from Lehigh Cement Company3
, Union Bridge,
Maryland, who donated 1300 kg of the cement for this SRM. The material selected was
Type I according to the ASTM C 150 Standard Classification, and had a mass fraction of
less than 8 % tricalcium aluminate (C3A) as defined by ASTM C 150. This requirement
was the same as for SRM 114p. Material was collected for shipment to NIST directly
from the finish mill process stream into bags.
The approximate chemical composition has been determined by ASTM Standard Test
Method C 114-02 to provide additional information on this cement. The analyses of this
cement (CCRL Portland Cement Proficiency Sample No. 150) were performed by 70 to
170 laboratories. The composition, which is not certified but is provided for information
only, is shown on Table 1.
Calculation of cement compounds from this chemistry, according to ASTM C 150-02, are
shown in Table 2, again for information only.
The density of the cement was also measured using a modified ASTM C 188 method.
The modification was to use isopropanol (IPA) as the medium instead of kerosene,
otherwise a calibrated Le Chatelier flask was used as described in the ASTM test. Two
measurements were done: 3.255 g/cm3
and 3.248 g/cm3
. This leads to an average of
3.25 g/cm3
± 0.005 g/cm3
.
Table 1: Chemical composition
CaO SiO2 A12O3 Fe2O3 SO3 K2O TiO2 P2O5 Na2O MgO
loss on
ignition
Percent
by mass
fraction 64 20.7 4.7 3.2 2.4 0.7 0.3 0.12 0.07 2.2 1.67
3
Commercial equipment, instruments, and materials mentioned in this report are identified to foster
understanding. Such identification does not imply recommendation or endorsement by the National
Institute of Standards and Technology (NIST), nor does it imply that the materials or equipment identified
are necessarily the best available for the purpose.
4
Table 2: Cement compounds according to ASTM C150
Compound Percent by mass
fraction
C3S (tricalcium silicate) 60
C2S (dicalcium silicate) 14
C3A (tricalcium aluminate) 7
C4AF (tetracalcium alumino-ferrite) 10
3.2 Packaging
Upon its arrival at NIST, the cement was blended in a V-blender (1.7 m3
or 60 ft3
) and
then transferred to 0.2 m3
(55 gal) drums lined with 0.15 mm (6 mil) polyethylene liners
to minimize hydration of the cement in storage prior to preparation and packaging. Over
the next two days, the cement from each drum was sealed in foil bags, each containing
about 16 kg of cement. The foil bags were stored, and subsequently packaged as
described below into vials, in a climate-controlled area.
Each foil bag was packaged into vials and capped and boxed. Each box contained
approximately 500 sealed vials and the boxes were sequentially labeled from 1 to 118.
Usually about five boxes were filled per day. The more than 60 000 glass vials produced,
each containing approximately 5 g of cement, were subsequently sealed into smaller
individual foil bags. The vials were randomly selected (see section 4) and shipped to the
participating laboratories for measurements. After the analysis of the results was
completed the vials were packaged in boxes containing 20 vials each.
3.3 Homogeneity determination
After the material was packaged, it was necessary to determine whether the material in
different vials was the same. A special concern was any absorption of moisture during
packaging from original delivery to placement in the vials. Therefore, the first test that
was performed was loss of ignition (LOI). Cement taken from random vials was
submitted to the following procedure:
• The content of each sampled vial was divided among 3 crucibles (about 2 g of
cement per crucible) and the mass was recorded
• The crucible was placed in an oven at 105 °C for 12 h, and then allowed to cool
down in a dessicator containing a desiccant.
• The mass was recorded, and the crucible was placed in a furnace at 950 °C for
3 h.
• The sample was allowed to cool down in a dessicator and the mass was recorded.
• The LOI was calculated as the water loss during the residence in the furnace per
mass of the sample (after the oven drying).
The LOI value is an indication of the amount of water loss during the drying procedure.
A high value would be an indication of improper handling of the cement.
5
The LOI values are shown in Table 3. The Box # identifies a randomly sampled vial from
that box. The LOI averages are very small (less than 0.15 %). Therefore, we conclude
that there was no significant intake of moisture during packaging.
Nevertheless, further checks were performed during the analysis of the round-robin data
by determining whether a box-to-box or vial-to-vial variation was detected (see Section
4).
Table 3: Results from the LOI tests
Box
#
LOI
[%]
Average
[%]
St. Dev
[%]
0.224
0.045
9
0.050
0.11 0.10
0.097
0.224
27
0.137
0.15 0.07
0.100
0.243
35
0.048
0.13 0.10
0.047
0.179
47
0.000
0.08 0.09
0.000
0.000
53
0.046
0.02 0.03
0.049
0.000
56
0.290
0.11 0.16
0.048
0.135
72
0.141
0.11 0.05
0.139
0.189
76
0.049
0.13 0.07
0.091
0.000
98
0.000
0.03 0.05
0.089
0.046
118
0.100
0.08 0.03
6
4 Experiment Design and Data Analysis
4.1 Blaine ASTM C 204
The data for the Blaine test, ASTM C 204, were collected using a nested experiment
design with three factors, laboratory, box, and vial. In this design, two randomly selected
laboratories who use the Blaine test were each supplied two randomly drawn vials of
cement from a randomly assigned box of vials. The laboratory was then asked to measure
duplicate samples from each vial. Use of this design allows assessment of lab-to-lab
variability, box-to-box heterogeneity of the cement, and vial-to-vial heterogeneity of the
cement.
For the analysis of the Blaine data, the first step was to screen the data for non-statistical
problems. Based on this screening, results from three labs, 209, 247, and 932, were
eliminated from the data set. In each case, the data from these laboratories were omitted
from the analysis because Blaine measurements were made on one vial from the box
designated for the Blaine measurements and one vial from the box designated for the
Wagner measurements. Due to the nature of the experiment design, including these
results would have made it more difficult to distinguish between the different potential
sources of variation.
Next, a nested, random-effects, analysis of variance (ANOVA) model [10] was fit to the
remaining data to check for box-to-box, lab-to-lab, and vial-to-vial variability. Residual
plots to verify that the model fit the data showed that two labs each had two extreme
outlying measurements. Since there were a large number of labs (66) for this analysis and
only two had unusual data, the data from these two labs (123 and 886) was also omitted
from the analysis. After refitting the model, residual plots indicate that the model fits the
data well. The output from the analysis of variance is shown in Table 4. The low p values
(<0.05) corresponding to the F tests for the significance of lab-to-lab and vial-to-vial
variability provide strong evidence that there is significant lab-to-lab variation and vial-
to-vial heterogeneity. The high p value for the F test for box-to-box variability (0.365)
indicates that there is not strong evidence of significant box-to-box heterogeneity in this
data.
Table 4: ANOVA Output from the Fit of a Nested, Random-Effects Model with
Factors Box, Lab, and Vial to the Blaine Data
Source
Degrees of
Freedom
Sums of
Squares
Mean
Squares F Statistic p value
Box-to-Box 37 18703.91 505.511 1.143 0.365
Lab-to-Lab (in Box) 26 11494.21 442.085 29.328 0.000
Vial-to-Vial (in Box/Lab) 64 964.72 15.074 2.960 0.000
Residuals 128 651.83 5.092
7
Because there is significant vial-to-vial heterogeneity, a prediction interval should be
used for certification. Based on the ANOVA results above, a summary of the material's
properties as measured with the Blaine procedure is given in Table 5.
Table 5: Summary of the Specific Surface Area Results for SRM 114q using the
Blaine Procedure
Mean Blaine Result: 381.81 m2
/kg
Standard Uncertainty of Mean: 1.31 m2
/kg
Effective Degrees of Freedom: 26.00
Standard Uncertainty of Heterogeneity: 2.23 m2
/kg
Effective Degrees of Freedom: 26.55
Standard Uncertainty of 114p 2.93 m2
/kg
Effective Degrees of Freedom: 60.00
Combined Standard Uncertainty: 3.91 m2
/kg
Effective Degrees of Freedom: 102.66
Coverage Factor (95 % coverage): 1.98
Expanded Uncertainty: 7.76 m2
/kg
4.2 Wagner ASTM C 115
The experiment design and analysis used for the Wagner [2] data are analogous to the
design and analysis used for the Blaine data. As the first step in the analysis, the Wagner
data were also screened for non-statistical problems. Based on this screening, data from
one lab, 247, were eliminated from the data set because Wagner measurements were
made on one vial from the box designated for the Wagner measurements and one vial
from the box designated for the Blaine measurements.
Next we fit a nested, random effects, analysis of variance model to the remaining data to
check for box-to-box, lab-to-lab, and vial-to-vial variability. Residual plots indicate that
the model fits the data well, although there is only one degree of freedom for estimating
the lab-to-lab variability. The analysis of variance results are shown in Table 6. The high
p values for the tests for significant box-to-box and vial-to-vial variability do not provide
strong evidence that the material is heterogeneous as measured by the Wagner method.
Even with one degree of freedom, however, significant lab-to-lab variation is evident as
indicated by the low p value for the F test for the significance of lab-to-lab variability.
8
Table 6: ANOVA Output from the Fit of a Nested, Random-Effects Model with
Factors Box, Lab, and Vial to the Wagner Data
Source
Degrees of
Freedom
Sums of
Squares
Mean
Squares F Statistic p value
Box-to-Box 4 250579.600 62644.900 0.335 0.841
Lab-to-Lab (in Box) 1 186966.100 186966.100 295.696 0.000
Vial-to-Vial (in Box/Lab) 6 3793.800 632.300 0.907 0.522
Residuals 12 8367.500 697.300
Since there is no evidence of vial-to-vial or box-to-box variability, it was decided to base
the certified value and uncertainty for the Wagner method on the mean and standard
deviation of the laboratory means. Based on this decision, a summary of the certification
results is given in Table 7. The final uncertainty is large because so few labs are using the
Wagner method and could provide results using this method in the inter-laboratory study.
Table 7: Summary of the Specific Surface Area Results for SRM 114q: Wagner
Procedure
Mean Wagner Result: 218.33 m2
/kg
Standard Uncertainty of Mean: 6.04 m2
/kg
Effective Degrees of Freedom: 5.00
Standard Uncertainty of 114p: 2.35 m2
/kg
Effective Degrees of Freedom: 60.00
Combined Standard Uncertainty: 6.48 m2
/kg
Effective Degrees of Freedom: 6.62
Coverage Factor (95 % coverage): 2.44
Expanded Uncertainty: 15.86 m2
/kg
4.3 Sieve Residue ASTM C 430
A nested design with three factors, day, box and vial was used to collect the sieve
residue data. The same design values were used to make measurements on each of the
three sieves with one measurement per sieve made from each vial tested. This design
allows for the estimation of day-to-day, box-to-box, and vial-to-vial variation. In
addition, since the three sieves are each of different sizes spanning the sieve value of
interest, 45 µm, the data from this experiment can also be used to fit a model relating
sieve residue to the sieve opening size.
For the analysis of the sieve residue data, the data were first plotted to graphically
identify potential factor effects and to look for any unusual observations. The plot in
Figure 1 identifies two outliers, from measurements on a vial that had been noted to
contain a different color of cement than the others. Since these points were obtained from
a suspect sample and were very different from all of the other data, they were eliminated
from the analysis. Measurements of other samples from this vial, which did not appear to
9
have unusual values, were still used, however. After removal of the outliers, some
evidence of day-to-day variation between the samples is also evident in Figure 2.
Sieve Opening Size, mm
SieveResidue,%
40 45 50 55
0.51.01.52.0
Figure 1: Plot of sieve residue data showing two outliers (square plotting symbols) from
a vial that had been noted as containing cement of a different color than the other vials.
Day
SieveResidue,%
1 2 3 4 5
0.500.550.600.650.700.75
Figure 2: Plot of sieve residue data for the 47 µm sieve (with the outlier omitted) that
shows evidence of day-to-day variation in the measurement process.
10
Next, a nested, random effects analysis of variance model was fit to the data from each
sieve to check for day-to-day, box-to-box, and vial-to-vial variability. To maintain the
balance of the design for the two sieves for which 1 of the 40 measurements was omitted,
the means of the remaining data from the same box as the omitted vial were substituted
for the missing data points. Residual plots from each fit verify that the models fit the data
from each sieve reasonably well. The ANOVA results, showing the output from the fit of
the model to the data from each sieve, are given in Table 8 to Table 10. The relatively
high p values in Table 8 (p > 0.05) indicate that there is not strong evidence for day-to-
day, box-to-box, or vial-to-vial in these data collected using the 38 µm sieve. The low p
value for the F test for significant day-to-day variation (0.025) does indicate that there is
significant day-to-day variation in the data collected using the 47 µm sieve. There is no
evidence of significant variability from the other two factors, however. Finally, the high
p values for day-to-day and box-to-box variability for the 56 µm sieve indicate that those
factors are not significant, but the low p value for the F test for vial-to-vial variability
indicates that there is significant vial-to-vial variation in the measurements made with the
56 µm sieve
Table 8: ANOVA Output from the Fit of a Nested, Random-Effects Model with
Factors Box and Vial to the Sieve Residue Data for the 38 µm Sieve
Source
Degrees of
Freedom
Sums of
Squares
Mean
Squares F Statistic p value
Day-to-Day 4 0.124 0.031 1.126 0.439
Box-to-Box (in Day) 5 0.138 0.028 2.085 0.095
Vial-to-Vial (in Day/Box) 10 0.178 0.018 1.614 0.174
Residuals 20 0.220 0.011
Table 9: ANOVA Output from the Fit of a Nested, Random-Effects Model with
Factors Box and Vial to the Sieve Residue Data for the 47 µm Sieve
Source
Degrees of
Freedom
Sums of
Squares
Mean
Squares F Statistic p value
Day-to-Day 4 0.047 0.012 7.406 0.025
Box-to-Box (in Day) 5 0.008 0.002 0.722 0.612
Vial-to-Vial (in Day/Box) 10 0.017 0.002 0.679 0.731
Residuals 20 0.049 0.002
11
Table 10: ANOVA Output from the Fit of a Nested, Random-Effects Model with
Factors Box and Vial to the Sieve Residue Data for the 56 µm Sieve
Source
Degrees of
Freedom
Sums of
Squares
Mean
Squares F Statistic p value
Day-to-Day 4 0.010 0.003 0.965 0.500
Box-to-Box (in Day) 5 0.013 0.003 1.066 0.399
Vial-to-Vial (in Day/Box) 10 0.4690 0.005 3.261 0.012
Residuals 20 0.029 0.001
For the certification analysis, a Bayesian model relating the sieve residue of the 114q
material from each sieve to the measured sieve size was developed. A Bayesian model
was used in order to be able to account for the uncertainty in both the sieve calibrations
and the measurements of the reference material made using those sieves. Because of the
apparent day-to-day and vial-to-vial variation, and to allow for the fact that those effects
were not consistently visible for all sieves, the Bayesian model accounts for all four
possible sources of random variation that were included in the design, day-to-day, box-to-
box, vial-to-vial, and measurement uncertainty. Although it might not be necessary to
treat all of the sieves in the same way, since only one exhibited significant apparent day-
to-day variability and one exhibited significant apparent vial-to-vial variability, it was
decided to treat them consistently in case those effects (or box-to-box effects) were
simply not detected for the other two sieves.
In order to specify inter-relationships among the data, the model specifies the
hypothesized relationships between the unknown true values underlying the data (called
parameters in statistical jargon), which are to be estimated. In this case, the model
specifies a quadratic relationship between the true sieve residues and true sieve sizes. The
data gives us the quantitative information needed to estimate the parameter values. Then
the model is used to interpolate the result that would be obtained from a sieve with
openings of exactly 45 µm.
In order to use the Bayesian model, initial assessments of the values of each parameter in
the model must be provided. The initial assessment for each parameter is specified as a
probability distribution for the parameter’s unknown value. Because these probability
distributions are specified independently of the data (i.e. before the data are observed or
used), these distributions are commonly called prior distributions. For this analysis, non-
informative prior distributions were used. These distributions are essentially very flat and
have very large variances so that they will not provide any quantitative information about
the values of the parameters as part of the model.
A probability distribution for each measurement, given with respect to the parameters in
the model, is also specified. This distribution is called the likelihood of the data. For this
analysis, based on typical assumptions for the statistical analysis of metrological data,
normal distributions with means specified by the quadratic relationship between residue
and sieve size and standard deviations based on sieve size were used for the likelihood.
Then, based on the hypothesized relationships between the parameters, the likelihood,
and the observed data, the prior distributions for each parameter are updated using Bayes’
12
Theorem to obtain new distributions for each parameter given the information in the data.
Finally, these new distributions, called posterior distributions, are used to obtain
uncertainty intervals about each quantity of interest.
The Bayesian model was fit using Markov Chain Monte Carlo simulation [11]. Figure 3
shows a plot comparing the within and between chain variation [12] that indicates that the
Markov Chains had converged by the 50 000th iteration of the simulation. Then 10 000
additional iterations were run for each of 4 parallel Markov chains to estimate the
parameter values. Based on these results, the posterior probability distribution describing
the sieve residue for a 45 µm sieve is shown in Figure 4. A 95 % probability interval for
the value of the sieve residue obtained from this posterior distribution is
0.79 % ± 0.19 %.
r45p chains 1:4
0 20000 40000 60000
Iteration
0.9
1.0
1.1
Brooks-Gelman-RubinStatistics
Figure 3: A Brooks-Gelman-Rubin plot [12] showing the ratio (upper trace) of the
variation between and within (lower pair of traces) four parallel Markov chains that were
simulated for this model. The fact that the ratio approaches 1 and the variation within and
between chains levels off by 50 000th iteration indicates convergence.
13
r45p chains 1:4 sample: 40000
-0.5 0.0 0.5 1.0 1.5
0.0
2.0
4.0
6.0
Sieve Residue, %
ProbabilityDensity
Figure 4: The posterior probability distribution of the sieve residue for a 45 µm sieve.
4.3.1 Cross check of the residue
Because the 114q material has such a different residue than previous generations of this
material, it is important to verify that the correct results will be obtained when the
certified value is used to calibrate a sieve as described in ASTM C430. The standard
implies that the SRM 114q is sieved using a sieve with an unknown opening (although it
should nominally be about 45 µm). The result is used with the certified value to calibrate
the sieve and correct results of unknown cements.
To verify the performance of the 114q material, we did a double verification as shown in
Table 11. The verification consisted of calculating the correction factor using one of the
SRMs and testing the other SRM using this correction factor. For example in column 1
(Table 11) SRM 114p is used to calculate the correction factor that is then used to correct
a measurement of SRM 114q. If everything it working as expected, the residue found for
SRM 114q should match the value found in the certificate, which it does. Similarly, the
results obtained for SRM 114p, when 114q is used to calibrate the sieve, do not disagree
with the value from the 114p certificate, although the uncertainty in the corrected result
for 114p is rather large.
14
Table 11: Residue Verification Using SRM’s 114p and 114q
Sieve Correction Factor Calculation SRM 114p SRM 114q
Certified residue on 45 µm sieve [%] 8.24 ± 0.37 0.79 ± 0.19
Residue for 1 g sample [g] 0.0824 ± 0.0037 0.0079 ± 0.0019
Residue on sieve being calibrated [g] 0.0683 ± 0.0068 0.0060 ± 0.0006
Difference [g] 0.0141 ± 0.0077 0.0019 ± 0.0020
Correction factor [%] 20.6442 ± 13.22 31.6667 ± 34.2949
Cement Tested SRM 114q SRM 114p
Residue from sample being tested [g] 0.0060 ± 0.0006 0.0683 ± 0.0068
Corrected residue [%] 0.7239 ± 0.1074 8.9928 ± 2.5090
Certified residue on 45 µm sieve [%] 0.79 ± 0.19 8.24 ± 0.37
Note: Uncertainties shown for each value are expanded uncertainties at the 95 %
confidence level. A coverage factor of k = 2 was used in all cases.
5 Summary of Certified Values
The certified values for the SRM 114q certificate are:
Measurementand ASTM Method Result
Specific Surface Area C 204-96a
(Blaine)
3818 cm2
/g ± 78 cm2
/g
(381.8 m2
/kg ± 7.8 m2
/kg)
Specific Surface Area C 115-96a
(Wagner) 2183 cm2
/g ± 160 cm2
/g
(218 m2
/kg ± 16 m2
/kg)
Sieve Residue C 430-96
(45 µm sieve)
0.79 % ± 0.19 %
15
6 Process Improvement
6.1 Packaging
As stated above, the cement received from the manufacturer was sealed in foil bags after
being blended. It was the original intention that each foil bag would be open, divided in
the vials and any left over would be discarded. This would ensure that the cements left in
the foil bags overnight (or longer due to scheduling) would not hydrate in between vial
filling. If hydration occurs the cement properties will change. As a further quality
assurance, the temperature, relative humidity should be recorded. If a log is kept of the
temperature, relative humidity, vials filled, it would results in a better correlation between
homogeneity problems and specific vials.
During the filling of this batch of 600 000 vials, the procedure outlined above was
followed but no log was kept of the temperature and relative humidity. Therefore, when it
was discovered that vials, checked for homogeneity using other methods such as PSD,
were found not satisfactory [13], it was not possible to rule out that the packaging
conditions were one of the effects.
This situation did not affect the data presented here probably because none of the tests
used are sensitive to complete dispersion, as it is the case for PSD measurements.
6.2 Testing
As shown in Table 3, one vial per box was used for the LOI testing. With this design,
box-to-box and vial-to-vial differences in the LOI results cannot be differentiated. One
minor improvement to the design for LOI testing in the future would be to sample two
vials per box so that potential vial-to-vial variability could be separated from box-to-box
variability in the LOI results. If necessary, half as many boxes could be sampled in order
to keep the total number of measurements the same. Reducing the number of boxes
sampled would reduce our ability to identify box-to-box differences, since some of the
degrees of freedom would be used to check for vial-to-vial variability, but the added
ability to separate vial-to-vial variability from box-to-box variability would give us the
potential for additional insight into the process that would offset that loss.
Because of the small sieve residue for this cement, some digitization was evident in the
sieve residue data. For future sieve residue assessments on cements with residues in this
low range, use of a balance with a finer resolution would be advantageous.
7 Acknowledgments
The authors would like to thank Max Peltz for helping with the sample preparations, and
Romayne Hines for helping in distribution of the samples for the round-robin. Special
thanks are extended also to Vince Hackley for his numerous suggestions and fruitful
16
discussions, and Edward Garboczi (NIST), Kenneth Snyder (NIST) and Charles
Hagwood (NIST) for their valuable comments.
8 References
1. “Standard Test Method for Fineness of Hydraulic Cement by Air Permeability
Apparatus”, ASTM C204-00 Volume: 04.01
2. “Standard Test Method for Fineness of Portland Cement by the Turbidimeter”,
ASTM C115-96a (2003) Volume: 04.01
3. “Standard Test Method for Fineness of Hydraulic Cement by the 45-µm (No. 325)
Sieve”, ASTM C430-96 (2003) Volume: 04.01
4. Ferraris, C.F, Hackley V.A., Aviles A.I., Buchanan C.E., "Analysis of the ASTM
Round-Robin Test on Particle Size Distribution of Portland Cement: Phase I" NISTIR
6883, May 2002 (http://ciks.cbt.nist.gov/~garbocz/nist6883/nistir6883.htm)
5. Ferraris, C.F, Hackley V.A., Aviles A.I., Buchanan C.E., "Analysis of the ASTM
Round-Robin Test on Particle Size Distribution of Portland Cement: Phase II"
NISTIR 6931, December 2002
6. Ferraris C.F., Hackley V.A., Avilés A.I., “Measurement of Particle Size Distribution
in Portland Cement Powder: Analysis of ASTM Round-Robin Studies”, Cement,
Concrete and Aggregate Journal, Dec. 2004, vol. 26 #2, pp 71-81
7. Blaine R.L., “A Simplified Air Permeability Fineness Apparatus” , ASTM Bulletin,
No.123, 1943, pp 51-55
8. Bean L. B., Dise J.R., “Causes of Variation in Chemical Analyses and Physical Tests
of Portland Cement”, NBS, Building Series #17, 1969
9. Wagner, L. A., “A Rapid Method for the Determination of the Specific Surface of
Portland Cement,” Proceedings, ASTM, ASTEA, Vol 33, Part II, 1933, p. 553
10. Montgomery, Douglas C., Design and Analysis of Experiments, 2nd
Edition, John
Wiley and Sons, New York, 1984
11. Gelman, A., Carlin, J.B., Stern, H.S., Rubin, D.B., Bayesian Data Analysis, Chapman
and Hall, London, 1995
12. Brooks S.P. and Gelman A. “Alternative methods for monitoring convergence of
iterative simulations,” Journal of Computational and Graphical Statistics, 7, 1998, pp
434-455
13. Ferraris, C.,F. Avilés A.I., Guthrie W., Haupt, R., MacDonald, B. S., Peltz, M.
“Certification of SRM 114q: Part II”, to be published in 2005
17
9 Appendices
Appendix A: Data received from the round robin for Blaine
Raw data as received: Grey [m2
/ kg]; white [s] Calculated Blaine (SRM 114p & data provided)
SRM 114p Vial #1 Vial #2 Vial #1 Vial #2
CCRL
Lab
Code Meas#1 Meas.#2 Box # Meas#1 Meas.#2 Box # Meas#1 Meas.#2 Box # Meas#1 Meas.#2 Box # Meas#1 Meas.#2
6 85.1 19 89.9 89.46 19 89.01 88.35 19 3878 3869 19 3859 3845
10 104 45 90.7 89.8 45 88.56 89.3 45 3525 3507 45 3483 3497
11 74 89 80 78 89 79 79 89 3924 3875 89 3899 3899
18 85 87.5 30 71 66.5 30 64.5 67.5 30 3424 3314 30 3264 3339
19 118 70 129.2 129.4 70 129.6 128.8 70 3949 3952 70 3955 3943
20 85.3 114 91.6 90.01 114 91.29 92.6 114 3912 3877 114 3905 3933
27 152 149 107 157 157 107 158 157 107 3855 3855 107 3867 3855
28 3800 81 3910 3910 81 3880 3900 81 3910 3910 81 3880 3900
40 109.6 108.7 109 121.1 119.9 109 115.5 117.9 109 3975 3956 109 3882 3922
41 75.7 9 76.9 76.7 9 75.9 76 9 3804 3799 9 3779 3781
43 91.4 55 95.2 95.1 55 95.7 95.8 55 3852 3850 55 3862 3864
54 3772 3770 89 3814 3748 89 3878 3882 89 3814 3748 89 3878 3882
56 3820 3840 50 3810 3770 50 3810 3790 50 3810 3770 50 3810 3790
60 114 114 80 121 120 80 119 120 80 3888 3872 80 3856 3872
69 77.4 76.8 40 78.8 79.1 40 78.6 78.2 40 3815 3823 40 3811 3801
73 80 58 83 82 58 80 81 58 3844 3821 58 3774 3798
75 3810 3800 77 3695 3715 77 3697 3708 77 3695 3715 77 3697 3708
84 115.4 120 116.555 115.7 120 122.1 121.4 120 3793 3779 120 3881 3870
92 68.8 66.56 118 71.35 68.0 118 70.17 69.5 118 3876 3784 118 3844 3827
95 77.5 77 80 85.5 85 80 85 85.5 80 3970 3959 80 3959 3970
105 85.4 85.9 11 86.7 86.9 11 85.7 86 11 3797 3801 11 3775 3782
121 81.4 47 83.20 84.6 47 84.3 84.1 47 3816 3847 47 3840 3836
123 84 88 105 80 88 83 83.5 88 4219 3683 88 3751 3763
18
Raw data as received: Grey [m2
/ kg]; white [s] Calculated Blaine (SRM 114p & data provided)
SRM 114p Vial #1 Vial #2 Vial #1 Vial #2
CCRL
Lab
Code Meas#1 Meas.#2 Box # Meas#1 Meas.#2 Box # Meas#1 Meas.#2 Box # Meas#1 Meas.#2 Box # Meas#1 Meas.#2
124 70 70.5 13 75 75.5 13 75.5 75.5 13 3900 3912 13 3912 3912
125 3752 11 3861 3861 11 3796 3752 11 3861 3861 11 3796 3752
148 83.9 82.8 75 81.0 79.3 75 82.8 82.2 75 3720 3680 75 3761 3748
151 89.1 86.6 116 87.3 86.0 116 90.8 88.7 116 3762 3734 116 3837 3793
157 93 58 95 94 58 94 93 58 3814 3794 58 3794 3774
162 3745 3756 14 3796 3806 14 3777 3788 14 3796 3806 14 3777 3788
166 81 81 86 90 90 86 90 90 86 3978 3978 86 3978 3978
167 3750 3730 98 3800 3800 98 3860 3850 98 3800 3800 98 3860 3850
175 106 110 30 110 111 30 109 111 30 3809 3827 30 3792 3827
178 77.5 77.4 3 67.4 69.5 3 73.6 70.3 3 3521 3575 3 3679 3596
205 90 89.8 50 91.9 90.9 50 90.9 91.5 50 3816 3795 50 3795 3807
209 85.3 84 66 90.7 89.9 113 88.4 91.0 66 3907 3889 113 3857 3913
222 87.7 28 87.8 86.5 28 87.6 87.3 28 3776 3748 28 3772 3765
225 105 106 40 110 111 40 109 110 40 3854 3871 40 3836 3854
245 80 19 73 72.5 19 73 74 19 3605 3593 19 3605 3630
246 71.5 21 81 80.3 21 79.8 79.1 21 4017 4000 21 3987 3970
247 88 43 93 109 92 43 3880 0 109 3859
254 3765 3788 97 3854 3846 97 3807 3815 97 3854 3846 97 3807 3815
255 3730 77 3800 3720 77 3800 3839 77 3800 3720 77 3800 3839
284 97.0 97.5 86 104.0 104.0 86 104.0 103.5 86 3903 3903 86 3903 3893
303 92.9 92.2 32 94.5 93.9 32 95.5 92.4 32 3814 3801 32 3834 3771
309 88 88 116 90 90 116 90 90 116 3817 3817 116 3817 3817
354 77.7 76.5 31 80.95 80.65 31 79.82 78.75 31 3867 3860 31 3840 3814
360 100 100 3 100 98 3 99 97 3 3774 3736 3 3755 3717
413 Too variable to report
441 3760 3760 114 3740 3650 114 3710 3690 114 3740 3650 114 3710 3690
493 83 84 32 87 90 32 90 88 32 3852 3918 32 3918 3874
494 97 98 66 100 100 66 98 98 66 3822 3822 66 3784 3784
19
Raw data as received: Grey [m2
/ kg]; white [s] Calculated Blaine (SRM 114p & data provided)
SRM 114p Vial #1 Vial #2 Vial #1 Vial #2
CCRL
Lab
Code Meas#1 Meas.#2 Box # Meas#1 Meas.#2 Box # Meas#1 Meas.#2 Box # Meas#1 Meas.#2 Box # Meas#1 Meas.#2
551 3751 3769 112 3892 3887 112 3926 3930 112 3892 3887 112 3926 3930
557 100 100 18 101 100 18 100 101 18 3793 3774 18 3774 3793
605 3816 28 3879 3879 28 3859 3816 28 3879 3879 28 3859 3816
690 3774 88 3801 3801 88 3828 3828 88 3801 3801 88 3828 3828
736 99.6 97.8 71 108.2 105.3 71 107.6 106.5 71 3951 3898 71 3939 3920
886 3705 3735 119 3832 3784 119 3624 3851 119 3832 3784 119 3624 3851
932 115.4 19 121.4 122.9 75 123.2 123.8 19 3871 3895 75 3899 3909
1042 111.6 111.1 21 114.4 114.3 21 110.9 112.6 21 3824 3823 21 3766 3795
1054 83 85 14 93 93 14 90 90 14 3971 3971 14 3907 3907
1251 3765 3757 107 3891 3874 107 3883 3883 107 3891 3874 107 3883 3883
1715 72.9 72.3 13 74.8 75.1 13 75.6 75.5 13 3829 3837 13 3850 3848
1773 101.1 101.4 47 91.3 91.6 47 90.4 90.7 47 3584 3590 47 3566 3572
1819 82.59 83.00 9 86.4 87.1 9 86.1 86.5 9 3855 3870 9 3850 3858
1916 88.9 88.7 31 94.1 95.2 31 95.6 94.2 31 3884 3908 31 3916 3887
1940 3716 3753 18 3870 3901 18 3825 3922 18 3870 3901 18 3825 3922
2116 47.5 48.0 118 50.5 50.0 118 50.5 49.5 118 3881 3862 118 3881 3843
2190 85.3 86.0 111 86.3 85.8 111 87.5 86.3 111 3789 3778 111 3815 3788
2191 75.4 74.3 111 73.6 77.4 111 79.7 81.4 111 3744 3837 111 3896 3937
NA 65.2 64.8 70 66.7 67.0 70 66.5 66.5 70 3824 3832 70 3816 3818
20
Appendix B: Data received from the round robin for Wagner
114p Box A Box BCCRL
code Meas. #1 Meas. #2 Box # Meas. #1 Meas. #2 Box # Meas. #1 Meas. #2
73 2049 9 1984 1986 9 1997 2040
125 2130 9 2330 2290 9 2310 2300
205 2070 119 2380 2380 119 2380 2350
247 43 2280 2240 109 2260 2280
254 2060 2085 43 2046 2020 43 2117 2043
494 2088 2078 66 2113 2126 66 2135 2079
551 2045 2067 113 2227 2262 113 2272 2232
21
Appendix C: Data obtained for Residue
ResidueDay Box Vial
Sieve 1 Sieve 2 Sieve 3
1 118 1 0.0010 g 0.0035 g 0.0015 g
1 35 1 0.0150 g 0.0060 g 0.0030 g
1 118 1 0.0160 g 0.0050 g 0.0010 g
1 35 2 0.0160 g 0.0050 g 0.0020 g
1 35 2 0.0155 g 0.0060 g 0.0010 g
1 35 1 0.0150 g 0.0055 g 0.0030 g
1 118 2 0.0170 g 0.0050 g 0.0025 g
1 118 2 0.0150 g 0.0060 g 0.0025 g
2 47 2 0.0160 g 0.0060 g 0.0025 g
2 27 1 0.0180 g 0.0065 g 0.0010 g
2 27 1 0.0180 g 0.0060 g 0.0020 g
2 47 2 0.0160 g 0.0060 g 0.0025 g
2 27 2 0.0185 g 0.0060 g 0.0020 g
2 47 1 0.0175 g 0.0060 g 0.0030 g
2 27 2 0.0160 g 0.0055 g 0.0025 g
2 47 1 0.0170 g 0.0065 g 0.0020 g
3 53 2 0.0150 g 0.0020 g
3 98 1 0.0165 g 0.0065 g 0.0025 g
3 53 2 0.0160 g 0.0065 g 0.0025 g
3 98 2 0.0170 g 0.0075 g 0.0025 g
3 98 2 0.0155 g 0.0060 g 0.0020 g
3 98 1 0.0150 g 0.0060 g 0.0025 g
3 53 1 0.0170 g 0.0070 g 0.0025 g
3 53 1 0.0150 g 0.0060 g 0.0015 g
4 76 2 0.0135 g 0.0055 g 0.0025 g
4 72 2 0.0165 g 0.0060 g 0.0025 g
4 76 1 0.0170 g 0.0065 g 0.0025 g
4 76 2 0.0150 g 0.0065 g 0.0025 g
4 76 1 0.0135 g 0.0060 g 0.0020 g
4 72 1 0.0195 g 0.0070 g 0.0025 g
4 72 1 0.0175 g 0.0065 g 0.0025 g
4 72 2 0.0145 g 0.0065 g 0.0025 g
5 56 2 0.0160 g 0.0055 g 0.0025 g
5 56 2 0.0160 g 0.0060 g 0.0020 g
5 9 1 0.0180 g 0.0065 g 0.0030 g
5 56 1 0.0170 g 0.0070 g 0.0025 g
5 9 2 0.0155 g 0.0065 g 0.0025 g
5 56 1 0.0165 g 0.0060 g 0.0025 g
5 9 1 0.0180 g 0.0065 g 0.0025 g
5 9 2 0.0165 g 0.0065 g 0.0025 g
0.0060 g
Note: Box 118 vial 1 - slightly different color than that of box 118 vial 2 and both vials 1 and 2
from box 35
22
10 Certificate of SRM 114q
Below the certificate of SRM 114q is provided for information only. As, the certificate will be
updated later in 2005 to add the particle size distribution of the cement [13], the official version
is the available online at: https://srmors.nist.gov/certificates/view_cert2gif.cfm?certificate=114q
Or by selecting “Standard Reference Materials” from the website www.NIST.GOV and typing in
114q
23
National Institute of Standards & Technology
Certificate of Analysis
Standard Reference Material
114q
Portland Cement Fineness Standard
This Standard Reference Material (SRM) is intended for use in calibrating fineness testing equipment according to
ASTM Standard Methods. The SRM unit consists of 20 glass vials with plastic caps containing powdered cement
(each vial is contained in a sealed foil bag). Each vial contains approximately 5 g of cement.
Certified Values and Uncertainties: A NIST certified value is a value for which NIST has the highest confidence
in its accuracy and that all known or suspected sources of bias have been investigated or accounted for by NIST.
The certified values for specific surface area and sieve residue are given in Table 1. The certified values for the
surface area are the mean of results from analyses performed by cooperating laboratories. The certified value for
sieve residue was calculated from a quadratic fit of NIST data using three sieves having openings ranging from
38 µm to 56 µm.
The expanded uncertainties of the certified values for specific surface area were calculated according to the NIST
uncertainty policy described in the NIST Technical Note 1297 [1], and are at the 95 % confidence level. The
uncertainties include measurement variability within and between laboratories. The surface area uncertainties also
include material variability and the uncertainty of the surface area values for the superseded SRM 114p Portland
Cement Fineness Standard, which was used as the calibrant for this material. The expanded uncertainty for the
sieve residue was computed using a Bayesian analysis and is also at the 95 % probability level. The expanded
uncertainty accounts for the variability of random measurement effects, sieve calibrations, and material
inhomogeneity.
Table l. Certified Values
Measurand ASTM Method Certified Value and Expanded
Uncertainty
Specific Surface Area C 204-96a(a)
(Blaine)
3818 cm2
/g ± 78 cm2
/g
(381.8 m2
/kg ± 7.8 m2
/kg)
Specific Surface Area C 115-96a(b)
(Wagner)
2183 cm2
/g ± 160 cm2
/g
(218 m2
/kg ± 16 m2
/kg)
Sieve Residue (45 µm residue) C 430-96(c) 0.79 % ± 0.19 %
(a)
Standard Test Method for Fineness of Portland Cement by Air Permeability Apparatus [Blaine].
(b)
Standard Test Method for Fineness of Portland Cement by the Turbidimeter [Wagner].
(c)
Standard Test Method for Fineness of Hydraulic Cement by the 45 µm (No. 325) Sieve.
Expiration of Certification: The certification of SRM 114q is valid, within the measurement uncertainties
specified, until 31 December 2016, provided the SRM is handled in accordance with the instructions given in this
certificate (see “Instructions for Use”). This certification is nullified if the SRM is contaminated or otherwise
modified.
Maintenance of Certification: NIST will monitor representative samples from this SRM lot over the period of its
certification. If substantive changes occur that affect the certification before the expiration date, NIST will notify
the purchaser. Registration (see attached sheet) will facilitate notification.
James St. Pierre, Chief
Materials and Construction Research Division
Gaithersburg, MD 20899 Robert L. Watters, Jr., Chief
Certificate Issue Date: 24 March 2005 Measurement Services Division
24
See Certificate Revision History on Last Page
25
The preparation of the material and the coordination of the technical measurements leading to certification were
performed by C. Ferraris of the NIST Materials and Construction Research Division.
Statistical consultation on measurement design and analysis of the certification data was performed by W.F. Guthrie
and A.I. Avilés of the NIST Statistical Engineering Division.
The support aspects involved in the issuance of this SRM were coordinated through the NIST Standard Reference
Materials Program by B.S. MacDonald of the NIST Measurement Services Division.
INSTRUCTIONS FOR USE
Stability and Use: This material is considered to be extremely hygroscopic. Based on measurements in 1993 of
several earlier renewals of SRM 114, the properties certified are stable as long as the foil bag remains sealed. The
specific surface area of cement changes on exposure to the moisture in air. Therefore, this cement should be used
immediately after opening the outer foil bag.
Allow the sealed foil bag to equilibrate to testing temperature before opening. To open the pouch, cut off the end
with scissors. Fluff the cement in accordance with ASTM Standard C204, Section 3.4, allow the cement to settle for
2 minutes, and then perform the measurement.
Material Selection and Packaging: The desired properties were determined to be generally the same as those
selected for the previous issues of SRM 114; however, in order to better represent current cements, the material
selected for SRM 114q consists of a finer particle size distribution than previously issued. The Cement and
Concrete Reference Laboratory (CCRL) and NIST identified a plant with suitable cement: Lehigh Cement Company
(Union Bridge, Maryland)4
donated 1300 kg of appropriate cement for this SRM. The material selected was Type I
according to the ASTM C 150 Standard Classification and had a mass fraction of less than 8 % tricalcium aluminate
(C3A). The material was collected for shipment to NIST directly from the finish mill process stream into bags.
Upon arrival at NIST, the cement was blended in a V-blender (1.68 m3
) and then transferred to 208 L (55 gallon)
drums lined with 0.015 cm (6 mil) polyethylene liners to minimize hydration of the cement in storage prior to
preparation and packaging. Over the next two days, the cement from each drum was sealed in foil bags, each
containing about 16 kg of cement. The foil bags were stored in a climate-controlled area. The contents of each bag
were subsequently packaged into vials. The vials were then capped and packaged in boxes of about 500 vials per
box. The boxes were sequentially labeled from 1 to 118. About 5 boxes were filled per day. Nearly 59 000 glass
vials, each containing approximately 5 g of cement, were produced. Each vial was then individually sealed in a foil
bag. Vials were selected from the lot by stratified random sampling [2] for both homogeneity and certification
analyses. Selected vials were shipped to the participating laboratories for measurements. The remaining vials were
packaged into SRM unit boxes of 20 vials each.
Homogeneity Assessment and Certification Analyses: Homogeneity testing of the material was performed on
48 random-selected samples. Measurements of the loss of ignition (LoI) showed no reversible moisture take-up by
the cement during packaging. The data received from the round-robin participants were also checked for laboratory-
to-laboratory (or day-to-day in the case of sieve residue) variability, box-to-box variability, and vial-to-vial
variability. No significant box-to-box or vial-to-vial variability was detected except for the Wagner or sieve residue
tests, and therefore it was determined that the samples were homogeneous for the ASTM measurements. Significant
vial-to-vial variability was observed using the Blaine test and the certified values reflect this source of uncertainty.
Certification analyses for specific surface areas using ASTM Standard Test Methods C 115-96a and C 204-00 were
performed on two samples at each of the participating laboratories. SRM 114p Portland Cement Fineness Standard
was used for calibration. Raw data were submitted by each laboratory to NIST for tabulation and calculation of
surface areas, which for the Blaine test, assumed a density of 3.15 g/cm3
. The density was measured twice at NIST:
the results were 3.255 g/cm3
and 3.248 g/cm3
.
Certification analyses according to ASTM Standard Test Method C 430-96 for the 45 µm sieve residue were
performed at NIST on 40 samples from 20 vials of cement.
Laboratories performing certification analyses are members of the CCRL (http://www.ccrl.us) proficiency program.
The full list is provided in the report describing the details of the certification process [2].
4
Certain commercial equipment, instruments, or materials are identified in this certificate in order to specify adequately
the experimental procedure. Such identification does not imply recommendation or endorsement by the National Institute of
Standards and Technology, nor does it imply that the materials or equipment identified are necessarily the best available for the
purpose.
26
Information Values: NIST information values are considered to be of interest to the SRM user, but are not
certified because insufficient information is available to assess adequately the uncertainty associated with the values
or only a limited number of analyses were performed. Information values for SRM 114q are given in Tables 2 and
3. Table 2 provides the approximate chemical composition determined by ASTM Standard Test Method C114-02.
The analysis of this cement (CCRL Portland Cement Proficiency Sample No. 150) was performed by 70 to 170
laboratories; the number of participating laboratories depends on the value measured.
Table 2. Information Values for Chemical Composition
Compound Mass Fraction Compound Mass Fraction
(%) (%)
CaO 64.0 K2
O 0.70
SiO2
20.7 TiO2
0.30
A12
O3
4.7 P2
O5
0.12
Fe2
O3
3.2 Na2
O 0.07
SO3
2.4 MgO 2.2
Loss on Ignition 1.67
Table 3 provides the calculation of cement compounds according to ASTM C 150-02.
Table 3. Information Values for Cement Compounds (Calculation from Table 2)
Compound Mass Fraction
(%)
C3
S (tricalcium silicate) 60
C2
S (dicalcium silicate) 14
C3
A (tricalcium aluminate) 7
C4
AF(tetracalcium alumino-ferrite) 10
REFERENCES
[1] Taylor, B.N.; Kuyatt, C.E.; NIST Technical Note 1297, Guidelines for Evaluating and Expressing the
Uncertainty of NIST Measurement Results (1993).
[2] Ferraris, C.F.; Avilés A.I.; Guthrie W.; Haupt, R.; Certification of SRM 114q; Phase I, NIST SP260-
161 (2005).
Certificate Revision History: 24 March 2005 (This technical revision corrects the certified values and expanded uncertainties for the
measurand); 23 March 2005 (Original certificate date).
Users of this SRM should ensure that the certificate in their possession is current. This can be accomplished by
contacting the SRM Program at: telephone (301) 975-6776; fax (301) 926-4751; e-mail srminfo@nist.gov; or via
the Internet http://www.nist.gov/srm.
27
28

More Related Content

Recently uploaded

Discovery of an Accretion Streamer and a Slow Wide-angle Outflow around FUOri...
Discovery of an Accretion Streamer and a Slow Wide-angle Outflow around FUOri...Discovery of an Accretion Streamer and a Slow Wide-angle Outflow around FUOri...
Discovery of an Accretion Streamer and a Slow Wide-angle Outflow around FUOri...Sérgio Sacani
 
❤Jammu Kashmir Call Girls 8617697112 Personal Whatsapp Number 💦✅.
❤Jammu Kashmir Call Girls 8617697112 Personal Whatsapp Number 💦✅.❤Jammu Kashmir Call Girls 8617697112 Personal Whatsapp Number 💦✅.
❤Jammu Kashmir Call Girls 8617697112 Personal Whatsapp Number 💦✅.Nitya salvi
 
GBSN - Microbiology (Unit 2)
GBSN - Microbiology (Unit 2)GBSN - Microbiology (Unit 2)
GBSN - Microbiology (Unit 2)Areesha Ahmad
 
Labelling Requirements and Label Claims for Dietary Supplements and Recommend...
Labelling Requirements and Label Claims for Dietary Supplements and Recommend...Labelling Requirements and Label Claims for Dietary Supplements and Recommend...
Labelling Requirements and Label Claims for Dietary Supplements and Recommend...Lokesh Kothari
 
Biogenic Sulfur Gases as Biosignatures on Temperate Sub-Neptune Waterworlds
Biogenic Sulfur Gases as Biosignatures on Temperate Sub-Neptune WaterworldsBiogenic Sulfur Gases as Biosignatures on Temperate Sub-Neptune Waterworlds
Biogenic Sulfur Gases as Biosignatures on Temperate Sub-Neptune WaterworldsSérgio Sacani
 
9654467111 Call Girls In Raj Nagar Delhi Short 1500 Night 6000
9654467111 Call Girls In Raj Nagar Delhi Short 1500 Night 60009654467111 Call Girls In Raj Nagar Delhi Short 1500 Night 6000
9654467111 Call Girls In Raj Nagar Delhi Short 1500 Night 6000Sapana Sha
 
SAMASTIPUR CALL GIRL 7857803690 LOW PRICE ESCORT SERVICE
SAMASTIPUR CALL GIRL 7857803690  LOW PRICE  ESCORT SERVICESAMASTIPUR CALL GIRL 7857803690  LOW PRICE  ESCORT SERVICE
SAMASTIPUR CALL GIRL 7857803690 LOW PRICE ESCORT SERVICEayushi9330
 
Chemical Tests; flame test, positive and negative ions test Edexcel Internati...
Chemical Tests; flame test, positive and negative ions test Edexcel Internati...Chemical Tests; flame test, positive and negative ions test Edexcel Internati...
Chemical Tests; flame test, positive and negative ions test Edexcel Internati...ssuser79fe74
 
Justdial Call Girls In Indirapuram, Ghaziabad, 8800357707 Escorts Service
Justdial Call Girls In Indirapuram, Ghaziabad, 8800357707 Escorts ServiceJustdial Call Girls In Indirapuram, Ghaziabad, 8800357707 Escorts Service
Justdial Call Girls In Indirapuram, Ghaziabad, 8800357707 Escorts Servicemonikaservice1
 
GUIDELINES ON SIMILAR BIOLOGICS Regulatory Requirements for Marketing Authori...
GUIDELINES ON SIMILAR BIOLOGICS Regulatory Requirements for Marketing Authori...GUIDELINES ON SIMILAR BIOLOGICS Regulatory Requirements for Marketing Authori...
GUIDELINES ON SIMILAR BIOLOGICS Regulatory Requirements for Marketing Authori...Lokesh Kothari
 
Feature-aligned N-BEATS with Sinkhorn divergence (ICLR '24)
Feature-aligned N-BEATS with Sinkhorn divergence (ICLR '24)Feature-aligned N-BEATS with Sinkhorn divergence (ICLR '24)
Feature-aligned N-BEATS with Sinkhorn divergence (ICLR '24)Joonhun Lee
 
Call Girls Alandi Call Me 7737669865 Budget Friendly No Advance Booking
Call Girls Alandi Call Me 7737669865 Budget Friendly No Advance BookingCall Girls Alandi Call Me 7737669865 Budget Friendly No Advance Booking
Call Girls Alandi Call Me 7737669865 Budget Friendly No Advance Bookingroncy bisnoi
 
Nanoparticles synthesis and characterization​ ​
Nanoparticles synthesis and characterization​  ​Nanoparticles synthesis and characterization​  ​
Nanoparticles synthesis and characterization​ ​kaibalyasahoo82800
 
Forensic Biology & Its biological significance.pdf
Forensic Biology & Its biological significance.pdfForensic Biology & Its biological significance.pdf
Forensic Biology & Its biological significance.pdfrohankumarsinghrore1
 
GBSN - Biochemistry (Unit 1)
GBSN - Biochemistry (Unit 1)GBSN - Biochemistry (Unit 1)
GBSN - Biochemistry (Unit 1)Areesha Ahmad
 
Pulmonary drug delivery system M.pharm -2nd sem P'ceutics
Pulmonary drug delivery system M.pharm -2nd sem P'ceuticsPulmonary drug delivery system M.pharm -2nd sem P'ceutics
Pulmonary drug delivery system M.pharm -2nd sem P'ceuticssakshisoni2385
 
Factory Acceptance Test( FAT).pptx .
Factory Acceptance Test( FAT).pptx       .Factory Acceptance Test( FAT).pptx       .
Factory Acceptance Test( FAT).pptx .Poonam Aher Patil
 
TEST BANK For Radiologic Science for Technologists, 12th Edition by Stewart C...
TEST BANK For Radiologic Science for Technologists, 12th Edition by Stewart C...TEST BANK For Radiologic Science for Technologists, 12th Edition by Stewart C...
TEST BANK For Radiologic Science for Technologists, 12th Edition by Stewart C...ssifa0344
 

Recently uploaded (20)

Discovery of an Accretion Streamer and a Slow Wide-angle Outflow around FUOri...
Discovery of an Accretion Streamer and a Slow Wide-angle Outflow around FUOri...Discovery of an Accretion Streamer and a Slow Wide-angle Outflow around FUOri...
Discovery of an Accretion Streamer and a Slow Wide-angle Outflow around FUOri...
 
❤Jammu Kashmir Call Girls 8617697112 Personal Whatsapp Number 💦✅.
❤Jammu Kashmir Call Girls 8617697112 Personal Whatsapp Number 💦✅.❤Jammu Kashmir Call Girls 8617697112 Personal Whatsapp Number 💦✅.
❤Jammu Kashmir Call Girls 8617697112 Personal Whatsapp Number 💦✅.
 
GBSN - Microbiology (Unit 2)
GBSN - Microbiology (Unit 2)GBSN - Microbiology (Unit 2)
GBSN - Microbiology (Unit 2)
 
Labelling Requirements and Label Claims for Dietary Supplements and Recommend...
Labelling Requirements and Label Claims for Dietary Supplements and Recommend...Labelling Requirements and Label Claims for Dietary Supplements and Recommend...
Labelling Requirements and Label Claims for Dietary Supplements and Recommend...
 
Biogenic Sulfur Gases as Biosignatures on Temperate Sub-Neptune Waterworlds
Biogenic Sulfur Gases as Biosignatures on Temperate Sub-Neptune WaterworldsBiogenic Sulfur Gases as Biosignatures on Temperate Sub-Neptune Waterworlds
Biogenic Sulfur Gases as Biosignatures on Temperate Sub-Neptune Waterworlds
 
9654467111 Call Girls In Raj Nagar Delhi Short 1500 Night 6000
9654467111 Call Girls In Raj Nagar Delhi Short 1500 Night 60009654467111 Call Girls In Raj Nagar Delhi Short 1500 Night 6000
9654467111 Call Girls In Raj Nagar Delhi Short 1500 Night 6000
 
SAMASTIPUR CALL GIRL 7857803690 LOW PRICE ESCORT SERVICE
SAMASTIPUR CALL GIRL 7857803690  LOW PRICE  ESCORT SERVICESAMASTIPUR CALL GIRL 7857803690  LOW PRICE  ESCORT SERVICE
SAMASTIPUR CALL GIRL 7857803690 LOW PRICE ESCORT SERVICE
 
Chemical Tests; flame test, positive and negative ions test Edexcel Internati...
Chemical Tests; flame test, positive and negative ions test Edexcel Internati...Chemical Tests; flame test, positive and negative ions test Edexcel Internati...
Chemical Tests; flame test, positive and negative ions test Edexcel Internati...
 
Justdial Call Girls In Indirapuram, Ghaziabad, 8800357707 Escorts Service
Justdial Call Girls In Indirapuram, Ghaziabad, 8800357707 Escorts ServiceJustdial Call Girls In Indirapuram, Ghaziabad, 8800357707 Escorts Service
Justdial Call Girls In Indirapuram, Ghaziabad, 8800357707 Escorts Service
 
GUIDELINES ON SIMILAR BIOLOGICS Regulatory Requirements for Marketing Authori...
GUIDELINES ON SIMILAR BIOLOGICS Regulatory Requirements for Marketing Authori...GUIDELINES ON SIMILAR BIOLOGICS Regulatory Requirements for Marketing Authori...
GUIDELINES ON SIMILAR BIOLOGICS Regulatory Requirements for Marketing Authori...
 
Feature-aligned N-BEATS with Sinkhorn divergence (ICLR '24)
Feature-aligned N-BEATS with Sinkhorn divergence (ICLR '24)Feature-aligned N-BEATS with Sinkhorn divergence (ICLR '24)
Feature-aligned N-BEATS with Sinkhorn divergence (ICLR '24)
 
Call Girls Alandi Call Me 7737669865 Budget Friendly No Advance Booking
Call Girls Alandi Call Me 7737669865 Budget Friendly No Advance BookingCall Girls Alandi Call Me 7737669865 Budget Friendly No Advance Booking
Call Girls Alandi Call Me 7737669865 Budget Friendly No Advance Booking
 
Nanoparticles synthesis and characterization​ ​
Nanoparticles synthesis and characterization​  ​Nanoparticles synthesis and characterization​  ​
Nanoparticles synthesis and characterization​ ​
 
Site Acceptance Test .
Site Acceptance Test                    .Site Acceptance Test                    .
Site Acceptance Test .
 
Forensic Biology & Its biological significance.pdf
Forensic Biology & Its biological significance.pdfForensic Biology & Its biological significance.pdf
Forensic Biology & Its biological significance.pdf
 
GBSN - Biochemistry (Unit 1)
GBSN - Biochemistry (Unit 1)GBSN - Biochemistry (Unit 1)
GBSN - Biochemistry (Unit 1)
 
Pulmonary drug delivery system M.pharm -2nd sem P'ceutics
Pulmonary drug delivery system M.pharm -2nd sem P'ceuticsPulmonary drug delivery system M.pharm -2nd sem P'ceutics
Pulmonary drug delivery system M.pharm -2nd sem P'ceutics
 
Factory Acceptance Test( FAT).pptx .
Factory Acceptance Test( FAT).pptx       .Factory Acceptance Test( FAT).pptx       .
Factory Acceptance Test( FAT).pptx .
 
Clean In Place(CIP).pptx .
Clean In Place(CIP).pptx                 .Clean In Place(CIP).pptx                 .
Clean In Place(CIP).pptx .
 
TEST BANK For Radiologic Science for Technologists, 12th Edition by Stewart C...
TEST BANK For Radiologic Science for Technologists, 12th Edition by Stewart C...TEST BANK For Radiologic Science for Technologists, 12th Edition by Stewart C...
TEST BANK For Radiologic Science for Technologists, 12th Edition by Stewart C...
 

Featured

2024 State of Marketing Report – by Hubspot
2024 State of Marketing Report – by Hubspot2024 State of Marketing Report – by Hubspot
2024 State of Marketing Report – by HubspotMarius Sescu
 
Everything You Need To Know About ChatGPT
Everything You Need To Know About ChatGPTEverything You Need To Know About ChatGPT
Everything You Need To Know About ChatGPTExpeed Software
 
Product Design Trends in 2024 | Teenage Engineerings
Product Design Trends in 2024 | Teenage EngineeringsProduct Design Trends in 2024 | Teenage Engineerings
Product Design Trends in 2024 | Teenage EngineeringsPixeldarts
 
How Race, Age and Gender Shape Attitudes Towards Mental Health
How Race, Age and Gender Shape Attitudes Towards Mental HealthHow Race, Age and Gender Shape Attitudes Towards Mental Health
How Race, Age and Gender Shape Attitudes Towards Mental HealthThinkNow
 
AI Trends in Creative Operations 2024 by Artwork Flow.pdf
AI Trends in Creative Operations 2024 by Artwork Flow.pdfAI Trends in Creative Operations 2024 by Artwork Flow.pdf
AI Trends in Creative Operations 2024 by Artwork Flow.pdfmarketingartwork
 
PEPSICO Presentation to CAGNY Conference Feb 2024
PEPSICO Presentation to CAGNY Conference Feb 2024PEPSICO Presentation to CAGNY Conference Feb 2024
PEPSICO Presentation to CAGNY Conference Feb 2024Neil Kimberley
 
Content Methodology: A Best Practices Report (Webinar)
Content Methodology: A Best Practices Report (Webinar)Content Methodology: A Best Practices Report (Webinar)
Content Methodology: A Best Practices Report (Webinar)contently
 
How to Prepare For a Successful Job Search for 2024
How to Prepare For a Successful Job Search for 2024How to Prepare For a Successful Job Search for 2024
How to Prepare For a Successful Job Search for 2024Albert Qian
 
Social Media Marketing Trends 2024 // The Global Indie Insights
Social Media Marketing Trends 2024 // The Global Indie InsightsSocial Media Marketing Trends 2024 // The Global Indie Insights
Social Media Marketing Trends 2024 // The Global Indie InsightsKurio // The Social Media Age(ncy)
 
Trends In Paid Search: Navigating The Digital Landscape In 2024
Trends In Paid Search: Navigating The Digital Landscape In 2024Trends In Paid Search: Navigating The Digital Landscape In 2024
Trends In Paid Search: Navigating The Digital Landscape In 2024Search Engine Journal
 
5 Public speaking tips from TED - Visualized summary
5 Public speaking tips from TED - Visualized summary5 Public speaking tips from TED - Visualized summary
5 Public speaking tips from TED - Visualized summarySpeakerHub
 
ChatGPT and the Future of Work - Clark Boyd
ChatGPT and the Future of Work - Clark Boyd ChatGPT and the Future of Work - Clark Boyd
ChatGPT and the Future of Work - Clark Boyd Clark Boyd
 
Getting into the tech field. what next
Getting into the tech field. what next Getting into the tech field. what next
Getting into the tech field. what next Tessa Mero
 
Google's Just Not That Into You: Understanding Core Updates & Search Intent
Google's Just Not That Into You: Understanding Core Updates & Search IntentGoogle's Just Not That Into You: Understanding Core Updates & Search Intent
Google's Just Not That Into You: Understanding Core Updates & Search IntentLily Ray
 
Time Management & Productivity - Best Practices
Time Management & Productivity -  Best PracticesTime Management & Productivity -  Best Practices
Time Management & Productivity - Best PracticesVit Horky
 
The six step guide to practical project management
The six step guide to practical project managementThe six step guide to practical project management
The six step guide to practical project managementMindGenius
 
Beginners Guide to TikTok for Search - Rachel Pearson - We are Tilt __ Bright...
Beginners Guide to TikTok for Search - Rachel Pearson - We are Tilt __ Bright...Beginners Guide to TikTok for Search - Rachel Pearson - We are Tilt __ Bright...
Beginners Guide to TikTok for Search - Rachel Pearson - We are Tilt __ Bright...RachelPearson36
 

Featured (20)

2024 State of Marketing Report – by Hubspot
2024 State of Marketing Report – by Hubspot2024 State of Marketing Report – by Hubspot
2024 State of Marketing Report – by Hubspot
 
Everything You Need To Know About ChatGPT
Everything You Need To Know About ChatGPTEverything You Need To Know About ChatGPT
Everything You Need To Know About ChatGPT
 
Product Design Trends in 2024 | Teenage Engineerings
Product Design Trends in 2024 | Teenage EngineeringsProduct Design Trends in 2024 | Teenage Engineerings
Product Design Trends in 2024 | Teenage Engineerings
 
How Race, Age and Gender Shape Attitudes Towards Mental Health
How Race, Age and Gender Shape Attitudes Towards Mental HealthHow Race, Age and Gender Shape Attitudes Towards Mental Health
How Race, Age and Gender Shape Attitudes Towards Mental Health
 
AI Trends in Creative Operations 2024 by Artwork Flow.pdf
AI Trends in Creative Operations 2024 by Artwork Flow.pdfAI Trends in Creative Operations 2024 by Artwork Flow.pdf
AI Trends in Creative Operations 2024 by Artwork Flow.pdf
 
Skeleton Culture Code
Skeleton Culture CodeSkeleton Culture Code
Skeleton Culture Code
 
PEPSICO Presentation to CAGNY Conference Feb 2024
PEPSICO Presentation to CAGNY Conference Feb 2024PEPSICO Presentation to CAGNY Conference Feb 2024
PEPSICO Presentation to CAGNY Conference Feb 2024
 
Content Methodology: A Best Practices Report (Webinar)
Content Methodology: A Best Practices Report (Webinar)Content Methodology: A Best Practices Report (Webinar)
Content Methodology: A Best Practices Report (Webinar)
 
How to Prepare For a Successful Job Search for 2024
How to Prepare For a Successful Job Search for 2024How to Prepare For a Successful Job Search for 2024
How to Prepare For a Successful Job Search for 2024
 
Social Media Marketing Trends 2024 // The Global Indie Insights
Social Media Marketing Trends 2024 // The Global Indie InsightsSocial Media Marketing Trends 2024 // The Global Indie Insights
Social Media Marketing Trends 2024 // The Global Indie Insights
 
Trends In Paid Search: Navigating The Digital Landscape In 2024
Trends In Paid Search: Navigating The Digital Landscape In 2024Trends In Paid Search: Navigating The Digital Landscape In 2024
Trends In Paid Search: Navigating The Digital Landscape In 2024
 
5 Public speaking tips from TED - Visualized summary
5 Public speaking tips from TED - Visualized summary5 Public speaking tips from TED - Visualized summary
5 Public speaking tips from TED - Visualized summary
 
ChatGPT and the Future of Work - Clark Boyd
ChatGPT and the Future of Work - Clark Boyd ChatGPT and the Future of Work - Clark Boyd
ChatGPT and the Future of Work - Clark Boyd
 
Getting into the tech field. what next
Getting into the tech field. what next Getting into the tech field. what next
Getting into the tech field. what next
 
Google's Just Not That Into You: Understanding Core Updates & Search Intent
Google's Just Not That Into You: Understanding Core Updates & Search IntentGoogle's Just Not That Into You: Understanding Core Updates & Search Intent
Google's Just Not That Into You: Understanding Core Updates & Search Intent
 
How to have difficult conversations
How to have difficult conversations How to have difficult conversations
How to have difficult conversations
 
Introduction to Data Science
Introduction to Data ScienceIntroduction to Data Science
Introduction to Data Science
 
Time Management & Productivity - Best Practices
Time Management & Productivity -  Best PracticesTime Management & Productivity -  Best Practices
Time Management & Productivity - Best Practices
 
The six step guide to practical project management
The six step guide to practical project managementThe six step guide to practical project management
The six step guide to practical project management
 
Beginners Guide to TikTok for Search - Rachel Pearson - We are Tilt __ Bright...
Beginners Guide to TikTok for Search - Rachel Pearson - We are Tilt __ Bright...Beginners Guide to TikTok for Search - Rachel Pearson - We are Tilt __ Bright...
Beginners Guide to TikTok for Search - Rachel Pearson - We are Tilt __ Bright...
 

Cemento patron ntis sp260 161

  • 1. NIST Special Publication 260-161 Certification of SRM 114q: Part I Chiara F. Ferraris William Guthrie Ana Ivelisse Avilés Robin Haupt Bruce S. MacDonald
  • 2.
  • 3. NIST Special Publication 260-161 Certification of SRM 114q: Part I Chiara F. Ferraris Materials and Construction Research Division Building and Fire Research Laboratory William Guthrie Ana Ivelisse Avilés Statistical Engineering Division Information Technology Laboratory Robin Haupt Materials and Construction Research Division Construction Materials Reference Laboratory Bruce S. MacDonald Measurement Services Division Technology Services National Institute of Standards and Technology Gaithersburg, MD 28099 July 2005 U.S. DEPARTMENT OF COMMERCE Carlos M. Gutierrez, Secretary TECHNOLOGY ADMINISTRATION Michelle O’Neill, Acting Under Secretary of Commerce for Technology NATIONAL INSTITUTE OF STANDARDS AND TECHNOLOGY Hratch G. Semerjian, Acting Director
  • 4. Certain commercial entities, equipment, or materials may be identified in this document in order to describe an experimental procedure or concept adequately. Such identification is not intended to imply recommendation or endorsement by the National Institute of Standards and Technology, nor is it intended to imply that the entities, materials, or equipment are necessarily the best available for the purpose. National Institute of Standards and Technology Special Publication 260-161 Natl. Inst. Stand. Technol. Spec. Publ. 260-161, 36 pages (July 2005) CODEN: NSPUE2 U.S. GOVERNMENT PRINTING OFFICE WASHINGTON: 2005 _________________________________________ For sale by the Superintendent of Documents, U.S. Government Printing Office Internet: bookstore.gpo.gov — Phone: (202) 512-1800 — Fax: (202) 512-2250 Mail: Stop SSOP, Washington, DC 20402-0001
  • 5. Abstract The standard reference material (SRM) for fineness of cement, SRM 114, is an integral part of the calibration material routinely used in the cement industry to qualify cements. Being a powder, the main physical properties of cement, prior to hydration, are its surface area and particle size distribution (PSD). Since 1934, NIST has provided SRM 114 for cement fineness and it will continue to do so as long as the industry requires it. Different lots of SRM 114 are designated by a unique letter suffix to the SRM number, e.g., 114a, 114b, …. ,114q. A certificate that gives the values obtained using ASTM C204 (Blaine), C115 (Wagner) and C430 (45 µm sieve residue) is included with each lot of the material. The supply of SRM 114p, which was released in 1994, was depleted in 2004. Therefore, a new batch of SRM 114 needed to be developed. This process included selection of the cement, packaging the cement in small vials, and determination of the values for the ASTM tests reported. In this case, the Blaine, Wagner and 45 µm sieve residue were the tests used. Later the particle size distribution (PSD) will be added. The purpose of this report is to provide a detailed description of the process used to package and certify SRM 114q. All measurements used for the certifications are provided along with descriptions of the statistical analyses. iii
  • 6. Acknowledgements The authors would like to thank all participants of the round-robin (listed below in alphabetical order by institution) for providing time and staff to perform the Blaine, Wagner, and particle size distribution (PSD)1 tests used for certification of this material. Also, we would like to thank Stephen Small and the staff of the Cement and Concrete Reference Laboratory (CCRL), who were instrumental in providing the samples to the round-robin participants and making sieve residue measurements. The authors would also like to thank some NIST key persons without whom this certification could not have being completed: Max Peltz for the PSD measurements; John Winpigler for the homogeneity measurements using loss of ignition; Mark Cronise and Curtis Fales for packaging all the materials; and Vince Hackley of the Materials Science and Engineering Laboratory for the numerous discussions during the planning stage. Round-Robin Participants (Alphabetical) American Engineering Testing, Inc., St. Paul, MN: Ken Prom Armstrong Cement, Cabot, PA: Eugene Szymborski Ash Grove Cement Co., Chanute, KS: Marc Melton Ash Grove Cement Co., Louisville, NE: Doug Jaquier Ash Grove Technical Center, Overland Park, KS: Kristen Freeman Buzzi Unicem USA Greencastle, IN: John Wachal Buzzi Unicem USA (formerly Lone Star), Greencastle, IN: W.D. Henry Robinson Buzzi Unicem USA, Inc. Independence KS Plant, Independence, KS: Jan J Benson Buzzi Unicem USA, New Orleans Slag Facility, New Orleans, LA: Ronald J. Rajki California Portland Cement Co., Mojave, CA: Rebecca Lara Cementa Research AB, Slite: Roger Lehrberg Cemento De El Salvador S.A., EL Espino Antiguo Cuscatlan: Guillermo Osorio Cementos Andino-Planta Betania, Bogota, Colombia: Maria M. Penaloza Cementos Andino-Planta San Gil, Bogota, Colombia: Joost E. Oostra Cementos del Norte,S.A.,Cortes: Jorge A. De J. Bueso Cementos Progreso, S.A. Planta San Miguel, La Pedrera Lic.: Luis Velasquez Cemex Inc. Fairborn, Xenia, OH: Rusty Strader CEMEX-Central Plans LLC, Dixon, IL: Guido Tenaglia CEREC-Cementos Progreso, S.A., La Pedrera: Emilio Beltranena Ciment Quebec Inc., St-Basile (Quebec): Serge Vallerand Concrete Technology-CECON-INTI, Buenos-Aires: Alejandra Benitez Connecticut DOT Research & Materials Testing, Rocky Hill, CT: John R. Giannini Construction Technology Laboratories, Skokie, IL: Ella Shkolnik Delaware DOT, Dover, DE: Karl Zipf ESSROC, Logansport, IN: Kevin Jensen 1 PSD data will be discussed in another report under preparation iv
  • 7. ESSROC San Juan, San Juan: Fernando Silvagnoli ESSROC Bessemer Laboratory, Bessemer, PA: Patricia Dubchak ESSROC Cement Corporation (Plant 1& Plant 3), Nazareth, PA: Bill Fink ESSROC Italcementi Group, Picton Ontario: Melissa Eaton F.L. Smidth A/S, LaboratoryCopenhagen: Bjarne Osbaeck GCC Dacotah, Rapid City, SD: Larry Paulsen Glens Falls Lehigh Cement, Glens Falls, NY: Donna Malone Hanson Permanante Cement, Cupertino, CA: John Lacy Hawaii DOT Materials Testing and Research Branch, Honolulu, HI: Jonathan Yee Hawaiian Cement-Cement Division, Kapolei, HI: Len B. Lagunoy Hellenic Cement Research Center (EKET) Attikis: Vassilis Kaloidas Hercules Cement Company, Stockertown, PA: Charles R. Ogle Holcim Group Support Ltd., Holderbank: Werner Flueckiger Holcim US Inc. Theodore Plant, Theodore, AL: Alissa Collins Kansas DOT Central Laboratory, Topeka, KS: Rodney Montney Lafarge - St. Constant, St. Constant, Quebec: Julie Arsenault Lafarge North America, Ravena, NY: Randy Bitely Lafarge North America, Calera, AL: Liz Higgins Lafarge North America Alpena Plant, Alpena, MI: William Ulrich Lafarge North America Exshaw Plant, Exshaw, Alberta: Carol Zaleski Lafarge North America Joppa Plant, Grand Chain, IL: Eric Bowman Lafarge North America Paulding Plant, Paulding, OH Tim Rawlsky Lafarge North America Sugar Creek Plant, Sugar Creek, MO: Nick Ewing Lehigh Cement Company, Leeds, AL: Michael Reylander Lehigh Cement Company, Waco, TX: J.W.Davis Lehigh Cement Company Union Bridge, Union Bridge, MD: Jeff Hook Lehigh Southwest Cement Co., Tehachapi, CA: Garry Bell Lone Star Industries- Buzzi Unicem USA, Pryor, OK: Mike Trimble Master Builders, Inc., Cleveland, OH: Brad Hulvey MD State Hwy Administration, Lutherville, MD: Vicki R. Stewart Minnesota DOT, Maplewood, MN: Rod Patrin Mississippi DOT, Jackson, MS: Richard Sheffield Mitsubishi Cement Corp., Lucerne Valley, CA: Tom Gepford Montana DOT.-Mat.Bureau ,Helena, MO: R. Scott Barnes National Cement Co., Ragland, AL:Frank Holcomb ND DOT, Bismarck, ND: Dennis Blasl Nebraska Dept. of Roads-Mat.& Res. Div.,Lincoln, NE: George Woolstrum NORCEM AS, Brevik Brevik: David Verdu Ohio DOT, Office of Materials Mgmt. Columbus, OH: Bryan Struble Penn DOT Materials & Testing Lab,Harrisburg, PA: Roy Trout RMC Pacific Materials Inc.,Davenport, CA: Chow Yip St. Lawrence Cement, Inc., Mississauga, Ontario: John Falletta St. Marys Cement, Detroit, MI: Linda Harris St. Marys Cement, St.Marys : Walter Pearce Texas Lehigh Cement Co., Buda, TX: Jim Jarl Texas Midlothian Cement Plant, Midlothian, TX: Jeff Wendel v
  • 8. The Euclid Chemical Co., Cleveland, OH: Bob Bucheral TPI Polene Standard Laboratory, Saraburi: Zaw Zaw Hlaing Texas DOT, Austin, TX: Lisa Lukefahr TXI Hunter Cement,New Braunfels, TX: Herman Borchers TXI Riverside Cement Co., Riverside, CA: Syed A. Rasheed TXI Riverside Cement Co., Oro Grande Plant , Oro Grande, CA: Bob Sylvia vi
  • 9. Table of Contents 1 Introduction................................................................................................................. 1 2 Description of methods used....................................................................................... 2 2.1 Blaine ASTM C 204 ........................................................................................... 2 2.2 Wagner ASTM C 115......................................................................................... 2 2.3 Sieve Residue ASTM C 430............................................................................... 3 3 Materials ..................................................................................................................... 4 3.1 Characteristics of the cement.............................................................................. 4 3.2 Packaging............................................................................................................ 5 3.3 Homogeneity determination................................................................................ 5 4 Experiment Design and Data Analysis ....................................................................... 7 4.1 Blaine ASTM C 204 ........................................................................................... 7 4.2 Wagner ASTM C 115......................................................................................... 8 4.3 Sieve Residue ASTM C 430............................................................................... 9 4.3.1 Cross check of the residue ........................................................................ 14 5 Summary of Certified Values ................................................................................... 15 6 Process Improvement................................................................................................ 16 6.1 Packaging.......................................................................................................... 16 6.2 Testing............................................................................................................... 16 7 Acknowledgments..................................................................................................... 16 8 References................................................................................................................. 17 9 Appendices................................................................................................................ 18 10 Certificate of SRM 114q....................................................................................... 23 vii
  • 10. List of Tables Table 1: Chemical composition .......................................................................................... 4 Table 2: Cement compounds according to ASTM C150.................................................... 5 Table 3: Results from the LOI tests.................................................................................... 6 Table 4: ANOVA Output from the Fit of a Nested, Random-Effects Model with Factors Box, Lab, and Vial to the Blaine Data........................................................................ 7 Table 5: Summary of the Specific Surface Area Results for SRM 114q using the Blaine Procedure .................................................................................................................... 8 Table 6: ANOVA Output from the Fit of a Nested, Random-Effects Model with Factors Box, Lab, and Vial to the Wagner Data...................................................................... 9 Table 7: Summary of the Specific Surface Area Results for SRM 114q: Wagner Procedure .................................................................................................................... 9 Table 8: ANOVA Output from the Fit of a Nested, Random-Effects Model with Factors Box and Vial to the Sieve Residue Data for the 38 µm Sieve.................................. 11 Table 9: ANOVA Output from the Fit of a Nested, Random-Effects Model with Factors Box and Vial to the Sieve Residue Data for the 47 µm Sieve.................................. 11 Table 10: ANOVA Output from the Fit of a Nested, Random-Effects Model with Factors Box and Vial to the Sieve Residue Data for the 56 µm Sieve.................................. 12 Table 11: Residue Verification Using SRM’s 114p and 114q ......................................... 15 List of Figures Figure 1: Plot of sieve residue data showing two outliers (square plotting symbols) from a vial that had been noted as containing cement of a different color than the other vials........................................................................................................................... 10 Figure 2: Plot of sieve residue data for the 47 µm sieve (with the outlier omitted) that shows evidence of day-to-day variation in the measurement process...................... 10 Figure 3: A Brooks-Gelman-Rubin plot [12] showing the ratio (upper trace) of the variation between and within (lower pair of traces) four parallel Markov chains that were simulated for this model. The fact that the ratio approaches 1 and the variation within and between chains levels off by 50 000th iteration indicates convergence. 13 Figure 4: The posterior probability distribution of the sieve residue for a 45 µm sieve. 14 viii
  • 11. 1 Introduction A standard reference material (SRM) is a material that has been well characterized with regard to its chemical composition, physical properties, or both. National Institute of Standards and Technology (NIST) provides over 1300 different SRMs to industry and academia. These materials are used in quality assurance programs, for calibration, and to verify the accuracy of experimental procedures. Every NIST SRM is provided with a certificate of analysis that gives the official characterization of the material’s properties. In addition, supplementary documentation, such as this report, that describes the development, analysis and use of SRMs is also often published by NIST to provide the context necessary for effective use of these materials. There are several SRMs related to cement (http://ts.nist.gov/ts/htdocs/230/232/232.htm). SRM 114 is related to the fineness of cement, as measured by various indirect methods giving its surface area and by passing the material through a fine sieve. This SRM is an integral part of the calibration material routinely used in the cement industry to qualify a cement. Being a powder, the main physical properties of cement are its surface area and particle size distribution (PSD). Since 1934, NIST has provided SRM 114 for cement fineness and it will continue to do so as long as the industry requires it. Different lots of SRM 114 are designated by a unique letter suffix to the SRM number. A certificate that gives the values obtained using ASTM C 204 (Blaine) [1], C 115 (Wagner) [2] and C 430 (45-µm residue) [3] is included with each lot of the material. In 1934, only the Wagner test and the 45 µm residue were listed. In 1944, the Blaine measurement was added to the certificate of the SRM 114. In 2003, the PSD measured by laser diffraction was added as an information value, i.e., not certified. The PSD was obtained under the sponsorship of ASTM Task Group C01.25.01 [4, 5, 6]. The supply of SRM 114p, which was released in 1994, was depleted in 2004. Therefore, a new batch of SRM 114 needed to be developed. The development process included the selection of a cement, packaging of the cement in small vials, and determination of the values for the ASTM tests reported. In this case, the Blaine, Wagner and 45 µm sieve residue were the tests used. Later the particle size distribution (PSD) will be added. The values given in this report were obtained through a round-robin inter-laboratory study by volunteer participants from companies participating in the CCRL certification program. The particle size distribution by laser diffraction was also collected in the same round-robin study but will be discussed in a separate report. The purpose of this report is to provide the description of the development of SRM 114q. It includes a detailed description of the process used to package and certify the cement. Also a brief description of the ASTM tests in the certificate is given. All measurements used for the certifications are provided along with the statistical analysis. 1
  • 12. 2 Description of methods used 2.1 Blaine ASTM C 204 The Blaine measurement described in ASTM C 204 was adopted by ASTM in 1946. R.L. Blaine published the test in 1943 [7]. The principle of operation is that the permeability of a bed of fine particles is proportional to the fineness of the particles. Therefore, the test is a measurement of the flow rate of air through a bed of cement particles. From the beginning, it was stated that this is a relative test as it depends on the shape of the particles, and the compaction level or porosity of the bed. For this reason, ASTM C 204 section 4.1 states that the calibration of the instrument needs to be done by using a reference material, such as SRM 114 [8]. In brief, the test is carried out by packing the cement to be measured in a cell of known volume and placing it on top of a U-tube manometer that contains a non-hygroscopic liquid of low viscosity and density, e.g., dibutyl phthalate or a light grade of mineral oil. The cell is placed on the U-tube in such a way that a tight seal is created and a vacuum is created under the cement cell so that the liquid in the manometer is higher toward the cell. Then, the air is allowed to flow back only through the cement sample. The time for the liquid in the manometer to descend a set distance is measured. This time is used to calculate the fineness quantified by the surface area S of the cement defined using the following formula: s s T TS S = (1) where Ss is the surface area of the reference material, i.e., SRM 114 Ts is the time of flow using the reference material, i.e., SRM 114 T is the time of flow of the material under test S is the surface area of the material under test Therefore, the surface area of the material tested can be calculated from the reference material. The results requested from the participants in the round-robin study to determine the value of SRM 114q were calculated using SRM 114p as the reference material. All participants were requested to measure the SRM 114p material immediately before measuring the SRM 114q material and to report both results. 2.2 Wagner ASTM C 115 The Wagner test method described in ASTM C115 was adopted by ASTM in 1934 after a paper published by L.A. Wagner in 1933 [9]. This test is also referred as the turbidimeter fineness test because it measures the turbidity of a cement suspension in kerosene. 2
  • 13. A source of light shines through the cement suspension and is detected by a photoelectric cell. The intensity of the current generated by the cell is recorded. The calibration is done by calculation of a calibration factor, K, which depends on the cell used. To determine this factor a reference material, such as SRM 114, must be used. Using a reference with known surface area, this test can be used to obtain the surface area of materials similar to the reference, (i.e. Portland cements), by comparing the two relative levels of turbidity. This method could also determine the particle size distribution, but is limited to particles larger than 7.5 µm. Due to this bound on particle size and various other sources of error, it is rarely used for PSD determinations. The results requested from the participants in the round-robin study for SRM 114q used SRM 114p as the calibrant. 2.3 Sieve Residue ASTM C 430 The principle of this test is to measure the residue or retained amount of cement on a calibrated sieve. The sieve was selected as having a 45 µm opening (No. 3252 ). Since a direct certification of sieve openings is impractical and expensive for production-scale work, sieves are calibrated by using a reference material, such as SRM 114. A sieve correction factor is calculated by measuring SRM 114 on the selected sieve and correcting the result with the certified value of the SRM 114. To avoid the need to propagate the SRM 114p uncertainty in the certification of the sieve residue for the SRM 114q material, however, three sieves with nominal openings of 38 µm, 47 µm, and 56 µm were directly calibrated for use in reference material certification. Interpolation was then used to obtain the value at 45 µm. Although direct sieve calibration was also used for previous generations of this material, The procedure used for the 114q material was different in several respects from the certification of the two preceding lots of SRM 114: • For SRM 114n sieves with openings of 42 µm to 43.9 µm were used. The average results were plotted against the average sieve opening. The certified value was calculated by extrapolation to 45 µm. • For SRM 114p sieves with openings of 42 µm to 46 µm were used and all data points (rather than the averages) were plotted against the minimum sieve opening. The certified value was calculated by interpolation to 45 µm. 2 Sieve number follow the USA definition given in ASTM E11 3
  • 14. 3 Materials 3.1 Characteristics of the cement Based on the properties of past lots of SRM 114, CCRL and NIST identified a plant with a suitable cement for SRM 114q from Lehigh Cement Company3 , Union Bridge, Maryland, who donated 1300 kg of the cement for this SRM. The material selected was Type I according to the ASTM C 150 Standard Classification, and had a mass fraction of less than 8 % tricalcium aluminate (C3A) as defined by ASTM C 150. This requirement was the same as for SRM 114p. Material was collected for shipment to NIST directly from the finish mill process stream into bags. The approximate chemical composition has been determined by ASTM Standard Test Method C 114-02 to provide additional information on this cement. The analyses of this cement (CCRL Portland Cement Proficiency Sample No. 150) were performed by 70 to 170 laboratories. The composition, which is not certified but is provided for information only, is shown on Table 1. Calculation of cement compounds from this chemistry, according to ASTM C 150-02, are shown in Table 2, again for information only. The density of the cement was also measured using a modified ASTM C 188 method. The modification was to use isopropanol (IPA) as the medium instead of kerosene, otherwise a calibrated Le Chatelier flask was used as described in the ASTM test. Two measurements were done: 3.255 g/cm3 and 3.248 g/cm3 . This leads to an average of 3.25 g/cm3 ± 0.005 g/cm3 . Table 1: Chemical composition CaO SiO2 A12O3 Fe2O3 SO3 K2O TiO2 P2O5 Na2O MgO loss on ignition Percent by mass fraction 64 20.7 4.7 3.2 2.4 0.7 0.3 0.12 0.07 2.2 1.67 3 Commercial equipment, instruments, and materials mentioned in this report are identified to foster understanding. Such identification does not imply recommendation or endorsement by the National Institute of Standards and Technology (NIST), nor does it imply that the materials or equipment identified are necessarily the best available for the purpose. 4
  • 15. Table 2: Cement compounds according to ASTM C150 Compound Percent by mass fraction C3S (tricalcium silicate) 60 C2S (dicalcium silicate) 14 C3A (tricalcium aluminate) 7 C4AF (tetracalcium alumino-ferrite) 10 3.2 Packaging Upon its arrival at NIST, the cement was blended in a V-blender (1.7 m3 or 60 ft3 ) and then transferred to 0.2 m3 (55 gal) drums lined with 0.15 mm (6 mil) polyethylene liners to minimize hydration of the cement in storage prior to preparation and packaging. Over the next two days, the cement from each drum was sealed in foil bags, each containing about 16 kg of cement. The foil bags were stored, and subsequently packaged as described below into vials, in a climate-controlled area. Each foil bag was packaged into vials and capped and boxed. Each box contained approximately 500 sealed vials and the boxes were sequentially labeled from 1 to 118. Usually about five boxes were filled per day. The more than 60 000 glass vials produced, each containing approximately 5 g of cement, were subsequently sealed into smaller individual foil bags. The vials were randomly selected (see section 4) and shipped to the participating laboratories for measurements. After the analysis of the results was completed the vials were packaged in boxes containing 20 vials each. 3.3 Homogeneity determination After the material was packaged, it was necessary to determine whether the material in different vials was the same. A special concern was any absorption of moisture during packaging from original delivery to placement in the vials. Therefore, the first test that was performed was loss of ignition (LOI). Cement taken from random vials was submitted to the following procedure: • The content of each sampled vial was divided among 3 crucibles (about 2 g of cement per crucible) and the mass was recorded • The crucible was placed in an oven at 105 °C for 12 h, and then allowed to cool down in a dessicator containing a desiccant. • The mass was recorded, and the crucible was placed in a furnace at 950 °C for 3 h. • The sample was allowed to cool down in a dessicator and the mass was recorded. • The LOI was calculated as the water loss during the residence in the furnace per mass of the sample (after the oven drying). The LOI value is an indication of the amount of water loss during the drying procedure. A high value would be an indication of improper handling of the cement. 5
  • 16. The LOI values are shown in Table 3. The Box # identifies a randomly sampled vial from that box. The LOI averages are very small (less than 0.15 %). Therefore, we conclude that there was no significant intake of moisture during packaging. Nevertheless, further checks were performed during the analysis of the round-robin data by determining whether a box-to-box or vial-to-vial variation was detected (see Section 4). Table 3: Results from the LOI tests Box # LOI [%] Average [%] St. Dev [%] 0.224 0.045 9 0.050 0.11 0.10 0.097 0.224 27 0.137 0.15 0.07 0.100 0.243 35 0.048 0.13 0.10 0.047 0.179 47 0.000 0.08 0.09 0.000 0.000 53 0.046 0.02 0.03 0.049 0.000 56 0.290 0.11 0.16 0.048 0.135 72 0.141 0.11 0.05 0.139 0.189 76 0.049 0.13 0.07 0.091 0.000 98 0.000 0.03 0.05 0.089 0.046 118 0.100 0.08 0.03 6
  • 17. 4 Experiment Design and Data Analysis 4.1 Blaine ASTM C 204 The data for the Blaine test, ASTM C 204, were collected using a nested experiment design with three factors, laboratory, box, and vial. In this design, two randomly selected laboratories who use the Blaine test were each supplied two randomly drawn vials of cement from a randomly assigned box of vials. The laboratory was then asked to measure duplicate samples from each vial. Use of this design allows assessment of lab-to-lab variability, box-to-box heterogeneity of the cement, and vial-to-vial heterogeneity of the cement. For the analysis of the Blaine data, the first step was to screen the data for non-statistical problems. Based on this screening, results from three labs, 209, 247, and 932, were eliminated from the data set. In each case, the data from these laboratories were omitted from the analysis because Blaine measurements were made on one vial from the box designated for the Blaine measurements and one vial from the box designated for the Wagner measurements. Due to the nature of the experiment design, including these results would have made it more difficult to distinguish between the different potential sources of variation. Next, a nested, random-effects, analysis of variance (ANOVA) model [10] was fit to the remaining data to check for box-to-box, lab-to-lab, and vial-to-vial variability. Residual plots to verify that the model fit the data showed that two labs each had two extreme outlying measurements. Since there were a large number of labs (66) for this analysis and only two had unusual data, the data from these two labs (123 and 886) was also omitted from the analysis. After refitting the model, residual plots indicate that the model fits the data well. The output from the analysis of variance is shown in Table 4. The low p values (<0.05) corresponding to the F tests for the significance of lab-to-lab and vial-to-vial variability provide strong evidence that there is significant lab-to-lab variation and vial- to-vial heterogeneity. The high p value for the F test for box-to-box variability (0.365) indicates that there is not strong evidence of significant box-to-box heterogeneity in this data. Table 4: ANOVA Output from the Fit of a Nested, Random-Effects Model with Factors Box, Lab, and Vial to the Blaine Data Source Degrees of Freedom Sums of Squares Mean Squares F Statistic p value Box-to-Box 37 18703.91 505.511 1.143 0.365 Lab-to-Lab (in Box) 26 11494.21 442.085 29.328 0.000 Vial-to-Vial (in Box/Lab) 64 964.72 15.074 2.960 0.000 Residuals 128 651.83 5.092 7
  • 18. Because there is significant vial-to-vial heterogeneity, a prediction interval should be used for certification. Based on the ANOVA results above, a summary of the material's properties as measured with the Blaine procedure is given in Table 5. Table 5: Summary of the Specific Surface Area Results for SRM 114q using the Blaine Procedure Mean Blaine Result: 381.81 m2 /kg Standard Uncertainty of Mean: 1.31 m2 /kg Effective Degrees of Freedom: 26.00 Standard Uncertainty of Heterogeneity: 2.23 m2 /kg Effective Degrees of Freedom: 26.55 Standard Uncertainty of 114p 2.93 m2 /kg Effective Degrees of Freedom: 60.00 Combined Standard Uncertainty: 3.91 m2 /kg Effective Degrees of Freedom: 102.66 Coverage Factor (95 % coverage): 1.98 Expanded Uncertainty: 7.76 m2 /kg 4.2 Wagner ASTM C 115 The experiment design and analysis used for the Wagner [2] data are analogous to the design and analysis used for the Blaine data. As the first step in the analysis, the Wagner data were also screened for non-statistical problems. Based on this screening, data from one lab, 247, were eliminated from the data set because Wagner measurements were made on one vial from the box designated for the Wagner measurements and one vial from the box designated for the Blaine measurements. Next we fit a nested, random effects, analysis of variance model to the remaining data to check for box-to-box, lab-to-lab, and vial-to-vial variability. Residual plots indicate that the model fits the data well, although there is only one degree of freedom for estimating the lab-to-lab variability. The analysis of variance results are shown in Table 6. The high p values for the tests for significant box-to-box and vial-to-vial variability do not provide strong evidence that the material is heterogeneous as measured by the Wagner method. Even with one degree of freedom, however, significant lab-to-lab variation is evident as indicated by the low p value for the F test for the significance of lab-to-lab variability. 8
  • 19. Table 6: ANOVA Output from the Fit of a Nested, Random-Effects Model with Factors Box, Lab, and Vial to the Wagner Data Source Degrees of Freedom Sums of Squares Mean Squares F Statistic p value Box-to-Box 4 250579.600 62644.900 0.335 0.841 Lab-to-Lab (in Box) 1 186966.100 186966.100 295.696 0.000 Vial-to-Vial (in Box/Lab) 6 3793.800 632.300 0.907 0.522 Residuals 12 8367.500 697.300 Since there is no evidence of vial-to-vial or box-to-box variability, it was decided to base the certified value and uncertainty for the Wagner method on the mean and standard deviation of the laboratory means. Based on this decision, a summary of the certification results is given in Table 7. The final uncertainty is large because so few labs are using the Wagner method and could provide results using this method in the inter-laboratory study. Table 7: Summary of the Specific Surface Area Results for SRM 114q: Wagner Procedure Mean Wagner Result: 218.33 m2 /kg Standard Uncertainty of Mean: 6.04 m2 /kg Effective Degrees of Freedom: 5.00 Standard Uncertainty of 114p: 2.35 m2 /kg Effective Degrees of Freedom: 60.00 Combined Standard Uncertainty: 6.48 m2 /kg Effective Degrees of Freedom: 6.62 Coverage Factor (95 % coverage): 2.44 Expanded Uncertainty: 15.86 m2 /kg 4.3 Sieve Residue ASTM C 430 A nested design with three factors, day, box and vial was used to collect the sieve residue data. The same design values were used to make measurements on each of the three sieves with one measurement per sieve made from each vial tested. This design allows for the estimation of day-to-day, box-to-box, and vial-to-vial variation. In addition, since the three sieves are each of different sizes spanning the sieve value of interest, 45 µm, the data from this experiment can also be used to fit a model relating sieve residue to the sieve opening size. For the analysis of the sieve residue data, the data were first plotted to graphically identify potential factor effects and to look for any unusual observations. The plot in Figure 1 identifies two outliers, from measurements on a vial that had been noted to contain a different color of cement than the others. Since these points were obtained from a suspect sample and were very different from all of the other data, they were eliminated from the analysis. Measurements of other samples from this vial, which did not appear to 9
  • 20. have unusual values, were still used, however. After removal of the outliers, some evidence of day-to-day variation between the samples is also evident in Figure 2. Sieve Opening Size, mm SieveResidue,% 40 45 50 55 0.51.01.52.0 Figure 1: Plot of sieve residue data showing two outliers (square plotting symbols) from a vial that had been noted as containing cement of a different color than the other vials. Day SieveResidue,% 1 2 3 4 5 0.500.550.600.650.700.75 Figure 2: Plot of sieve residue data for the 47 µm sieve (with the outlier omitted) that shows evidence of day-to-day variation in the measurement process. 10
  • 21. Next, a nested, random effects analysis of variance model was fit to the data from each sieve to check for day-to-day, box-to-box, and vial-to-vial variability. To maintain the balance of the design for the two sieves for which 1 of the 40 measurements was omitted, the means of the remaining data from the same box as the omitted vial were substituted for the missing data points. Residual plots from each fit verify that the models fit the data from each sieve reasonably well. The ANOVA results, showing the output from the fit of the model to the data from each sieve, are given in Table 8 to Table 10. The relatively high p values in Table 8 (p > 0.05) indicate that there is not strong evidence for day-to- day, box-to-box, or vial-to-vial in these data collected using the 38 µm sieve. The low p value for the F test for significant day-to-day variation (0.025) does indicate that there is significant day-to-day variation in the data collected using the 47 µm sieve. There is no evidence of significant variability from the other two factors, however. Finally, the high p values for day-to-day and box-to-box variability for the 56 µm sieve indicate that those factors are not significant, but the low p value for the F test for vial-to-vial variability indicates that there is significant vial-to-vial variation in the measurements made with the 56 µm sieve Table 8: ANOVA Output from the Fit of a Nested, Random-Effects Model with Factors Box and Vial to the Sieve Residue Data for the 38 µm Sieve Source Degrees of Freedom Sums of Squares Mean Squares F Statistic p value Day-to-Day 4 0.124 0.031 1.126 0.439 Box-to-Box (in Day) 5 0.138 0.028 2.085 0.095 Vial-to-Vial (in Day/Box) 10 0.178 0.018 1.614 0.174 Residuals 20 0.220 0.011 Table 9: ANOVA Output from the Fit of a Nested, Random-Effects Model with Factors Box and Vial to the Sieve Residue Data for the 47 µm Sieve Source Degrees of Freedom Sums of Squares Mean Squares F Statistic p value Day-to-Day 4 0.047 0.012 7.406 0.025 Box-to-Box (in Day) 5 0.008 0.002 0.722 0.612 Vial-to-Vial (in Day/Box) 10 0.017 0.002 0.679 0.731 Residuals 20 0.049 0.002 11
  • 22. Table 10: ANOVA Output from the Fit of a Nested, Random-Effects Model with Factors Box and Vial to the Sieve Residue Data for the 56 µm Sieve Source Degrees of Freedom Sums of Squares Mean Squares F Statistic p value Day-to-Day 4 0.010 0.003 0.965 0.500 Box-to-Box (in Day) 5 0.013 0.003 1.066 0.399 Vial-to-Vial (in Day/Box) 10 0.4690 0.005 3.261 0.012 Residuals 20 0.029 0.001 For the certification analysis, a Bayesian model relating the sieve residue of the 114q material from each sieve to the measured sieve size was developed. A Bayesian model was used in order to be able to account for the uncertainty in both the sieve calibrations and the measurements of the reference material made using those sieves. Because of the apparent day-to-day and vial-to-vial variation, and to allow for the fact that those effects were not consistently visible for all sieves, the Bayesian model accounts for all four possible sources of random variation that were included in the design, day-to-day, box-to- box, vial-to-vial, and measurement uncertainty. Although it might not be necessary to treat all of the sieves in the same way, since only one exhibited significant apparent day- to-day variability and one exhibited significant apparent vial-to-vial variability, it was decided to treat them consistently in case those effects (or box-to-box effects) were simply not detected for the other two sieves. In order to specify inter-relationships among the data, the model specifies the hypothesized relationships between the unknown true values underlying the data (called parameters in statistical jargon), which are to be estimated. In this case, the model specifies a quadratic relationship between the true sieve residues and true sieve sizes. The data gives us the quantitative information needed to estimate the parameter values. Then the model is used to interpolate the result that would be obtained from a sieve with openings of exactly 45 µm. In order to use the Bayesian model, initial assessments of the values of each parameter in the model must be provided. The initial assessment for each parameter is specified as a probability distribution for the parameter’s unknown value. Because these probability distributions are specified independently of the data (i.e. before the data are observed or used), these distributions are commonly called prior distributions. For this analysis, non- informative prior distributions were used. These distributions are essentially very flat and have very large variances so that they will not provide any quantitative information about the values of the parameters as part of the model. A probability distribution for each measurement, given with respect to the parameters in the model, is also specified. This distribution is called the likelihood of the data. For this analysis, based on typical assumptions for the statistical analysis of metrological data, normal distributions with means specified by the quadratic relationship between residue and sieve size and standard deviations based on sieve size were used for the likelihood. Then, based on the hypothesized relationships between the parameters, the likelihood, and the observed data, the prior distributions for each parameter are updated using Bayes’ 12
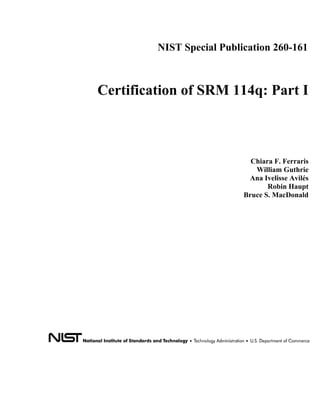
  • 23. Theorem to obtain new distributions for each parameter given the information in the data. Finally, these new distributions, called posterior distributions, are used to obtain uncertainty intervals about each quantity of interest. The Bayesian model was fit using Markov Chain Monte Carlo simulation [11]. Figure 3 shows a plot comparing the within and between chain variation [12] that indicates that the Markov Chains had converged by the 50 000th iteration of the simulation. Then 10 000 additional iterations were run for each of 4 parallel Markov chains to estimate the parameter values. Based on these results, the posterior probability distribution describing the sieve residue for a 45 µm sieve is shown in Figure 4. A 95 % probability interval for the value of the sieve residue obtained from this posterior distribution is 0.79 % ± 0.19 %. r45p chains 1:4 0 20000 40000 60000 Iteration 0.9 1.0 1.1 Brooks-Gelman-RubinStatistics Figure 3: A Brooks-Gelman-Rubin plot [12] showing the ratio (upper trace) of the variation between and within (lower pair of traces) four parallel Markov chains that were simulated for this model. The fact that the ratio approaches 1 and the variation within and between chains levels off by 50 000th iteration indicates convergence. 13
  • 24. r45p chains 1:4 sample: 40000 -0.5 0.0 0.5 1.0 1.5 0.0 2.0 4.0 6.0 Sieve Residue, % ProbabilityDensity Figure 4: The posterior probability distribution of the sieve residue for a 45 µm sieve. 4.3.1 Cross check of the residue Because the 114q material has such a different residue than previous generations of this material, it is important to verify that the correct results will be obtained when the certified value is used to calibrate a sieve as described in ASTM C430. The standard implies that the SRM 114q is sieved using a sieve with an unknown opening (although it should nominally be about 45 µm). The result is used with the certified value to calibrate the sieve and correct results of unknown cements. To verify the performance of the 114q material, we did a double verification as shown in Table 11. The verification consisted of calculating the correction factor using one of the SRMs and testing the other SRM using this correction factor. For example in column 1 (Table 11) SRM 114p is used to calculate the correction factor that is then used to correct a measurement of SRM 114q. If everything it working as expected, the residue found for SRM 114q should match the value found in the certificate, which it does. Similarly, the results obtained for SRM 114p, when 114q is used to calibrate the sieve, do not disagree with the value from the 114p certificate, although the uncertainty in the corrected result for 114p is rather large. 14
  • 25. Table 11: Residue Verification Using SRM’s 114p and 114q Sieve Correction Factor Calculation SRM 114p SRM 114q Certified residue on 45 µm sieve [%] 8.24 ± 0.37 0.79 ± 0.19 Residue for 1 g sample [g] 0.0824 ± 0.0037 0.0079 ± 0.0019 Residue on sieve being calibrated [g] 0.0683 ± 0.0068 0.0060 ± 0.0006 Difference [g] 0.0141 ± 0.0077 0.0019 ± 0.0020 Correction factor [%] 20.6442 ± 13.22 31.6667 ± 34.2949 Cement Tested SRM 114q SRM 114p Residue from sample being tested [g] 0.0060 ± 0.0006 0.0683 ± 0.0068 Corrected residue [%] 0.7239 ± 0.1074 8.9928 ± 2.5090 Certified residue on 45 µm sieve [%] 0.79 ± 0.19 8.24 ± 0.37 Note: Uncertainties shown for each value are expanded uncertainties at the 95 % confidence level. A coverage factor of k = 2 was used in all cases. 5 Summary of Certified Values The certified values for the SRM 114q certificate are: Measurementand ASTM Method Result Specific Surface Area C 204-96a (Blaine) 3818 cm2 /g ± 78 cm2 /g (381.8 m2 /kg ± 7.8 m2 /kg) Specific Surface Area C 115-96a (Wagner) 2183 cm2 /g ± 160 cm2 /g (218 m2 /kg ± 16 m2 /kg) Sieve Residue C 430-96 (45 µm sieve) 0.79 % ± 0.19 % 15
  • 26. 6 Process Improvement 6.1 Packaging As stated above, the cement received from the manufacturer was sealed in foil bags after being blended. It was the original intention that each foil bag would be open, divided in the vials and any left over would be discarded. This would ensure that the cements left in the foil bags overnight (or longer due to scheduling) would not hydrate in between vial filling. If hydration occurs the cement properties will change. As a further quality assurance, the temperature, relative humidity should be recorded. If a log is kept of the temperature, relative humidity, vials filled, it would results in a better correlation between homogeneity problems and specific vials. During the filling of this batch of 600 000 vials, the procedure outlined above was followed but no log was kept of the temperature and relative humidity. Therefore, when it was discovered that vials, checked for homogeneity using other methods such as PSD, were found not satisfactory [13], it was not possible to rule out that the packaging conditions were one of the effects. This situation did not affect the data presented here probably because none of the tests used are sensitive to complete dispersion, as it is the case for PSD measurements. 6.2 Testing As shown in Table 3, one vial per box was used for the LOI testing. With this design, box-to-box and vial-to-vial differences in the LOI results cannot be differentiated. One minor improvement to the design for LOI testing in the future would be to sample two vials per box so that potential vial-to-vial variability could be separated from box-to-box variability in the LOI results. If necessary, half as many boxes could be sampled in order to keep the total number of measurements the same. Reducing the number of boxes sampled would reduce our ability to identify box-to-box differences, since some of the degrees of freedom would be used to check for vial-to-vial variability, but the added ability to separate vial-to-vial variability from box-to-box variability would give us the potential for additional insight into the process that would offset that loss. Because of the small sieve residue for this cement, some digitization was evident in the sieve residue data. For future sieve residue assessments on cements with residues in this low range, use of a balance with a finer resolution would be advantageous. 7 Acknowledgments The authors would like to thank Max Peltz for helping with the sample preparations, and Romayne Hines for helping in distribution of the samples for the round-robin. Special thanks are extended also to Vince Hackley for his numerous suggestions and fruitful 16
  • 27. discussions, and Edward Garboczi (NIST), Kenneth Snyder (NIST) and Charles Hagwood (NIST) for their valuable comments. 8 References 1. “Standard Test Method for Fineness of Hydraulic Cement by Air Permeability Apparatus”, ASTM C204-00 Volume: 04.01 2. “Standard Test Method for Fineness of Portland Cement by the Turbidimeter”, ASTM C115-96a (2003) Volume: 04.01 3. “Standard Test Method for Fineness of Hydraulic Cement by the 45-µm (No. 325) Sieve”, ASTM C430-96 (2003) Volume: 04.01 4. Ferraris, C.F, Hackley V.A., Aviles A.I., Buchanan C.E., "Analysis of the ASTM Round-Robin Test on Particle Size Distribution of Portland Cement: Phase I" NISTIR 6883, May 2002 (http://ciks.cbt.nist.gov/~garbocz/nist6883/nistir6883.htm) 5. Ferraris, C.F, Hackley V.A., Aviles A.I., Buchanan C.E., "Analysis of the ASTM Round-Robin Test on Particle Size Distribution of Portland Cement: Phase II" NISTIR 6931, December 2002 6. Ferraris C.F., Hackley V.A., Avilés A.I., “Measurement of Particle Size Distribution in Portland Cement Powder: Analysis of ASTM Round-Robin Studies”, Cement, Concrete and Aggregate Journal, Dec. 2004, vol. 26 #2, pp 71-81 7. Blaine R.L., “A Simplified Air Permeability Fineness Apparatus” , ASTM Bulletin, No.123, 1943, pp 51-55 8. Bean L. B., Dise J.R., “Causes of Variation in Chemical Analyses and Physical Tests of Portland Cement”, NBS, Building Series #17, 1969 9. Wagner, L. A., “A Rapid Method for the Determination of the Specific Surface of Portland Cement,” Proceedings, ASTM, ASTEA, Vol 33, Part II, 1933, p. 553 10. Montgomery, Douglas C., Design and Analysis of Experiments, 2nd Edition, John Wiley and Sons, New York, 1984 11. Gelman, A., Carlin, J.B., Stern, H.S., Rubin, D.B., Bayesian Data Analysis, Chapman and Hall, London, 1995 12. Brooks S.P. and Gelman A. “Alternative methods for monitoring convergence of iterative simulations,” Journal of Computational and Graphical Statistics, 7, 1998, pp 434-455 13. Ferraris, C.,F. Avilés A.I., Guthrie W., Haupt, R., MacDonald, B. S., Peltz, M. “Certification of SRM 114q: Part II”, to be published in 2005 17
  • 28. 9 Appendices Appendix A: Data received from the round robin for Blaine Raw data as received: Grey [m2 / kg]; white [s] Calculated Blaine (SRM 114p & data provided) SRM 114p Vial #1 Vial #2 Vial #1 Vial #2 CCRL Lab Code Meas#1 Meas.#2 Box # Meas#1 Meas.#2 Box # Meas#1 Meas.#2 Box # Meas#1 Meas.#2 Box # Meas#1 Meas.#2 6 85.1 19 89.9 89.46 19 89.01 88.35 19 3878 3869 19 3859 3845 10 104 45 90.7 89.8 45 88.56 89.3 45 3525 3507 45 3483 3497 11 74 89 80 78 89 79 79 89 3924 3875 89 3899 3899 18 85 87.5 30 71 66.5 30 64.5 67.5 30 3424 3314 30 3264 3339 19 118 70 129.2 129.4 70 129.6 128.8 70 3949 3952 70 3955 3943 20 85.3 114 91.6 90.01 114 91.29 92.6 114 3912 3877 114 3905 3933 27 152 149 107 157 157 107 158 157 107 3855 3855 107 3867 3855 28 3800 81 3910 3910 81 3880 3900 81 3910 3910 81 3880 3900 40 109.6 108.7 109 121.1 119.9 109 115.5 117.9 109 3975 3956 109 3882 3922 41 75.7 9 76.9 76.7 9 75.9 76 9 3804 3799 9 3779 3781 43 91.4 55 95.2 95.1 55 95.7 95.8 55 3852 3850 55 3862 3864 54 3772 3770 89 3814 3748 89 3878 3882 89 3814 3748 89 3878 3882 56 3820 3840 50 3810 3770 50 3810 3790 50 3810 3770 50 3810 3790 60 114 114 80 121 120 80 119 120 80 3888 3872 80 3856 3872 69 77.4 76.8 40 78.8 79.1 40 78.6 78.2 40 3815 3823 40 3811 3801 73 80 58 83 82 58 80 81 58 3844 3821 58 3774 3798 75 3810 3800 77 3695 3715 77 3697 3708 77 3695 3715 77 3697 3708 84 115.4 120 116.555 115.7 120 122.1 121.4 120 3793 3779 120 3881 3870 92 68.8 66.56 118 71.35 68.0 118 70.17 69.5 118 3876 3784 118 3844 3827 95 77.5 77 80 85.5 85 80 85 85.5 80 3970 3959 80 3959 3970 105 85.4 85.9 11 86.7 86.9 11 85.7 86 11 3797 3801 11 3775 3782 121 81.4 47 83.20 84.6 47 84.3 84.1 47 3816 3847 47 3840 3836 123 84 88 105 80 88 83 83.5 88 4219 3683 88 3751 3763 18
  • 29. Raw data as received: Grey [m2 / kg]; white [s] Calculated Blaine (SRM 114p & data provided) SRM 114p Vial #1 Vial #2 Vial #1 Vial #2 CCRL Lab Code Meas#1 Meas.#2 Box # Meas#1 Meas.#2 Box # Meas#1 Meas.#2 Box # Meas#1 Meas.#2 Box # Meas#1 Meas.#2 124 70 70.5 13 75 75.5 13 75.5 75.5 13 3900 3912 13 3912 3912 125 3752 11 3861 3861 11 3796 3752 11 3861 3861 11 3796 3752 148 83.9 82.8 75 81.0 79.3 75 82.8 82.2 75 3720 3680 75 3761 3748 151 89.1 86.6 116 87.3 86.0 116 90.8 88.7 116 3762 3734 116 3837 3793 157 93 58 95 94 58 94 93 58 3814 3794 58 3794 3774 162 3745 3756 14 3796 3806 14 3777 3788 14 3796 3806 14 3777 3788 166 81 81 86 90 90 86 90 90 86 3978 3978 86 3978 3978 167 3750 3730 98 3800 3800 98 3860 3850 98 3800 3800 98 3860 3850 175 106 110 30 110 111 30 109 111 30 3809 3827 30 3792 3827 178 77.5 77.4 3 67.4 69.5 3 73.6 70.3 3 3521 3575 3 3679 3596 205 90 89.8 50 91.9 90.9 50 90.9 91.5 50 3816 3795 50 3795 3807 209 85.3 84 66 90.7 89.9 113 88.4 91.0 66 3907 3889 113 3857 3913 222 87.7 28 87.8 86.5 28 87.6 87.3 28 3776 3748 28 3772 3765 225 105 106 40 110 111 40 109 110 40 3854 3871 40 3836 3854 245 80 19 73 72.5 19 73 74 19 3605 3593 19 3605 3630 246 71.5 21 81 80.3 21 79.8 79.1 21 4017 4000 21 3987 3970 247 88 43 93 109 92 43 3880 0 109 3859 254 3765 3788 97 3854 3846 97 3807 3815 97 3854 3846 97 3807 3815 255 3730 77 3800 3720 77 3800 3839 77 3800 3720 77 3800 3839 284 97.0 97.5 86 104.0 104.0 86 104.0 103.5 86 3903 3903 86 3903 3893 303 92.9 92.2 32 94.5 93.9 32 95.5 92.4 32 3814 3801 32 3834 3771 309 88 88 116 90 90 116 90 90 116 3817 3817 116 3817 3817 354 77.7 76.5 31 80.95 80.65 31 79.82 78.75 31 3867 3860 31 3840 3814 360 100 100 3 100 98 3 99 97 3 3774 3736 3 3755 3717 413 Too variable to report 441 3760 3760 114 3740 3650 114 3710 3690 114 3740 3650 114 3710 3690 493 83 84 32 87 90 32 90 88 32 3852 3918 32 3918 3874 494 97 98 66 100 100 66 98 98 66 3822 3822 66 3784 3784 19
  • 30. Raw data as received: Grey [m2 / kg]; white [s] Calculated Blaine (SRM 114p & data provided) SRM 114p Vial #1 Vial #2 Vial #1 Vial #2 CCRL Lab Code Meas#1 Meas.#2 Box # Meas#1 Meas.#2 Box # Meas#1 Meas.#2 Box # Meas#1 Meas.#2 Box # Meas#1 Meas.#2 551 3751 3769 112 3892 3887 112 3926 3930 112 3892 3887 112 3926 3930 557 100 100 18 101 100 18 100 101 18 3793 3774 18 3774 3793 605 3816 28 3879 3879 28 3859 3816 28 3879 3879 28 3859 3816 690 3774 88 3801 3801 88 3828 3828 88 3801 3801 88 3828 3828 736 99.6 97.8 71 108.2 105.3 71 107.6 106.5 71 3951 3898 71 3939 3920 886 3705 3735 119 3832 3784 119 3624 3851 119 3832 3784 119 3624 3851 932 115.4 19 121.4 122.9 75 123.2 123.8 19 3871 3895 75 3899 3909 1042 111.6 111.1 21 114.4 114.3 21 110.9 112.6 21 3824 3823 21 3766 3795 1054 83 85 14 93 93 14 90 90 14 3971 3971 14 3907 3907 1251 3765 3757 107 3891 3874 107 3883 3883 107 3891 3874 107 3883 3883 1715 72.9 72.3 13 74.8 75.1 13 75.6 75.5 13 3829 3837 13 3850 3848 1773 101.1 101.4 47 91.3 91.6 47 90.4 90.7 47 3584 3590 47 3566 3572 1819 82.59 83.00 9 86.4 87.1 9 86.1 86.5 9 3855 3870 9 3850 3858 1916 88.9 88.7 31 94.1 95.2 31 95.6 94.2 31 3884 3908 31 3916 3887 1940 3716 3753 18 3870 3901 18 3825 3922 18 3870 3901 18 3825 3922 2116 47.5 48.0 118 50.5 50.0 118 50.5 49.5 118 3881 3862 118 3881 3843 2190 85.3 86.0 111 86.3 85.8 111 87.5 86.3 111 3789 3778 111 3815 3788 2191 75.4 74.3 111 73.6 77.4 111 79.7 81.4 111 3744 3837 111 3896 3937 NA 65.2 64.8 70 66.7 67.0 70 66.5 66.5 70 3824 3832 70 3816 3818 20
  • 31. Appendix B: Data received from the round robin for Wagner 114p Box A Box BCCRL code Meas. #1 Meas. #2 Box # Meas. #1 Meas. #2 Box # Meas. #1 Meas. #2 73 2049 9 1984 1986 9 1997 2040 125 2130 9 2330 2290 9 2310 2300 205 2070 119 2380 2380 119 2380 2350 247 43 2280 2240 109 2260 2280 254 2060 2085 43 2046 2020 43 2117 2043 494 2088 2078 66 2113 2126 66 2135 2079 551 2045 2067 113 2227 2262 113 2272 2232 21
  • 32. Appendix C: Data obtained for Residue ResidueDay Box Vial Sieve 1 Sieve 2 Sieve 3 1 118 1 0.0010 g 0.0035 g 0.0015 g 1 35 1 0.0150 g 0.0060 g 0.0030 g 1 118 1 0.0160 g 0.0050 g 0.0010 g 1 35 2 0.0160 g 0.0050 g 0.0020 g 1 35 2 0.0155 g 0.0060 g 0.0010 g 1 35 1 0.0150 g 0.0055 g 0.0030 g 1 118 2 0.0170 g 0.0050 g 0.0025 g 1 118 2 0.0150 g 0.0060 g 0.0025 g 2 47 2 0.0160 g 0.0060 g 0.0025 g 2 27 1 0.0180 g 0.0065 g 0.0010 g 2 27 1 0.0180 g 0.0060 g 0.0020 g 2 47 2 0.0160 g 0.0060 g 0.0025 g 2 27 2 0.0185 g 0.0060 g 0.0020 g 2 47 1 0.0175 g 0.0060 g 0.0030 g 2 27 2 0.0160 g 0.0055 g 0.0025 g 2 47 1 0.0170 g 0.0065 g 0.0020 g 3 53 2 0.0150 g 0.0020 g 3 98 1 0.0165 g 0.0065 g 0.0025 g 3 53 2 0.0160 g 0.0065 g 0.0025 g 3 98 2 0.0170 g 0.0075 g 0.0025 g 3 98 2 0.0155 g 0.0060 g 0.0020 g 3 98 1 0.0150 g 0.0060 g 0.0025 g 3 53 1 0.0170 g 0.0070 g 0.0025 g 3 53 1 0.0150 g 0.0060 g 0.0015 g 4 76 2 0.0135 g 0.0055 g 0.0025 g 4 72 2 0.0165 g 0.0060 g 0.0025 g 4 76 1 0.0170 g 0.0065 g 0.0025 g 4 76 2 0.0150 g 0.0065 g 0.0025 g 4 76 1 0.0135 g 0.0060 g 0.0020 g 4 72 1 0.0195 g 0.0070 g 0.0025 g 4 72 1 0.0175 g 0.0065 g 0.0025 g 4 72 2 0.0145 g 0.0065 g 0.0025 g 5 56 2 0.0160 g 0.0055 g 0.0025 g 5 56 2 0.0160 g 0.0060 g 0.0020 g 5 9 1 0.0180 g 0.0065 g 0.0030 g 5 56 1 0.0170 g 0.0070 g 0.0025 g 5 9 2 0.0155 g 0.0065 g 0.0025 g 5 56 1 0.0165 g 0.0060 g 0.0025 g 5 9 1 0.0180 g 0.0065 g 0.0025 g 5 9 2 0.0165 g 0.0065 g 0.0025 g 0.0060 g Note: Box 118 vial 1 - slightly different color than that of box 118 vial 2 and both vials 1 and 2 from box 35 22
  • 33. 10 Certificate of SRM 114q Below the certificate of SRM 114q is provided for information only. As, the certificate will be updated later in 2005 to add the particle size distribution of the cement [13], the official version is the available online at: https://srmors.nist.gov/certificates/view_cert2gif.cfm?certificate=114q Or by selecting “Standard Reference Materials” from the website www.NIST.GOV and typing in 114q 23
  • 34. National Institute of Standards & Technology Certificate of Analysis Standard Reference Material 114q Portland Cement Fineness Standard This Standard Reference Material (SRM) is intended for use in calibrating fineness testing equipment according to ASTM Standard Methods. The SRM unit consists of 20 glass vials with plastic caps containing powdered cement (each vial is contained in a sealed foil bag). Each vial contains approximately 5 g of cement. Certified Values and Uncertainties: A NIST certified value is a value for which NIST has the highest confidence in its accuracy and that all known or suspected sources of bias have been investigated or accounted for by NIST. The certified values for specific surface area and sieve residue are given in Table 1. The certified values for the surface area are the mean of results from analyses performed by cooperating laboratories. The certified value for sieve residue was calculated from a quadratic fit of NIST data using three sieves having openings ranging from 38 µm to 56 µm. The expanded uncertainties of the certified values for specific surface area were calculated according to the NIST uncertainty policy described in the NIST Technical Note 1297 [1], and are at the 95 % confidence level. The uncertainties include measurement variability within and between laboratories. The surface area uncertainties also include material variability and the uncertainty of the surface area values for the superseded SRM 114p Portland Cement Fineness Standard, which was used as the calibrant for this material. The expanded uncertainty for the sieve residue was computed using a Bayesian analysis and is also at the 95 % probability level. The expanded uncertainty accounts for the variability of random measurement effects, sieve calibrations, and material inhomogeneity. Table l. Certified Values Measurand ASTM Method Certified Value and Expanded Uncertainty Specific Surface Area C 204-96a(a) (Blaine) 3818 cm2 /g ± 78 cm2 /g (381.8 m2 /kg ± 7.8 m2 /kg) Specific Surface Area C 115-96a(b) (Wagner) 2183 cm2 /g ± 160 cm2 /g (218 m2 /kg ± 16 m2 /kg) Sieve Residue (45 µm residue) C 430-96(c) 0.79 % ± 0.19 % (a) Standard Test Method for Fineness of Portland Cement by Air Permeability Apparatus [Blaine]. (b) Standard Test Method for Fineness of Portland Cement by the Turbidimeter [Wagner]. (c) Standard Test Method for Fineness of Hydraulic Cement by the 45 µm (No. 325) Sieve. Expiration of Certification: The certification of SRM 114q is valid, within the measurement uncertainties specified, until 31 December 2016, provided the SRM is handled in accordance with the instructions given in this certificate (see “Instructions for Use”). This certification is nullified if the SRM is contaminated or otherwise modified. Maintenance of Certification: NIST will monitor representative samples from this SRM lot over the period of its certification. If substantive changes occur that affect the certification before the expiration date, NIST will notify the purchaser. Registration (see attached sheet) will facilitate notification. James St. Pierre, Chief Materials and Construction Research Division Gaithersburg, MD 20899 Robert L. Watters, Jr., Chief Certificate Issue Date: 24 March 2005 Measurement Services Division 24
  • 35. See Certificate Revision History on Last Page 25
  • 36. The preparation of the material and the coordination of the technical measurements leading to certification were performed by C. Ferraris of the NIST Materials and Construction Research Division. Statistical consultation on measurement design and analysis of the certification data was performed by W.F. Guthrie and A.I. Avilés of the NIST Statistical Engineering Division. The support aspects involved in the issuance of this SRM were coordinated through the NIST Standard Reference Materials Program by B.S. MacDonald of the NIST Measurement Services Division. INSTRUCTIONS FOR USE Stability and Use: This material is considered to be extremely hygroscopic. Based on measurements in 1993 of several earlier renewals of SRM 114, the properties certified are stable as long as the foil bag remains sealed. The specific surface area of cement changes on exposure to the moisture in air. Therefore, this cement should be used immediately after opening the outer foil bag. Allow the sealed foil bag to equilibrate to testing temperature before opening. To open the pouch, cut off the end with scissors. Fluff the cement in accordance with ASTM Standard C204, Section 3.4, allow the cement to settle for 2 minutes, and then perform the measurement. Material Selection and Packaging: The desired properties were determined to be generally the same as those selected for the previous issues of SRM 114; however, in order to better represent current cements, the material selected for SRM 114q consists of a finer particle size distribution than previously issued. The Cement and Concrete Reference Laboratory (CCRL) and NIST identified a plant with suitable cement: Lehigh Cement Company (Union Bridge, Maryland)4 donated 1300 kg of appropriate cement for this SRM. The material selected was Type I according to the ASTM C 150 Standard Classification and had a mass fraction of less than 8 % tricalcium aluminate (C3A). The material was collected for shipment to NIST directly from the finish mill process stream into bags. Upon arrival at NIST, the cement was blended in a V-blender (1.68 m3 ) and then transferred to 208 L (55 gallon) drums lined with 0.015 cm (6 mil) polyethylene liners to minimize hydration of the cement in storage prior to preparation and packaging. Over the next two days, the cement from each drum was sealed in foil bags, each containing about 16 kg of cement. The foil bags were stored in a climate-controlled area. The contents of each bag were subsequently packaged into vials. The vials were then capped and packaged in boxes of about 500 vials per box. The boxes were sequentially labeled from 1 to 118. About 5 boxes were filled per day. Nearly 59 000 glass vials, each containing approximately 5 g of cement, were produced. Each vial was then individually sealed in a foil bag. Vials were selected from the lot by stratified random sampling [2] for both homogeneity and certification analyses. Selected vials were shipped to the participating laboratories for measurements. The remaining vials were packaged into SRM unit boxes of 20 vials each. Homogeneity Assessment and Certification Analyses: Homogeneity testing of the material was performed on 48 random-selected samples. Measurements of the loss of ignition (LoI) showed no reversible moisture take-up by the cement during packaging. The data received from the round-robin participants were also checked for laboratory- to-laboratory (or day-to-day in the case of sieve residue) variability, box-to-box variability, and vial-to-vial variability. No significant box-to-box or vial-to-vial variability was detected except for the Wagner or sieve residue tests, and therefore it was determined that the samples were homogeneous for the ASTM measurements. Significant vial-to-vial variability was observed using the Blaine test and the certified values reflect this source of uncertainty. Certification analyses for specific surface areas using ASTM Standard Test Methods C 115-96a and C 204-00 were performed on two samples at each of the participating laboratories. SRM 114p Portland Cement Fineness Standard was used for calibration. Raw data were submitted by each laboratory to NIST for tabulation and calculation of surface areas, which for the Blaine test, assumed a density of 3.15 g/cm3 . The density was measured twice at NIST: the results were 3.255 g/cm3 and 3.248 g/cm3 . Certification analyses according to ASTM Standard Test Method C 430-96 for the 45 µm sieve residue were performed at NIST on 40 samples from 20 vials of cement. Laboratories performing certification analyses are members of the CCRL (http://www.ccrl.us) proficiency program. The full list is provided in the report describing the details of the certification process [2]. 4 Certain commercial equipment, instruments, or materials are identified in this certificate in order to specify adequately the experimental procedure. Such identification does not imply recommendation or endorsement by the National Institute of Standards and Technology, nor does it imply that the materials or equipment identified are necessarily the best available for the purpose. 26
  • 37. Information Values: NIST information values are considered to be of interest to the SRM user, but are not certified because insufficient information is available to assess adequately the uncertainty associated with the values or only a limited number of analyses were performed. Information values for SRM 114q are given in Tables 2 and 3. Table 2 provides the approximate chemical composition determined by ASTM Standard Test Method C114-02. The analysis of this cement (CCRL Portland Cement Proficiency Sample No. 150) was performed by 70 to 170 laboratories; the number of participating laboratories depends on the value measured. Table 2. Information Values for Chemical Composition Compound Mass Fraction Compound Mass Fraction (%) (%) CaO 64.0 K2 O 0.70 SiO2 20.7 TiO2 0.30 A12 O3 4.7 P2 O5 0.12 Fe2 O3 3.2 Na2 O 0.07 SO3 2.4 MgO 2.2 Loss on Ignition 1.67 Table 3 provides the calculation of cement compounds according to ASTM C 150-02. Table 3. Information Values for Cement Compounds (Calculation from Table 2) Compound Mass Fraction (%) C3 S (tricalcium silicate) 60 C2 S (dicalcium silicate) 14 C3 A (tricalcium aluminate) 7 C4 AF(tetracalcium alumino-ferrite) 10 REFERENCES [1] Taylor, B.N.; Kuyatt, C.E.; NIST Technical Note 1297, Guidelines for Evaluating and Expressing the Uncertainty of NIST Measurement Results (1993). [2] Ferraris, C.F.; Avilés A.I.; Guthrie W.; Haupt, R.; Certification of SRM 114q; Phase I, NIST SP260- 161 (2005). Certificate Revision History: 24 March 2005 (This technical revision corrects the certified values and expanded uncertainties for the measurand); 23 March 2005 (Original certificate date). Users of this SRM should ensure that the certificate in their possession is current. This can be accomplished by contacting the SRM Program at: telephone (301) 975-6776; fax (301) 926-4751; e-mail srminfo@nist.gov; or via the Internet http://www.nist.gov/srm. 27
  • 38. 28