Small Cap Growth Product Sheet Quarter 1, 2015
•
1 like•148 views

Small Cap Growth Product Information 2015 Q1

Recommended
Recommended
More Related Content
What's hot
What's hot (20)
Viewers also liked
Similar to Small Cap Growth Product Sheet Quarter 1, 2015
Similar to Small Cap Growth Product Sheet Quarter 1, 2015 (20)
Recently uploaded
Recently uploaded (20)
Small Cap Growth Product Sheet Quarter 1, 2015
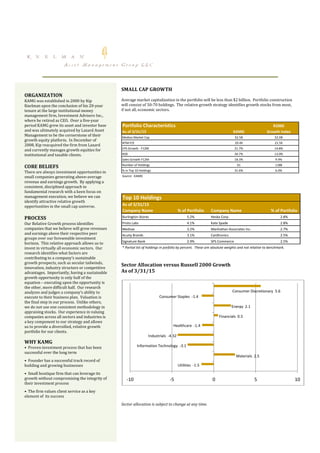
- 1. ORGANIZATION KAMG was established in 2000 by Kip Knelman upon the conclusion of his 20-year tenure at the large institutional money management firm, Investment Advisers Inc., where he retired as CEO. Over a five-year period KAMG grew its asset and investor base and was ultimately acquired by Lazard Asset Management to be the cornerstone of their growth equity platform. In December of 2008, Kip reacquired the firm from Lazard and currently manages growth equities for institutional and taxable clients. CORE BELIEFS There are always investment opportunities in small companies generating above-average revenue and earnings growth. By applying a consistent, disciplined approach to fundamental research with a keen focus on management execution, we believe we can identify attractive relative growth opportunities in the small cap universe. PROCESS Our Relative Growth process identifies companies that we believe will grow revenues and earnings above their respective peer groups over our foreseeable investment horizon. This relative approach allows us to invest in virtually all economic sectors. Our research identifies what factors are contributing to a company’s sustainable growth prospects, such as secular tailwinds, innovation, industry structure or competitive advantages. Importantly, having a sustainable growth opportunity is only half of the equation – executing upon the opportunity is the other, more difficult half. Our research analyzes and judges a company’s ability to execute to their business plan. Valuation is the final step in our process. Unlike others, we do not use one consistent methodology in appraising stocks. Our experience in valuing companies across all sectors and industries is a key component to our strategy and allows us to provide a diversified, relative growth portfolio for our clients. WHY KAMG • Proven investment process that has been successful over the long term • Founder has a successful track record of building and growing businesses • Small boutique firm that can leverage its growth without compromising the integrity of their investment process • The firm values client service as a key element of its success SMALL CAP GROWTH Average market capitalization in the portfolio will be less than $2 will consist of 50-70 holdings. The relative growth strategy identifies growth if not all, economic sectors. Portfolio Characteristics As of 3/31/15 Median Market Cap NTM P/E EPS Growth - F12M ROE Sales Growth F12M Number of Holdings % in Top 10 Holdings Source: KAMG Top 10 Holdings As of 3/31/15 Company Name % of Portfolio Company Name Burlington Stores 5.2% Heska Corp. Proto Labs 4.1% Kate Spade Mednax 3.2% Manhattan Associates Inc. Acuity Brands 3.1% Cardtronics Signature Bank 2.9% SPS Commerce * Partial list of holdings in porfolio by percent. These are absolute weights and not relative to benchmark. Sector Allocation versus Russell 2000 Growth As of 3/31/15 Sector allocation is subject to change at any time. -10 -5 0 Consumer Staples -1.4 Financials 0.5 Healthcare -1.4 Industrials -4.32 Information Technology -3.1 Utilities -1.5 portfolio will be less than $2 billion. Portfolio construction strategy identifies growth stocks from most, R2000 KAMG Growth Index $2.5B $2.0B 29.4X 21.5X 21.7% 14.8% 34.7% 13.0% 18.3% 9.9% 61 1188 31.6% 6.0% Company Name % of Portfolio Heska Corp. 2.8% Kate Spade 2.8% Manhattan Associates Inc. 2.7% Cardtronics 2.5% SPS Commerce 2.5% * Partial list of holdings in porfolio by percent. These are absolute weights and not relative to benchmark. 000 Growth 5 10 Consumer Discretionary 5.6 Energy 2.1 Financials 0.5 Materials 2.5
- 2. Performance INVESTMENT PROFESSIONAL I.P. (Kip) Knelman Senior Managing Partner, CEO 39 Years Experience DISCLOSURE The composite represents the returns all fully discretionary, fee-paying, portfolios with a small cap growth investment mandate and a minimum of $200,000 in assets under management. KAMG’s account inclusion policy is the first full month or the end of the month in which the account is fully invested. The returns of the individual portfolios within the composite are time-weighted, use trade date accounting, are based upon monthly portfolio valuations, and include the reinvestment of all earnings as the payment date. The composite returns are asset-weighted based upon beginning period market value. A complete list and description of all composites is available upon request. Additional information regarding policies for calculating and reporting returns is available upon request. The composite returns presented represent past performance and do not indicate future results, which may vary. Composite returns are shown both gross and net of fees. Small Cap Growth Composite creation date 6/30/11. Periods Inception (6/30/11) Annualized Ending 3/31/15 to date (3/31/15) Periods Ending 12/31/14 KAMG Small Cap Growth QTD YTD 5-Year 3-Year 1-Year (Gross of fees) 6.3% 6.3% 13.5% N/A 17.5% 5.5% (Net of fees) 6.0% 6.0% 12.5% N/A 16.3% 4.5% Russell 2000 Growth Index 6.6% 6.6% 14.3% N/A 20.1% 5.6%