Download to read offline
![© 2017 Creative Arts & Technologies and others. All rights reserved.#Monitoring #Performance
Who am I?
Werner Keil
• Consultant – Coach
• Creative Cosmopolitan
• Open Source Evangelist
• Software Architect
• Spec Lead – JSR363
• Individual JCP Executive Committee Member
[www.linkedin.com/in/catmedia]
Twitter @wernerkeil](https://image.slidesharecdn.com/java2days-2017perfmoncloud-171029180650/85/Performance-Monitoring-for-the-Cloud-Java2Days-2017-3-320.jpg)
![© 2017 Creative Arts & Technologies and others. All rights reserved.#Monitoring #Performance
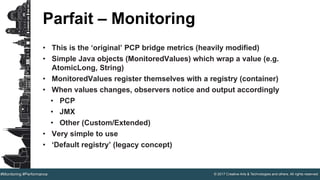
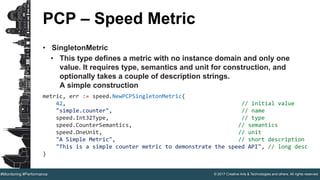
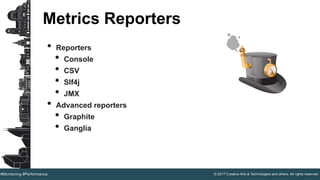
PCP Metrics
• pminfo --desc -tT --fetch disk.dev.read
disk.dev.read [per-disk read operations]
Data Type: 32-bit unsigned int InDom: 60.1
Semantics: counter Units: count
Help: Cumulative count of disk reads since
boot time
Values:
inst [0 or "sda"] value 3382299
inst [1 or "sdb"] value 178421
16](https://image.slidesharecdn.com/java2days-2017perfmoncloud-171029180650/85/Performance-Monitoring-for-the-Cloud-Java2Days-2017-16-320.jpg)
![© 2017 Creative Arts & Technologies and others. All rights reserved.#Monitoring #Performance
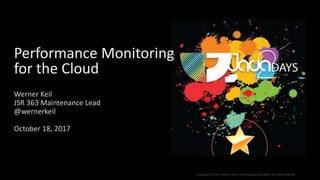
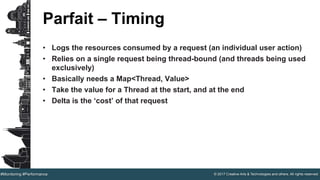
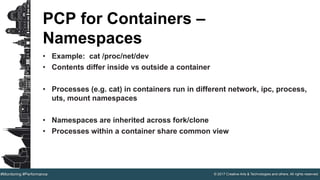
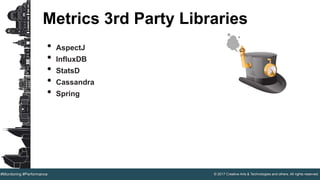
Parfait – Timing Example
[2010-09-22 15:02:13,466 INFO ][ait.timing.Log4jSink][http-8080-Processor3
gedq93kl][192.168.7.132][20][] Top taskssummaryfeatures:tasks
taskssummaryfeatures:tasks Elapsed time: own 380.146316 ms, total
380.14688 ms Total CPU: own 150.0 ms, total 150.0 ms User CPU: own 140.0 ms,
total 140.0 ms System CPU: own 10.0 ms, total 10.0 ms Blocked count: own 40,
total 40 Blocked time: own 22 ms, total 22 ms Wait count: own 2, total 2
Wait time: own 8 ms, total 8 ms Database execution time: own 57 ms, total 57
ms Database execution count: own 11, total 11Database logical read count: own
0, total 0 Database physical read count: own 0, total 0 Database CPU time:
own 0 ms, total 0 ms Database received bytes: own 26188 By, total 26188 By
Database sent bytes: own 24868 By, total 24868 By Error Pages: own 0, total
0 Bobo execution time: own 40.742124 ms, total 40.742124 ms Bobo execution
count: own 2, total 2 Bytes transferred via bobo search: own 0 By, total 0 By
Super search entity count: own 0, total 0 Super search count: own 0, total 0
Bytes transferred via super search: own 0 By, total 0 By Elapsed time
during super search: own 0 ms, total 0 ms](https://image.slidesharecdn.com/java2days-2017perfmoncloud-171029180650/85/Performance-Monitoring-for-the-Cloud-Java2Days-2017-28-320.jpg)

![© 2017 Creative Arts & Technologies and others. All rights reserved.#Monitoring #Performance
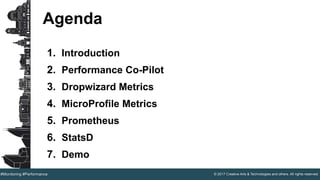
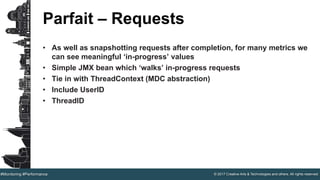
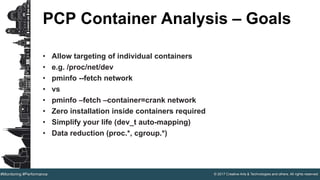
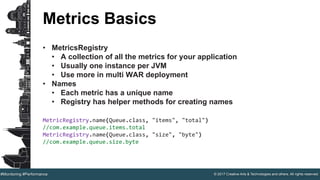
PCP for Containers – Cgroup
Accounting
• [subsys].stat files below /sys/fs/cgroup
• individual cgroup or summed over children
• blkio
• IOPs/bytes, service/wait time – aggregate/per-dev
• Split up by read/write, sync/async
• cpuacct
• Processor use per-cgroup - aggregate/per-CPU
• memory
• mapped anon pages, page cache, writeback, swap, active/inactive LRU
state](https://image.slidesharecdn.com/java2days-2017perfmoncloud-171029180650/85/Performance-Monitoring-for-the-Cloud-Java2Days-2017-33-320.jpg)


This document provides an overview of performance monitoring for cloud applications, detailing various tools and methodologies such as Performance Co-Pilot (PCP), Prometheus, and Dropwizard Metrics. It discusses the challenges associated with monitoring distributed systems in cloud environments and presents tips, types of monitoring, and metrics collection methods. Additionally, it outlines the architecture and components of several monitoring tools, emphasizing the importance of effective monitoring in maintaining application performance.