
Download to read offline

![• L 8 6 /13. 0 2 8
my.largs <- list(gp_labels = gpar(fontsize =10, fontfamily = “sans”),
gp_varnames = gpar(fontsize = 12, fontfamily = “sans”),
gp_text=gpar(fontsize =10, fontfamily = “sans”))
my.main <- gpar(fontsize = 14,fontfamily = “sans”)# main title
my.sub <- gpar(fontsize = 10,fontfamily = “sans”)# sub title
text_gp <- gpar(fontsize = 12,fontfamily = “sans”)# facet TR
# mosaic_jp L
mosaic_jp <- function(.tbl,mtitle=“mosaic_jp”,colset=“Set3”){
nc <- rev(dim(.tbl))[1]
mosaic(.tbl,gp=gpar(fill=brewer.pal(nc,colset),col=0),
margins = c(left = 5,top = 4),
labeling_args=my.largs,
main_gp = my.main,
sub_gp = my.sub,
rot_labels = c(left = 0, top = 45,right=0),
keep_aspect_ratio=FALSE,
main=mtitle,
labeling = labeling_values)
}
# # 27 ()](https://image.slidesharecdn.com/tokyo-180303053119/75/vcd-3-long-format-Gateway-3-2048.jpg)


![• .
• . a
• . a 63 28 . # ##/
3 0 2 2 T 12 0170 3 R F R F [R 3 38 L
01 : ]# # :7 :](https://image.slidesharecdn.com/tokyo-180303053119/75/vcd-3-long-format-Gateway-8-2048.jpg)


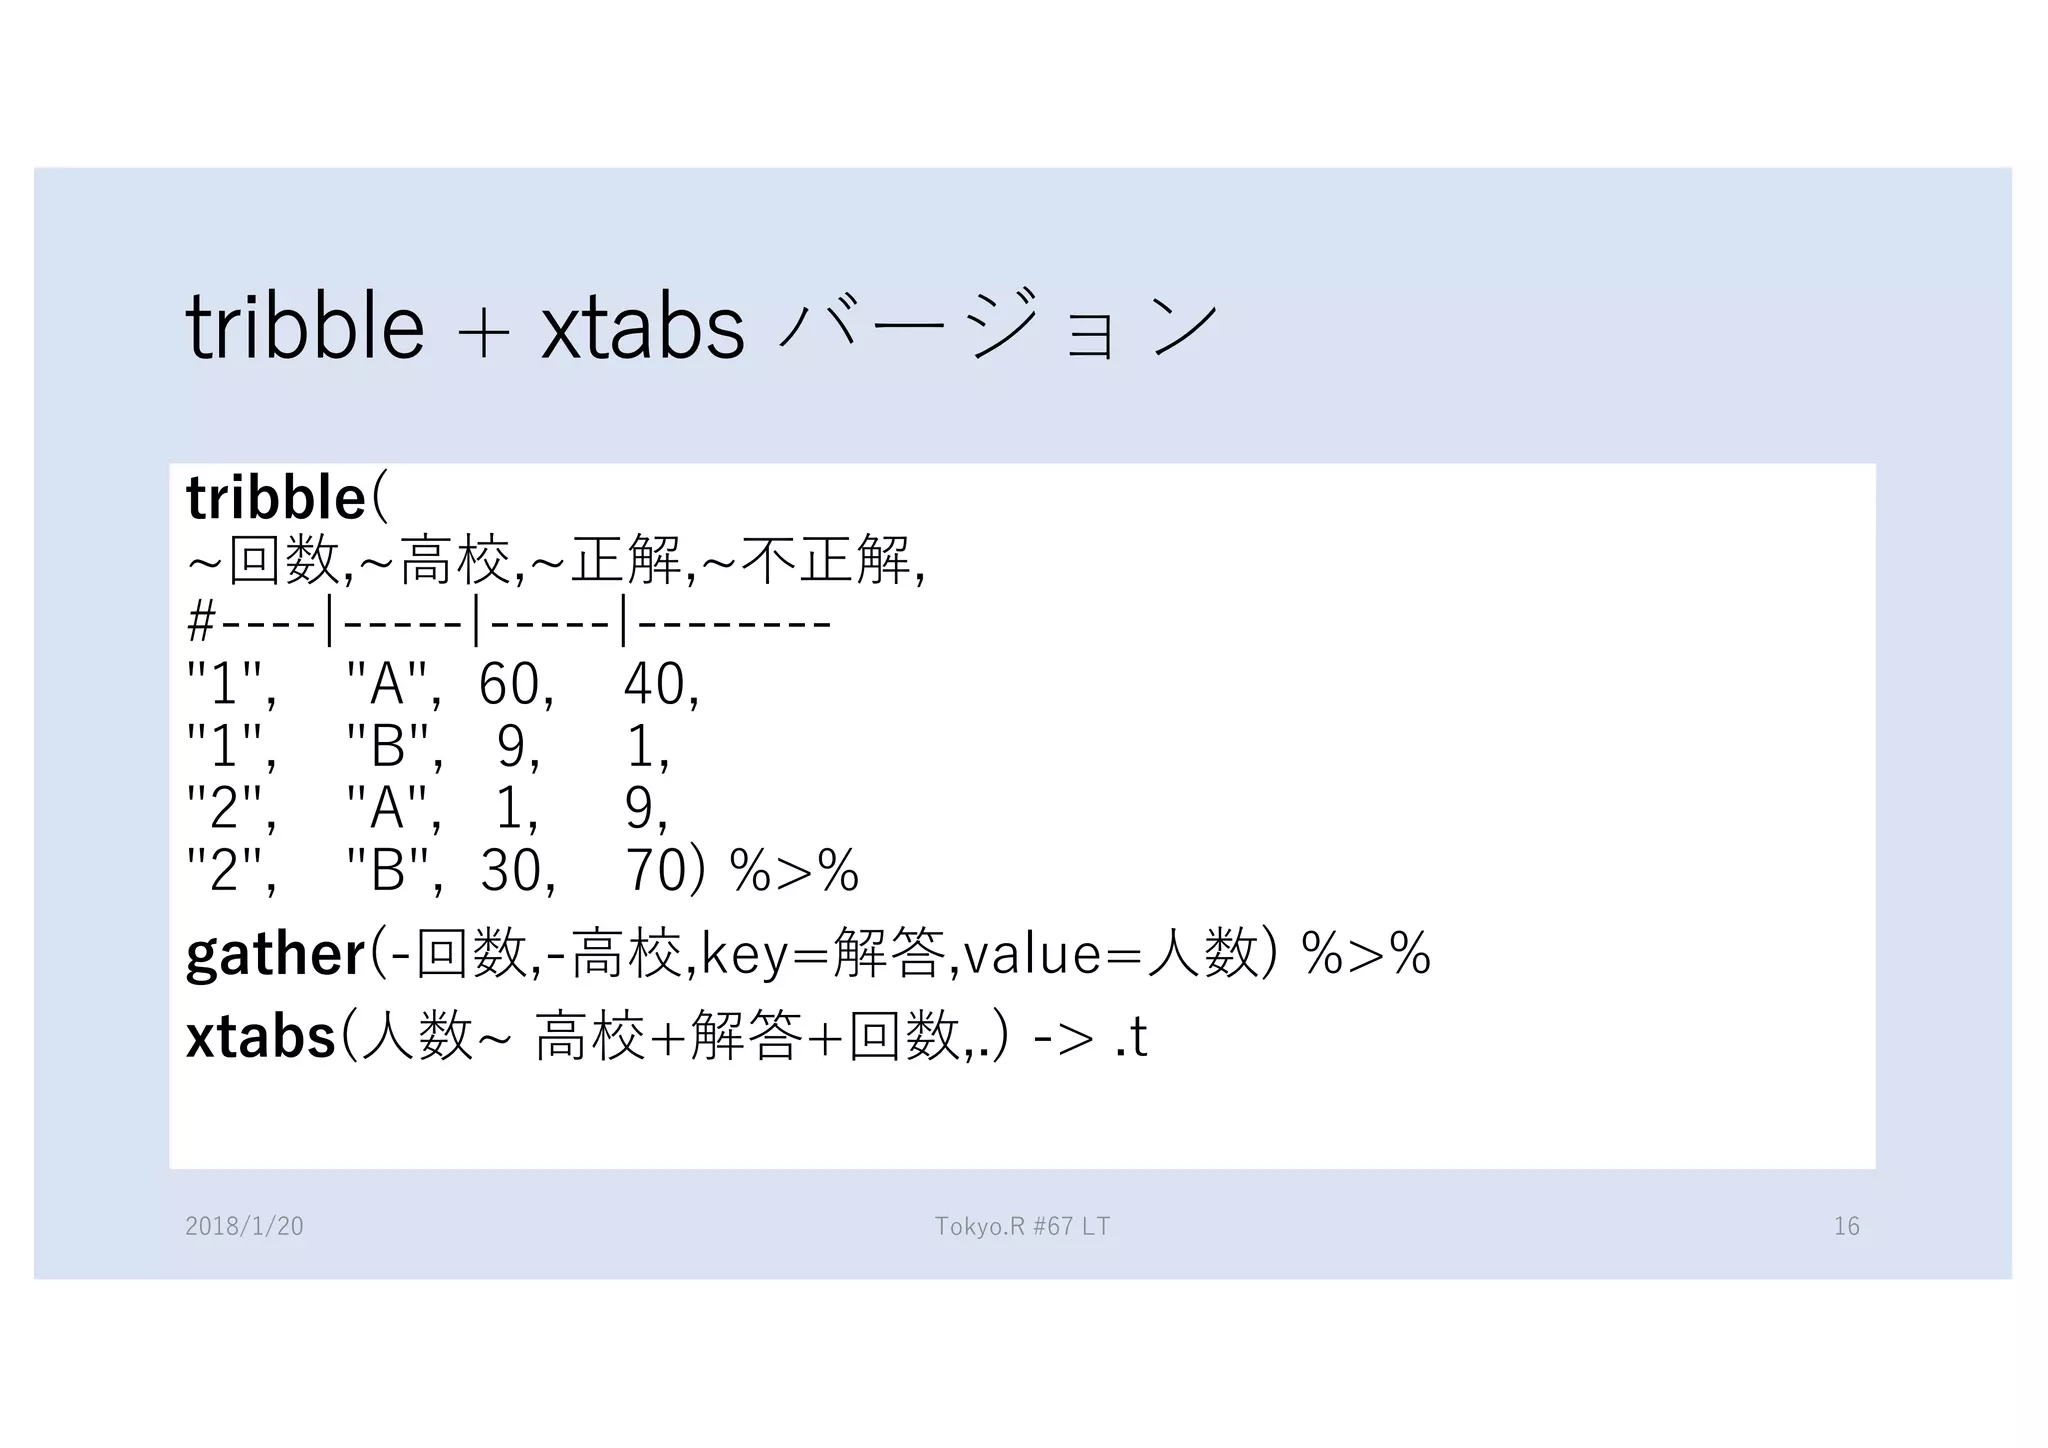


1) The document discusses formatting parameters for plots in R including font size, family, fill colors, margins, and label rotation. 2) It defines a mosaic_jp function to create mosaic plots with specified formatting and includes parameters for the main title, subtitles, and facet labels. 3) Examples are given of using the function to create mosaic plots and adjusting various plotting parameters like the number of color sets and font sizes for labels.


![[DSC Europe 25] Uros Pesic - The Reality of AI in Marketing.pdf](https://cdn.slidesharecdn.com/ss_thumbnails/rtkodnmtycovsllvzsyn-9-251215095918-b0c6bfe3-thumbnail.jpg?width=640&height=640&fit=bounds)


![[DSC Europe 25] Katherine Forrest - AI NOW: Understanding the Velocity of Cha...](https://cdn.slidesharecdn.com/ss_thumbnails/wvvbruqfrci0sfq9xwgb-4-251212104007-e5ad1987-thumbnail.jpg?width=640&height=640&fit=bounds)
![[DSC Europe 25] Marko Krstic - Understanding the AI Threat Landscape - Risks,...](https://cdn.slidesharecdn.com/ss_thumbnails/tiyim1ins5jvbrvzpzla-2-251209104645-c69d3553-thumbnail.jpg?width=640&height=640&fit=bounds)

![[DSC Europe 25] Branko Urosevic -Rethinking Financial Talent: Integrating Cod...](https://cdn.slidesharecdn.com/ss_thumbnails/8jjrus8ttko6qj64f58f-3-251212103250-642c6374-thumbnail.jpg?width=640&height=640&fit=bounds)
![[DSC Europe 25] Miodrag Pesovic & Vladislav Radonjic - Federated Data Archite...](https://cdn.slidesharecdn.com/ss_thumbnails/gsbe3y5it5uhndi4e08e-1-251212103249-f1008e0c-thumbnail.jpg?width=640&height=640&fit=bounds)

![[DSC Europe 25] Nikolay Burlutskiy - Best Practices for Building Enterprise M...](https://cdn.slidesharecdn.com/ss_thumbnails/uirvaiuvq8y1w8hzd9tx-7-251212103249-2619edb4-thumbnail.jpg?width=640&height=640&fit=bounds)
![[DSC Europe 25] Hans Kleinsman - The Compliance Gearbox: How Tax Tech Mediate...](https://cdn.slidesharecdn.com/ss_thumbnails/dxdytie1toel0hr90bjs-2-251212103250-174fdbe7-thumbnail.jpg?width=640&height=640&fit=bounds)

![[DSC Europe 25] Dunja Adzic Jovanovic - AI and Cybersecurity: Defending Data ...](https://cdn.slidesharecdn.com/ss_thumbnails/o1zylpbhrtwnixxq2xj8-7-251211083048-185086f6-thumbnail.jpg?width=640&height=640&fit=bounds)
![[DSC Europe 25] Branko Dzakula - From Defense to Attack: How AI Redefines Cyb...](https://cdn.slidesharecdn.com/ss_thumbnails/80bdzdxpr3ky2g0qvyk9-8-251211083048-ce5fc1ee-thumbnail.jpg?width=640&height=640&fit=bounds)
![[DSC Europe 25] Kaja Kandare - LLM as a judge.pptx](https://cdn.slidesharecdn.com/ss_thumbnails/arxyccaxsdsd1ba99wjw-7-251212104007-2b4e3f64-thumbnail.jpg?width=640&height=640&fit=bounds)