SlideShare a Scribd company logo
1 of 78
Download to read offline
1
Chapter 1
Executive Summary:
The report encompasses the summer internship project undertaken with JOISTER
INFOMEDIA PVT. LTD. under the guidance of Mrs. Vaishali, HR manager of
Joister Infomedia Pvt. Ltd. as a part of summer internship project. The report gives
the details of what has been done during the two months of the Summer Internship
Project. It also gives a brief about JOISTER INFOMEDIA PVT. LTD. This project
gave a great learning experience and at the same time it gave enough scope to
implement analytical ability. The project report shows the satisfaction of the
employees in the organization. This project as a whole can be divided into two parts.
The first part gives an insight about the company profile, objective of the study,
research methodology. One can have a brief knowledge about the
Telecommunication Industry and its basics through the project.
The second part of the project consist of data and its analysis collected through
survey. For the collection of primary data, structured questionnaire was prepared and
a survey of employees was made at Joister Infomedia Pvt. Ltd.
The main objective of the project report was to analyse the employee satisfaction
working in the organization which was observed by doing the survey of employees.
It gives a conclusion to the study with the help of different diagrams and bar charts.
The most important learning from this project was to understand how to interact with
different kind of people, deal and react at different situations.
This project covers the topic “Job satisfaction of the employees at JOISTER
INFOMEDIA PVT. LTD.” The data collected has been well organized and
presented.
2
Chapter 2
Introduction
2.1 Introduction to Industry:
Telecom-industry
The telecom industry has been divided into two major segments, that is, fixed and wireless cellular
services.
In today’s information age, the telecommunication industry has a vital role to play. Considered as
the backbone of industrial and economic development, the industry has been aiding delivery of
voice and data services at rapidly increasing speeds, and thus, has been revolutionising human
communication.
Although the Indian telecom industry is one of the fastest-growing industries in the world, the
current tele density or telecom penetration is extremely low when compared with global
standards. India’s tele density of 36.98% in FY09 is amongst the lowest in the world. Further, the
urban tele density is over 80%, while rural tele density is less than 20%, and this gap is increasing.
As majority of the population resides in rural areas, it is important that the government takes steps
to improve rural tele density. No doubt the government has taken certain policy initiatives, which
include the creation of the Universal Service Obligation Fund, for improving rural telephony.
These measures are expected to improve the rural tele-density and bridge the rural-urban gap in
tele-density
3
4
2.1.1 Current Status
Globalisation has made telecommunication an integral part of the infrastructure of the Indian
economy. The telecom sector in India has developed as a result of progressive regulatory regime.
According to the TRAI, the total gross revenue of the Indian telecom services industry was
Rupees 1,524 billion in FY09 up from Rupees 1,291 billion in FY08 registering a growth of
18.03% over FY08 and its subscriber base grew by 43% over FY08 to touch 429.70 million
subscribers in FY09.
The telecom sector in India experienced a rapid growth over the past decade on account of
regulatory liberalisation, structural reforms and competition, making telecom one of the major
catalysts in India’s growth story. However, much of this growth can be attributed to the
unprecedented growth in mobile telephony as the number of mobile subscribers grew at an
astounding rate from 10 million in 2002 to 392 million in 2009. Besides, the growth in the service
and IT and IT sector also increased the prominence of the telecom industry in India. Telecom has
emerged as a key infrastructure for economic and consumer growth because of its multiplier effect
and the fact that it is beneficial to trade in other industries. The contribution of the sector to GDP
5
has been increasing gradually (its contribution in GDP has more than doubled to 2.83% in FY07
from 1.0% in FY92).
Telecom is one of the fastest-growing industries in India; on an average the industry added 8
million wireless subscribers every month in FY08. The government had set a target of 500 million
telecom connections by 2010. However, according to the TRAI, the total subscriber base (wireless
and wireline) in the industry crossed the 500-mn-mark and reached 509.03 million by the end of
September 2009, which took India to the second position in terms of wireless network in the world
next only to China. Prior to liberalisation, the telecom sector was monopolised by the public sector
and recorded marginal growth; in fact, during 1948-1998, the incremental tele density in the
country was just 1.92%. However, the introduction of NTP’99 accelerated the growth of the sector
and the tele density increased from 2.33 in 1999 to 36.98 in 2009; however, much of this growth
was brought about by the NTP-99 policy changes such as migration from fixed license fee to
revenue sharing regime and cost-oriented telecom tariffs. From 2003 onwards the government
has taken certain initiatives such as unified access licensing regime, reduced access deficit,
introduction of calling party pays (CPP) and revenue sharing regime in ADC that has provided
further impetus to the sector.
The Indian telecom industry is characterised with intense competition, and continuous price wars.
Currently, there are around a dozen telecom service providers who operate in the wired and
wireless segment. The government has been periodically implementing suitable fiscal and
promotional policies to boost domestic demand and to create volumes for the industry.
The Indian telecom industry has immense growth potential as the tele density in the country is
just 36 as compared with 60 in the US, 102 in the UK and 58 in Canada. The wireless segment
growth has played a dominant role in taking the tele density to the current levels. In the next few
years, the industry is poised to grow further, in fact, it has already entered a consolidation phase
as foreign players are struggling to acquire a pie in this dynamic industry.
6
2.1.2 Role in India’s Development
Contribution to GDP
According to the UNCTAD, there is a direct correlation between the growth in mobile tele density
and the growth in GDP per capita in developing countries, which tend to have a high percentage
of rural population. The share of the telecom services industry in the total GDP has been rising
over the past few years (the telecom sector contribution in GDP went up from 2.52% in FY05 to
2.83% in FY07).
 Employment
The Indian telecommunication industry employs over 400,000 direct employees and about 85% of
these employees are from government-owned companies. The ratio of number of subscribers to
employees, an indication of efficiency and profitability, is much higher for private companies than
for government companies.
7
 Foreign Direct Investment (FDI)
Foreign direct investment has been one of the major contributors in the growth of the Indian
economy, and therefore, the need for higher FDI is felt across sectors in the Indian economy. The
telecom sector has played a crucial role in attracting FDI in India. The share of telecom sector in
the total FDI inflows in India has gone up to 10% in FY09 as compared with just 3% in FY05.
The telecom sector requires huge investments for its expansion as it is capital-intensive and FDI
plays a vital role in meeting the fund requirements for expansion of the telecom sector. Telecom
accounts for almost 10% of the total FDI inflows in the country and has been the third-largest
sector to attract FDI in India in the post-liberalisation era
The Indian telecom industry has been an attractive avenue for foreign investors over the years. As
per DIPP figures, the cumulative FDI inflow during August 1991 to June 2009 period, in the
8
telecommunication sector amounted to US$ 113 bn. FDI calculation takes into account radio
paging, cellular mobile and basic telephone services in the telecommunication sector.
In the 2004-05 Budget, the government raised the FDI limit from 49% to 74% in the telecom
services segment subject to retention of local management control. According to the new norms,
26% share out of the 74% should be held by an Indian company or an Indian citizen with Indian
management. Further, 100% FDI is permitted in telecom manufacturing, category I infrastructure
providers, ISPs without gateway, call centres and IT-enabled services. Further, direct or indirect
FDI up to 74% is permitted subject to licensing and security requirements for ISPs with gateways,
radio paging operators and category II infrastructure providers.
The relaxation in FDI norms has attracted many foreign telecom majors to the sector. The presence
of foreign players has not only encouraged faster infrastructure development and upgradation but
also has opened up the domestic industry to foreign competition. Since 2004, there has been a large
inflow of FDI in the sector. During 2004-05 and 2005-06, a period during which the FDI norms
were relaxed, the FDI inflow grew by an astounding 300% to US$ 624 million in 2005-06 from
merely US$ 125 million in 2004-05. The inflow of FDI has provided tremendous impetus to the
sector in the past few years and the attractiveness of the sector has kept the FDI inflows growing
steadily. During FY09 the FDI in the telecom sector at US$ 2,558 million was 103% higher than
that seen in FY08 at US$ 1,261 million. Further, the FDI in the sector has already reached
US$ 2010 million for a six-month period of FY10 (Apr-Sep 09) and is expected to surpass the total
FDI for FY09.
The government’s liberalised FDI policies have resulted in several foreign companies entering into
the Indian markets. The influx of foreign players in the Indian telecom industry has led to capacity
creation, and better infrastructure, which in turn has bettered the network quality. The rise in FDI
has also enabled technology transfer, market access and has improved organisational skills; going
forward, FDI could be used for providing telecom services to rural areas, where tele density is still
very low.
The change in FDI policy that has raised the FDI limit from 49% to 74% for the sector has made
it more attractive for foreign players. In the long run the growth prospects of telecom players that
have foreign partners will improve and other players will get new avenues to raise capital.
9
 Growth of IT-ITS and Financial Sector
India has entered the league of countries with the most-advanced telecommunication infrastructure
after the industry was deregulated. Furthermore, deregulation has stimulated India’s economic
growth through industry growth and through rise in investments. It is evident that a well-developed
communication sector improves access to social networks, lowers transaction costs, increases
economic opportunities, widens markets, and provides better access to information, healthcare and
educational services. The growth in Indian telecom sector has been concomitant with overall
growth in GDP, government revenue, employment et al. Besides, telecommunication has increased
efficiency, reduced transaction costs, attracted investments and has created new opportunities for
business and employment.
The NTP-99 was particularly helpful for the ITS-BPO industry as it ended the government
monopoly in international calling by introducing IP telephony. After the introduction of IP
telephony, there was rapid growth in the number of data processing centres and inbound/outbound
call centres, which ultimately led to the outsourcing revolution in India.
The telecom sector has been instrumental in creating jobs for a vast pool of talented and knowledge
professionals in the IT and ITS-BPO industry, which thrives on reliable telecommunication
infrastructure. India has become an important outsourcing destination for the world and the boom
in this sector also has transformed India’s economic dynamics. The evolution of telecom sector
has brought about a revolutionary change in the way some businesses operate.
Another beneficiary of the telecom revolution is the financial services industry, which has been on
a growth trajectory. The progress and quality of the financial sector has been a key factor that has
driven the pace and diversity of the real economy. India has an extensive and well-developed
financial sector with wide and sophisticated banking network. Banking in India has become
service-oriented, and has matured greatly from the days of walk-in customers to the present
situation when banks have migrated to a 24-hour banking platform to attract customers; however,
this disintermediation in the business has led banks to be extremely prudent in terms of their
internal operations and has led them to adopt newer products and delivery channels. Further, with
introduction of internet & mobile banking the long ques at the banks are slowly becoming a thing
of the past.
Both the financial and the IT-ITS segments rely on good domestic as well as international network
connectivity; therefore, there is a need for a sound telecommunication network.
10
Factors Facilitating Growth of the Sector
The phenomenal growth in the Indian telecom industry was brought about by the wireless
revolution that began in the nineties. Besides this, the following factors also aided the growth of
the industry.
1. Liberalization
The relaxation of telecom regulations has played a major role in the development of the Indian
telecom industry. The liberalisation policies of 1991 and the consequent influx of private players
have led the industry on a high growth trajectory and have increased the level of competition. Post-
liberalisation, the telecom industry has received more investments and has implemented higher
technology.
2. Increasing Affordability of Handsets
The phenomenal growth in the Indian telecom industry was predominantly aided by the meteoric
rise in wireless subscribers, which encouraged mobile handset manufacturers to enter the market
and to cater to the growing demand. Further, the manufacturers introduced lower-priced handsets
with add-on facilities to cater to the increasing number of subscribers from different strata of the
society. Now even entry-level handsets come with features like coloured display and FM radio.
Thus, the falling handset prices and the add-on features have triggered growth of the Indian
telecom industry.
3. Prepaid Cards Bring in More Subscribers
In the late nineties, India was introduced to prepaid cards, which was yet another milestone for the
wireless sector. Prepaid cards lured more subscribers into the industry besides lowering the credit
risk of service providers due to its upfront payment concept. Prepaid cards were quite a
phenomenon among first-time users who wanted to control their bills and students who had limited
resources but greater need to be connected. Pre-paid cards greatly helped the cellular market to
grow rapidly and cater to the untapped market. Further, the introduction of innovative schemes
like recharge coupons of smaller denominations and life time incoming free cards has led to an
exponential growth in the subscriber base.
4. Introduction of Calling Party Pays (CPP)
The CPP regime was introduced in India in 2003 and under this regime, the calling party who
initiated the call was to bear the entire cost of the call. This regime came to be applicable for mobile
11
to mobile calls as well as fixed line to mobile calls. So far India had followed the Receiving Party
Pays (RPP) system where the subscriber used to pay for incoming calls from both mobile as well
as fixed line networks. Shifting to the CPP system has greatly fuelled the subscriber growth in the
sector.
5. Changing Demographic Profile
The changing demographic profile of India has also played an important role in subscriber growth.
The changed profile is characterised by a large young population, a burgeoning middle class with
growing disposable income, urbanisation, increasing literacy levels and higher adaptability to
technology. These new features have multiplied the need to be connected always and to own a
wireless phone and therefore, in present times mobiles are perceived as a utility rather than a
luxury.
6. Increased Competition & Declining Tariffs
Liberalisation of the telecom industry has fuelled intense competition, especially in the cellular
segment. The ever-increasing competition has led to high growth of subscribers and has put
pressure on tariffs, which have seen a sharp drop over the years. When the cellular phones were
introduced, call rates were at a peak of Rupees 16 per minute and there were charges for incoming
calls too. Today, however, incoming calls are no longer charged and outgoing calls are charged at
less than a rupee per minute. Thus, the tariff war has come a long way indeed. Increased
competition and the subsequent tariff war has acted as a major catalyst for attracting more
subscribers. Apart from these major growth drivers, an improved network coverage, entry of
CDMA players, growth of value-added services (VAS), advancement in technology, and growing
data services have also driven the growth of the industry.
12
2.1.3 Outlook
The telecom industry in India has experienced exponential growth over the past few years and
has been an important contributor to economic growth; however, the cut-throat competition and
intense tariff wars have had a negative impact on the revenue of players. Despite the challenges,
the Indian telecom industry will thrive because of the immense potential in terms of new users.
India is one of the most-attractive telecom markets because it is still one of the lowest penetrated
markets. The government is keen on developing rural telecom infrastructure and is also set to roll
out next generation or 3G services in the country. Operators are on an expansion mode and are
investing heavily on telecom infrastructure. Foreign telecom companies are acquiring
considerable stakes in Indian companies. Burgeoning middle class and increasing spending
power, the government’s thrust on increasing rural telecom coverage, favourable investment
climate and positive reforms will ensure that India’s high potential is indeed realised.
13
2.2 Introduction to the Company:
About Company
Joister is a technology driven company. Here we crave for giving the ultimate in service. Be it
simple home based Internet solutions or a highly reliable, secure leased line connectivity.
Joister provides you with Wired & wireless broadband Solutions for both single as well as multiple
users. We surpass other internet service providers by delivering high speed internet service that is
10 times faster than the speeds of dialup connections! Whether you're looking for faster downloads,
streaming audio & video content, you've come to the right place.
Joister is an ISO 9001: 2008 Certified Company
At Joister we adhere to strict code called "PREFS". Which is translates into Partners, Reliable,
Efficient, Flexible and Secure Partners - When you sign up with us we end up as partners in growth,
which will definitely prove to be valuable in the long run.
TAG LINE:
Connecting everyone and everything.
 Partners - When you sign up with us we end up as partners in growth, which will definitely prove
to be valuable in the long run.
 Reliable - We go for the best in technology with a no compromise attitude. You can simply rely
on us.
 Efficient - Efficiency is the key to success. We are always there for our customers in time of their
needs. We have tailor made programs to suit any of our customer's requirements.
 Flexible - We believe in adapting to the need of the hour. Innovation is our mantra. Our solutions
are custom based.
Joister Broadband is a category 'A' ISP and ISO accredited broadband service provider. One of the
leading independent ISPs in India
14
Infrastructure
Joister has over 600 kms of optic fibre cable in operational cities facilitates world-class service
delivery to its customers. Joister has expanded and invested over 10 million on broadband cable
infrastructure across all operational cities.
Vision
Our vision is to be a leading Broadband and IT services company, offering innovative products
and solutions to home, enterprise and other customers in India and globally. We believe that our
next generation services will change the way we live, think, communicate and we believe that we
can make a significant contribution towards a powerful Broadband enabled India.
History
The beauty of the human mind is that it is forever curious, 'Good' is never enough. It has an
unquenchable thirst to learn, to ideate and to innovate. But the Founders of Joister are one of those
rare few who directed their curiosity to find solutions that make a difference. The success of Joister
parent company, Syscon Infoway Pvt. Ltd. was not enough for them. We wanted to do more. We
knew that though the internet was enabling people to do great things, there was scope for more, a
lot more. '' A lot more'' was the genesis of Joister. A company that would create products and
services which would make the internet experience simpler, faster and better!
And staying true to its promises, Joister has already created products and services like super-fast
broadband, online gaming servers and email services that have greatly enhanced the internet
experience for everyday users. And many more are in the offing. In just a short span of time, Joister
already has a list of blockbuster products and a team of some of the best industry professionals.
With Team Joister, you can be rest assured that they will not stop, not at 'good', not at 'better' but
only at the 'best'! Enjoy Joister!!!
Mission
To be the online brand specialist, that delivers not just effective solutions but a complete brand
experience. And at the same time, maximizing ROI through measurable results: higher sales and
better brand equity!
15
Simplicity
No matter how advanced technology becomes, ultimately, its simplicity matters to the end-user.
Therefore, we focus on building products that are easy-to-use and user-friendly. The needs that the
product serves might be diverse and complex yet the interface has to be SIMPLE!!!
Effective innovation
Innovations that are simply different don't always work. We focus on ''Effective Innovations'' i.e.
Innovations that serve a purpose, satisfy a need. We innovate to make things easier, simpler and
better!
Brand Partners not just clients
The client is always right except that we don't call them that. We call them, ''Brand Partners''.
Brand Building is a bit like living, it's not an assignment, it's a 24/7 obsession. One needs to live
and ideate every moment! And one can't do that for clients, one can only do that for partners, Brand
Partners.
Measurable Results
We design innovations keeping in mind the brand partner's most basic need i.e. to sell! We deliver
solutions that maximize reach at minimal costs! Every penny counts, it is directly proportional to
the results!
Not "Yes Men"
We are honest, straight forward and sometimes even blunt but the last one is only for the benefit
of our Brand Partners. We will disagree with you if we believe an idea doesn't work. Our aim is to
use our experience to tell you what's right for the brand. We are not ''Yes Men''. And neither should
we be, you pay us to build brands. And not to say only ''Yes''.
16
WHAT IS JOISTER BROADBAND?
Joister is an ISO 9001: 2008 Certified Company that provides Wired & Wireless Broadband
Solutions for both single as well as multiple users.
We surpass other internet service providers by delivering high speed internet service that is 10
times faster than the speeds of dialup connections! Whether you’re looking for faster downloads,
streaming audio & video content, you've come to the right place.
WHAT IS BROADBAND?
Broadband is an always-on-internet connection that can provide download speeds from minimum
of 256 kilobits per second (kbps).
WHAT ARE THE ADVANTAGES OF BROADBAND?
Broadband allows you to gain superior internet experience as compared to any dial-up internet
connection. This helps your tasks of downloading or uploading large-sized files or multimedia
content web pages much faster and saves your valuable time.
WHAT ARE THE POSSIBLE BROADBAND APPLICATIONS?
Broadband can be used for applications like online banking, travel ticketing, stock trading, video
chat over the Internet, Voice-over IP (VoIP) or downloading multimedia content like music,
movies and games to name a few.
WHY PREFER JOISTER BROADBAND OVER OTHERS?
 Joister Broadband offers high-speed data transfer
 Multi redundant Bandwidth Network -Trans Atlantic/Pacific and NIXI
 TRULY Unlimited Data Transfer - No stars or strings attached
 On-call Tech support
 Joister is one of the first private ISP to announce 16 & 25 Mbps unlimited plans
 Joister provides you top of it class fibre optic - in Mumbai, Maharashtra & Goa
 Number of internet based services like: Video on Demand, Bandwidth on Demand, Video
conferencing, Interactive Gaming and several other Value-Added-Services.
17
2.3 Introduction to Subject:
Human resource management:
Human resource management is comparatively new and rapidly growing profession in India.
Human Resource Management has been recognised as a profession by academicians and
industrialists because it has acquired all the qualification of a profession and has proved its worth.
It is the process of acquiring, training, training, appraising, and compensating employees, and of
attending to their labour relations, health and safety, & fairness concerns. HRM is also
management function concerned with hiring, motivating, and maintaining people in an
organization. It focuses on people in the organization.
Human resource management is service industry has now become necessity and it has to achieve
effective utilization of human resource, desirable working relationship among all employees,
maximum employee development, high moral in the organization and continuous development
and appreciation of human assets.
The productivity of the organization depends significantly on employee job satisfaction. It not only
influences the maximum work force but greatly improves the sense of morale and commitment
towards the organization amongst the employees. Conducive work environment is the one that
gives workers a sense of pride in what they do. However, employer that implement monetary as
well as non-monetary initiatives to increase employee satisfaction definitely reap the benefit of
reducing lethargy, absenteeism, and lower employee turnover rates with greater organizational
citizenship behaviour and commitments.
In order to meet the commitment of the employee’s job satisfaction, the organization supposes to
apply HRM theory into practices. According to the theoretical evidence on relationship of HR
practice with the organizational effective indicates that HR practice influence employee
commitment and other HR performance measure, which then lead to organization effectiveness.
Several elaborations of HRM have been studied in the previously research such as Bradley,
Petrescu and Simmons (2004) give the term of HRM practice as define the following set of
variables: work organization, supervision, employee involvement/voice, recruitment and selection,
training and learning, pay practices. Along the same line Pfeiffer (1994) identify the HRM
practices such as employment security, selectivity in recruiting, high wages, incentive pay,
18
employee ownership, participation and empowerment, promotion from within, training, and skill
development. In addition, Delerly and Doty (1996) utilize the seven variables of HRM practices
which are internal career opportunities, formal training system, appraisal measures, profit sharing,
employment security, employee voice mechanism, and job design.
Job Satisfaction:
According to Nancy C. Morse (1997) “Satisfaction refers to the level of fulfilment of one’s needs,
wants and desire. Satisfaction depends basically upon what an individual wants from the world,
and what he gets.” Employee satisfaction is a measure of how happy workers are with their job
and working environment. It is sure that there may be many factors affecting the organizational
effectiveness and one of them is the employee satisfaction. Effective organizations should have a
culture that encourages the employee satisfaction, Bhatti & Qureshi, (2007) Employees are more
loyal and productive when they are satisfied Hunter & Tietyen, (1997), and these satisfied
employees affect the customer satisfaction and organizational productivity, Potter field, (1999).
There is no limit for the employees to reach the full satisfaction and it may vary from employee to
employee. Sometimes they need to change their behaviours in order to execute their duties more
effectively to gain greater job satisfaction, Miller, (2006). Having good relationships with the
colleagues, high salary, good working conditions, training and education opportunities, career
developments or any other benefits may be related with the increasing of employee satisfaction.
Employee satisfaction is the terminology used to describe whether employees are happy,
contended and fulfilling their desires and needs at work. Many measures support that employee
satisfaction is a factor in employee motivation, employee goal achievement and positive employee
morale in the work place. ‟ Susan M. Heath field (About.Com). Cranny, Smith & stone (1992)
defined ES as the combination of affective reactions to the differential perceptions of what he/she
wants to receive compared with he/she actually receives. According to Moyes, Shao & Newsome
(2008) the employee satisfaction may be described as how pleased an employee is with his or her
position of employment. As Spector (1997) defined job satisfaction as all the feelings that a given
individual has about his/her job and its various aspects. Employee satisfaction is a comprehensive
term that comprises job satisfaction of employees and their satisfaction overall with companies‟
policies, company environment etc.
19
Employee satisfaction is the terminology used to describe whether employees are happy and
contented and fulfilling their desires and needs at work. Many measures meaning that employee
satisfaction is a factor in employee motivation, employee goal achievement, and positive employee
morale in the workplace. As per Vroom “Employee Satisfaction is a positive orientation of an
individual towards a work role which he is presently occupying” Employee satisfaction is a
measure of how happy workers are with their job and working environment. Keeping morale high
among workers can be of tremendous benefit to any company, as happy workers will be more
likely to produce more, take fewer days off, and stay loyal to the company. There are many factors
in improving or maintaining high employee satisfaction, which wise employers would do well to
implement. Employee satisfaction, while generally a positive in organization, can also be a bad
luck if mediocre employees stay because they are satisfied with your work environment. Many
experts believe that one of the best ways to maintain employee satisfaction is to make workers feel
like part of a family or team. Holding office events, such as parties or group outings, can help build
close bonds among workers. Many companies also participate in team-building retreats that are
designed to strengthen the working relationship of the employees in a non-work related setting.
Camping trips, paintball wars and guided backpacking trips are versions of this type of team-
building strategy, with which many employers have found success. Of course, few workers will
not experience a boost in morale after receiving more money. Raises and bonuses can seriously
affect employee satisfaction, and should be given when possible. Yet money cannot solve all
morale issues, and if a company with widespread problems for workers cannot improve their
overall environment, a bonus may be quickly forgotten as the daily stress of an unpleasant job
continues to mount. If possible, provide amenities to your workers to improve morale. Make
certain they have a comfortable, clean break room with basic necessities such as running water.
Keep facilities such as bathrooms clean and stocked with supplies. While an air of professionalism
is necessary for most businesses, allowing workers to keep family photos or small trinkets on their
desk can make them feel more comfortable and nested at their workstation. Basic considerations
like these can improve employee satisfaction, as workers will feel well cared for by their
employers. The backbone of employee satisfaction is respect for workers and the job they perform.
In every interaction with management, employees should be treated with courtesy and interest. An
easy avenue for employees to discuss problems with upper management should be maintained and
carefully monitored. Even if management cannot meet all the demands of employees, showing
20
workers that they are being heard and putting honest dedication into compromising will often help
to improve morale. Satisfaction = f (what employee expects, what he gets, time, back ground of
the employee- social, economic, cultural) Satisfaction being a continuous process starts from the
day 1 and gets reinforced with time depending on the importance of the various factors considered
to be important for the individual employee. Loyalty towards the organization starts to develop
when the employee continues to get the positive reinforcements on various important aspects for
the duration of the employment.
Employee satisfaction has been defined as a function of perceived performance and expectations.
It is a persons’ feeling of pleasure or disappointment resulting from comparing a products’
outcome to his/her expectations.
If the performance falls short of expectations, the employee is dissatisfied and if it matches the
expectations, the employee is satisfied. A high satisfaction implies improvement in efficiency and
performance doing work or service. The process is however, more complicated then it appears. It
is more important for any organization to offer high satisfaction, as it reflects high loyalty and it
will not lead to switching over once a better offer comes in.
21
2.4 Introduction to Project:
Employee satisfaction has been defined as a function of perceived performance and expectations.
It is a persons’ feeling of pleasure or disappointment resulting from comparing a products’
outcome to his/her expectations.
If the performance falls short of expectations, the employee is dissatisfied and if it matches the
expectations, the employee is satisfied. A high satisfaction implies improvement in efficiency and
performance doing work or service. The process is however, more complicated then it appears. It
is more important for any organization to offer high satisfaction, as it reflects high loyalty and it
will not lead to switching over once a better offer comes in.
Research employees differently described the factors contributing to job satisfaction and job
dissatisfaction. The survey made regarding the job satisfaction in Joister Infomedia Pvt. Ltd. Will
facilitate and enables the management to know the perceptions and inner feelings regarding the
job they are performing on day-to-day basis. The term job satisfaction reveals and focuses on the
likes and dislikes of the employees of JIPL.
In this particular study, effort was made to identify the causes for satisfaction and dissatisfaction
among the employees. So this is the most effective and selective instrument for diagnosing and
peeping into the employee’s problems. Job satisfaction survey can give the most valuable
information the perceptions and causes. For satisfaction/dissatisfaction among the employee
attitude towards job satisfaction may be either positive or negative.
With the objective to study the satisfaction level of employees in the organization a group of 68
employees of Joister Infomedia Pvt. Ltd. was selected and interviewed to gather responses to a
structured questionnaire dealing with various aspects of job satisfaction. The data gathered was
analysed and the results are provided in the analysis and findings.
22
After the detailed study of this research work, following points has been drawn: -
1) Attrition rate is quite high in Telecom Industry
2) There is a high need and demand of training and development in telecom industry,
technology keeps changing and updating. Hence, to achieve competitive advantage, one
needs to be updated.
23
Literature Review
‘Bad work culture troubles India Inc. employees the most’
Unclear growth path, reporting to the bad managers, no access to learning & development tools
are making India Inc employees jittery, finds the Times Jobs Survey.
Unclear growth path, reporting to the bad managers, and lack of recognition, no access to learning
and development tools to upgrade skillsets are troubling India Inc. employees the most. Nearly
50% Indian employees cite bad work culture as the most worrisome workplace elements at their
organizations. This was revealed in a Times Jobs Survey done on more than 1000 professionals
across different sectors. Shedding more light on overall state of work culture in India Inc., 52%
employees rated their workplace as ‘bad’ while only 20% rated it as “good”. The remaining 28%
employees felt that their company is working towards building a strong work culture.
"An engaged and motivated workforce is crucial in today's hypercompetitive environment to
ensure success. So a dissatisfied employee is a liability that no organization can afford. With the
advent of multiple engagement platforms such as webinars, R&Rs, AMAs, TJ Social Connect,
JobBuzz and TechGig.com organizations need only chose the most suitable tools to create an
atmosphere of positivity and productivity within their workforce." Says Nilanjan Roy, Head of
Strategy, Times Business Solutions.
About half of surveyed respondents (47%) said they were unclear about career growth path in their
organizations. Among the dissatisfied lot, nearly 60% employees felt that their workplace offered
limited opportunities for career growth.
And about 30% said a bad boss or reporting manager was the most unpleasant thing to face at the
workplace. More than half of the employees who said they are unhappy with their reporting
manager also stated unclear vision of the manager as the most annoying trait which hindered their
growth, followed by favouritism (30%), rigidity (25%) and lack of domain knowledge (11%).
Nearly 22% of the surveyed employees said they felt a lack of learning and development
opportunities and almost 70% of these stated they have no access whatsoever to learning and
development tools to upgrade and upskill themselves. Another 16% were upset about the lack of
recognition at their workplace.
24
On further probing what limited their career growth, 68% employees cited external factors while
32% blamed their personal reasons. Among external factors, 35% attributed it to monotonous
work and lack of challenging assignments. While about 33% felt biased a reporting manager
limited their career growth. Of those who cited personal reasons as the biggest roadblock to career
growth, nearly 20% blamed it on deteriorating skills sets and 12% on their own attitude towards
work.
Of the employees who raised concerns about the lack of recognition at the workplace, 70% said
they don’t feel valued at work. In fact, 30% claimed they have never been appreciated for their
contribution to the workplace while 50% said they are appreciated only sometimes. Sadly, of those
who said they have never been appreciated, 35% have spent 2-5 years at their current
organizations.
https://www.peoplematters.in/news/culture/bad-work-culture-troubles-india-inc-employees-most-
13543?utm_source=peoplematters&utm_medium=interstitial&utm_campaign=learnings-of-the-day
25
Project details
3.1 Objectives of the Research:
 To identify the level of job satisfaction of employees in the organization
26
3.2Research Methodology:
1. Primary Data:
 The source of data collection was a questionnaire (for the primary data). The data was
collected by using a structured questionnaire as well as interviewing the representatives
from the employees.
2. Secondary Data:
 The secondary data was collected from the organizations manuals, company’s website,
books and brochures. For theoretical overview various books on HR policies were
consulted. Internet has played a major role in finding facts related to the study of the
project.
27
3.3 Sample size:
The data was collected from sixty-eight employees.
3.4Limitation of the Project:
1. Time Bound:
The research was conducted within a short period of time. Therefore, it may not represent
a true picture.
2. Particular to one Organization:
The research is limited only to one organization. Therefore, no comment can be made
regarding the whole industry.
3. Sampling Error:
Workers were busy with their routine work and in the middle of their work the
questionnaire was circulated. So there is a possibility that they did not respond to the
questions properly.
28
Chapter 4
Analysis & Findings:
A. Personal details
1. Which of the following department do you work in?
Table:
Department Responses
Sales 15
Technical 19
Finance/Accounting 5
Operation/Implementation 15
Marketing 2
HR/Administration 3
Software Development 0
Revenue Assurance 6
Others 3
Total 68
29
Inference:
 About 28% respondents are from technical department, 22% are from sales department,
8% are from finance/accounting department, 22% are from operations/implementation, 3%
respondents are from marketing department, 4% were from HR/administration department,
9% from revenue assurance and 4% of employees are working in others department
includes peons, clerk, administrator etc.
 Since it’s an internet service providing company there is a majority of technical, sales and
operation/implementation department.
Sales
22%
Technical
28%
Finance/Accounting
8%
Operations/Impleme
ntation
22%
Marketing
3%
HR/Administration
4%
Revenue Assurance
9%
Others
4%
Personal Details
Sales Technical Finance/Accounting
Operations/Implementation Marketing HR/Administration
Software Development Revenue Assurance Others
30
2. Which of the following is your position in Joister?
Table:
Position/level Responses
Entry Level 5
Executive 19
Senior Executive 16
Team Leader 3
Manager 19
Senior Manager 4
Leadership Team 0
Total 68
Graph:
7%
28%
27%
4%
28%
6%
Position/level
Entry level Executive Senior executive Team leader
Manager Senior manager Leadership team
31
Inference:
 Majority i.e. 28% of employee are of executive and managerial level.
 Company has majority of people working at lower level i.e. entry, executive and senior
executive level.
 Joister should form a leadership team as there is no such hierarchy in the organization.
32
3. What is your primary work location?
Primary work location Responses
Office 47
Field Staff 21
Inference:
 69% of the total employees have their primary work location as office.
 31% of the total employees have their primary work location as field staff.
69%
31%
Primary work location
Office
Field staff
33
4. How long have you been associated with Joister/Syscon?
Table:
Tenure Responses
Less than 6 months 9
6 months – 1 year 8
1 – 3 years 38
3 - 5 years 10
More than 5 years 3
Total 68
Graph:
Inference:
From the above table and graph it is evident 81 % of employees in Joister are working for not more
than 3 years, that means attrition rate is quite high in the company.
13%
12%
56%
15%
4%
Responses
Less than 6 months
6 months – 1 year
1 – 3 years
3 - 5 years
More than 5 years
34
5. What is your age?
Table:
Age Responses
18-22 2
22-25 15
26-30 18
31-35 19
36-40 9
41-55 5
More than 55 years 0
Total 68
Inference:
Most of the employees i.e.79% belong to the age group of 18-35 which means the company has a
young workforce.
3%
22%
27%
28%
13%
7%
Age
18-21
22-25
26-30
31-35
36-40
41-55
more than 55 years
35
B. Mission and purpose
6. Select the most suitable option.
Table:
Respondents Strongl
y
Disagre
e
Disagre
e
Somewhat
Disagree
Somewhat
agree
Agree Strongl
y Agree
To
tal
I have a good
understanding of
mission and goals of
the company and
very well know how
my work contributes
to it.
9 3 11 38 7 68
My job is important
in accomplishing the
mission of the
organization
10 2 4 43 9 68
Doing my job well
gives me a sense of
personal satisfaction
9 1 3 6 42 7 68
36
Inference:
 Approximately 82% of employees have a good understanding of mission.
 Approximately 82% of employees feel that their job is important in accomplishing the
mission of the company.
 80% of employees feel their job gives them a sense of satisfaction.
 So it can be concluded that employees working in the organization have a good
understanding of mission and purpose of the company
9 10 10
1
11
4 63 2 3
38
43 42
7 9 7
I HAVE A GOOD UNDERSTANDING OF
MISSION AND GOALS OF THE
COMPANY AND VERY WELL KNOW
HOW MY WORK CONTRIBUTES TO IT
MY JOB IS IMPORTANT IN
ACCOMPLISHING THE MISSION OF
THE ORGANISATION
DOING MY JOB WELL GIVES ME A
SENSE OF PERSONAL SATISFACTION
Chart Title
Strongly disagree Disagree Somewhat agree Somewhat disagree Agree Strongly agree
37
7. What do you think can be done to make you feel important/involved in accomplishing the
mission?
Inference:
 Most of the employees want Joister to conduct training and development programs
followed by employee engagement activities, seminars/workshops on industry related
knowledge sharing and then meeting with CEO to make them feel important.
35
50
40
31
0 10 20 30 40 50 60
SEMINARS/WORKSHOPS ON INDUSTRY RELATED
KNOWLEDGE SHARING
TRAINING AND DEVELOPMENT PROGRAMS
EMPLOYEE ENGAGEMENT ACTIVITIES
DIRECTOR'S ADDRESS(CEO MEETING EMPLOYEES
DIRECTLY TO DISCUSS THEIR ISSUES AND CONCERNS
AND ENCOURAGING THEM TO COME UP WITH…
Responses
Responses
38
C. Policies
8. Are you satisfied with the following policies of the company?
Table:
Completely
Dissatisfied
Somewhat
dissatisfied
Somewhat
Satisfied
Completely
Satisfied
Total
Working hours 1 11 18 38 68
Shift timings 3 8 18 39 68
Flexible timing
policy (no late
marks)
3 2 17 46 68
Vacation time I
receive and enjoy
6 12 19 31 68
Paid leaves I receive
and enjoy
9 9 18 32 68
39
Inference:
 Although 18% of the employees have expressed completely dissatisfied or somewhat
dissatisfied opinion relating to the satisfaction level of workings hours of the company,
while 80% of them are satisfied with it.
 Although 12% of the employees have expressed completely dissatisfied or somewhat
dissatisfied opinion relating to the satisfaction level of shift timings of the company, while
88% of them are satisfied with the same.
 93% of the employees are satisfied with the flexible timing policy followed by the Joister
whereas hardly 7% of employees are dissatisfied by it.
 27% of the employees are dissatisfied by the vacation time and paid leaves. They might
not be getting the permission to take those benefits because of work pressure, whereas there
are 73% of employees who feel satisfied by the benefits they get.
1 3 3 6
9
11
8 2
12
9
18 18 17
19 18
38 39
46
31 32
WORKING HOURS SHIFT TIMINGS FLEXIBLE TIMING
POLICY(NO LATE
MARKS)
VACATION TIME I
RECEIVE AND ENJOY
PAID LEAVES I
RECEIVE AND ENJOY
Chart Title
Completely Dissatisfied Somewhat dissatisfied Somewhat Satisfied Completely Satisfied
40
D. Work environment(amenities)
9. Are you satisfied with the following amenities provided by Joister?
Inference:
 94% i.e. 64 number of the employees are satisfied with their working environment while
just 6% i.e. 4 are dissatisfied.
 72% i.e. 49 number of the employees are satisfied with the pantry facility whereas 17% i.e.
12 feel completely dissatisfied.
 Although 16% i.e. 11 number of employees are dissatisfied by the work place comfort
majority i.e. 84% i.e. 57 are satisfied with it.
 Although 18% i.e. 12 number of the employees have expressed completely dissatisfied or
somewhat dissatisfied opinion relating to the satisfaction level of workings hours of the
company, while 80% i.e. 54 of them are satisfied with it.
1
12
4 53 7 7 9
21 20
17
21
43
29
40
33
THE WORK
ENVIRONMENT(WELL
MAINTAINED, SAFE,
HYGIENIC AND A
PHYSICALLY
COMFORTABLE)
THE PANTRY FACILITIES
AND RESOURCES(TEA,
COFFEE, DRINKING WATER,
MICROWAVE FACILITY ETC)
THE WORK PLACE
COMFORT AND
DESIGN(FURNITURE, DESK
SPACE, A/C COOLING,
LIGHTS ETC)
THE WORK PLACE TOOLS
(HARDWARE, SOFTWARE,
COMPUTERS)
Chart Title
Completely Dissatisfied Somewhat dissatisfied Somewhat Satisfied Completely Satisfied
41
E. Opportunities for growth
10. How much do you agree with the following statements?
Inference:
 84% of the employees agree that they receive enough on-the job training.
 94% of the employees agree that their manager is encouraging, supporting to them and also
encourages them to learn from mistakes.
 Majority of the employees agree that their work challenging, stimulating and rewarding
and they have clear idea of career path/growth in Joister. They also believe that Joister can
offer enough training to achieve career growth.
 Most of the employees agree that they are provided training and development opportunity
and have an access to learning and development tools.
2 1 0 1 1 2 3 24 1 1 1 1 1 4 35 3 1 0 3 1 6 2
23
16 15 16 14 14
21 22
32
42
46 44 44
48
31
35
2 5 5 6 5 2 3 4
Chart Title
Strongly disagree Disagree Somewhat disagree Somewhat agree Agree Strongly Agree
42
F. Career path/growth:
11. What do you think limits your career path/growth in Joister?
Inference:
Most of the employees believe that lack of training & development, unclear growth path,
monotonous work and personal factors limits their career path/growth in the organization, others
think that biased reporting manager and their own attitude hinders their career growth/path.
15
9
29
18
7
14
9
0 5 10 15 20 25 30 35
MONOTONOUS WORK
BIASED REPORTING MANAGER
LACK OF TRAINING & DEVELOPMENT
UNCLEAR CAREER GROWTH/PATH
LACK OF CHALLENGING ASSIGNMENTS
PERSONAL FACTORS
YOUR OWN ATTITUDE TOWARDS WORK
Responses
Responses
43
G. Communication and relationship with reporting manager
12. How much do you agree with the following statements?
0 0 0 0 0 0 0 0
18
01 1 1 1 1 2 2 1 11 11 2 3 4 1 0 3 8 2
13 14
11 9
12 11 9 10 12
8
47 45 47 46
43 43 45 45
17
48
7 7 7 9 8 11 12
9 2 9
Chart Title
Strongly disagree Disagree Somewhat disagree Somewhat agree Agree Strongly Agree
44
Inference:
 From the above analysis it is clear that 69% of the employees agree that their reporting
manager empowers them to perform best, 19% of them somewhat agree, 10% of them
strongly agree with this, and none of them strongly disagree.
 From the above analysis it is clear that 66% of the employees agree that their reporting
manager provides me with actionable suggestions to improve themselves, 21% of them
somewhat agree, 10% of them strongly agree with this, 4% of them somewhat disagree to
it and none of them strongly disagree.
 From the above analysis it is clear that 69% of the employees agree that their reporting
manager promotes an atmosphere of teamwork, 16% of them somewhat agree, 10% of
them strongly agree with this, 3% of them somewhat disagree with this, 1% of them
disagree to it and none of them strongly disagree.
 From the above analysis it is clear that 68% of the employees agree that they have a clear
idea of what their reporting manager expects from them, 13% of them somewhat agree,
13% of them strongly agree with this, 3% of them somewhat disagree, 1% disagree to it
and none of them strongly disagree.
 From the above analysis it is clear that 63% of the employees agree that their reporting
manager evaluates their performance regularly, 18% of them somewhat agree, 12% of them
strongly agree with this, 6% of them somewhat disagree, 1% disagree to it and none of
them strongly agree.
 From the above analysis it is clear that 63% of the employees agree that their reporting
manager actively listens to their suggestions/encourages two-way communication, 16% of
them somewhat agree, 16% of them strongly agree with this, 1% of them somewhat
disagree, 3% disagree to it and none of them strongly agree.
 From the above analysis it is clear that 66% of the employees agree that their reporting
manager addresses to their concerns, 13% of them somewhat agree, 18% of them strongly
agree with this, 3% disagree to it and none of them strongly agree.
 From the above analysis it is clear that 66% of the employees agree that their reporting
manager gets involved in understanding base level issues necessary for smooth functioning
45
of department, 15% of them somewhat agree, 13% of them strongly agree with this, 4% of
them somewhat disagree, 1% disagree to it and none of them strongly agree.
 From the above analysis it is clear that 25% of the employees agree that their reporting
manager lacks in domain knowledge, 18% of them somewhat agree, 3% of them strongly
agree with this, 12% of them somewhat disagree, 16% disagree to it and 26% strongly
agree.
 From the above analysis it is clear that 71% of the employees agree that their reporting
manager is a motivating leader, 12% of them somewhat agree, 13% of them strongly agree
with this, 3% of them somewhat disagree, 1% disagree to it and none of them strongly
agree.
46
H. Performance management system
13. Do you think there should be a goal setting process conducted at the start of financial year?
Responses
Yes 65
No 3
Total 68
Inference:
From the above table and graph it is evident that almost everyone in the organization want that
there should be a goal setting process at the start of the financial year.
95%
5%
Responses
Yes
No
47
14. How frequently do you want the performance reviews to be conducted?
Inference:
 51% of the employee want performance reviews to be conducted every quarterly.
 25% of them want organization to conduct every six monthly, 22% monthly and very few
people i.e. only 2% want organization to conduct performance reviews annually.
22%
51%
25%
2%
Resonses
Monthly
Quarterly
Six monthly
Annually
48
15. Which method do you want Joister to adopt while doing performance appraisals?
Table:
Method Responses
90 degree appraisals (review by reporting
manager)
10
180 degree appraisals (review by self and
reporting manager)
56
360 degree appraisals (review by reporting
manger, self, peer group and subordinates
and customer feedback)
2
Total 68
15%
82%
3%
Responses
90 degree appraisals (review by
reporting manager)
180 degree appraisals (review by
self and reporting manager)
360 degree appraisals(review by
reporting manager, self, peer group
and subordinates and customer
feedback)
49
Inference:
 Although 15% and 3% employees want Joister to adopt 90-degree appraisal and 360 degree
appraisals.
 Whereas 82% of them want Joister to adopt 180 degrees as a method of doing performance
appraisals
50
I. Feedback
16. How much do you agree with the following statements?
1 1 0 0 1
10
3 2 3 0 1
15
3 5 4 2 5 8
18
21
19
4
18 18
41
36
38
44
40
16
2 3 4 8 3 1
I RECEIVE TIMELY,
USEFUL AND
CONSTRUCTIVE
FEEDBACK
WHICH HELPS ME
TO IMPROVE MY
PERFORMANCE
I HAVE AN
OPPORTUNITY TO
PARTICIPATE IN
THE GOAL
SETTING PROCESS
OF THE
DEPARTMENT
WHEN I DO A
GOOD JOB, I
RECEIVE THE
PRAISE AND
RECOGNITION I
DESERVE
I BELIEVE THAT
REGULAR
APPRAISAL KEEPS
ME MOTIVATED
TOWARDS MY
WORK
I FEEL VALUED AT
MY WORKPLACE
AND TEAM
I HAVE NEVER
RECEIVED ANY
APPRECIATION
FOR MY
CONTRIBUTION
TO WORKPLACE
Chart Title
Strongly disagree Disagree Somewhat disagree Somewhat agree Agree Strongly Agree
51
Inference:
 From the above analysis it is clear that 60% of the employees agree that they receive timely,
useful and constructive feedback which helps them to improve their performance, 26% of
them somewhat agree, 3% of them strongly agree with this, 4% of them somewhat disagree,
4% disagree to it and 1% of them strongly disagree.
 From the above analysis it is clear that 53% of the employees agree that they have an
opportunity to participate in the goal setting process of the department, 31% of them
somewhat agree, 4% of them strongly agree with this, 7% of them somewhat disagree, 3%
disagree to it and 1% of them strongly disagree.
 From the above analysis it is clear that 56% of the employees agree that when the do a
good job they are praised and recognised accordingly, 28% of them somewhat agree, 6%
of them strongly agree with this, 6% of them somewhat disagree, 4% disagree to it and
none of them strongly disagree.
 From the above analysis it is clear that 65% of the employees agree that they believe that
regular appraisal keeps them motivated towards their work, 6% of them somewhat agree,
12% of them strongly agree with this, 3% of them somewhat disagree, none of them neither
disagree or strongly disagree.
 From the above analysis it is clear that 59% of the employees agree that they feel valued
at their work place, 26% of them somewhat agree, 4% of them strongly agree with this, 7%
of them somewhat disagree, 1% disagree to it and 1% of them strongly disagree.
 From the above analysis it is clear that 24% of the employees agree that they have never
received any appreciation for their contribution to workplace, 26% of them somewhat
agree, 12% of them somewhat disagree, 22% disagree to it and 15% of them strongly
disagree and none of them strongly agree with this.
52
J. Teamwork
17. How often do you think is teamwork practiced in Joister?
Inference:
 Although 38% of the employees have expressed very often opinion relating to the fact of
how often teamwork is encouraged in the company, while 29%, 18%, 9%, and 6% of them
feel teamwork is extremely often, moderately often, slightly often and not at all often
opinion respectively.
 Although 37% of the employees have expressed very often opinion relating to the fact of
how often there is a proactive sharing in the company, while 26%, 22%, 9%, and 6% of
them feel teamwork is extremely often, moderately often, slightly often and not at all often
opinion respectively.
20
18
26
25
12
15
6 6
4 4
TEAMWORK IS ENCOURAGED AND PRACTICED IN THIS
ORGANIZATION
THERE IS PROACTIVE SHARING OF TASKS DONE HERE
Chart Title
Extremely often Very often Moderately often Slightly often Not at all often
53
K. Benefits
18. Are you satisfied with the following parameters?
10
9
2 3
14
16
12
2
6 6
20
26
30
29
30
20
15
21
20
11
2
6
13
10
7
YOUR SALARY YOUR BONUS
PAYOUT
STATUTORY BENEFITS
OFFERED BY
COMPANY (PF & ESIC
BENEFITS)
NON-STATUTORY
BENEFITS OFFERED BY
COMPANY (MEDICAL
POLICY)
YOUR INCENTIVES IF
ANY
Chart Title
Completely Dissatisfied Somewhat Dissatisfied Neutral
Somewhat Satisfied Completely Satisfied
54
Inference:
 Although 38% of the employees have expressed completely dissatisfied or somewhat
dissatisfied opinion relating to the satisfaction level of their salary, while 32% of them are
completely satisfied or somewhat with, and rest 30% are neutral to it.
 Although 31% of the employees have expressed completely dissatisfied or somewhat
dissatisfied opinion relating to the satisfaction level of their bonus pay-outs, while 31% of
them are completely satisfied or somewhat with, and rest 38% are neutral to it.
 Although 6% of the employees have expressed completely dissatisfied or somewhat
dissatisfied opinion relating to the satisfaction level of statutory benefits offered by the
company, while 50% of them are completely satisfied or somewhat with, and rest 44% are
neutral to it.
 Although 13% of the employees have expressed completely dissatisfied or somewhat
dissatisfied opinion relating to the satisfaction level of non-statutory benefits offered by
the company, while 44% of them are completely satisfied or somewhat with, and rest 43%
are neutral to it.
 Although 30% of the employees have expressed completely dissatisfied or somewhat
dissatisfied opinion relating to the satisfaction level of incentives offered by the company,
while 26% of them are completely satisfied or somewhat with, and rest 44% are neutral to
it.
55
L. Rewards and recognition
19. Do you think there should be rewards and recognition programs?
Inference:
Everyone in the organization feel the need of rewards and recognition programs and encourage
that it should be conducted.
100%
0%
Responses
Yes
No
56
20. If yes, then how frequently rewards and recognition programs should be held?
Inference:
 51% of the employee want rewards and recognition programs to be conducted every
quarterly.
 29% of them want organization to conduct every month, 18% respondents want half yearly
and very few people i.e. only 2% want organization to conduct rewards and recognition
programs annually.
29%
51%
18%
2%
Responses
Monthly
Quarterly
Half yearly
Yearly
57
M. Work/life balance; Stress and work place
21. How much do you agree with the following statements?
4 4 2 33 3 3 04
6
2
8
25
19 19
24
30
34
37
30
2 2
5
3
THE ENVIRONMENT IN THIS
ORGANIZATION SUPPORTS
A BALANCE BETWEEN
WORK AND PERSONAL LIFE
I AM ABLE TO SATISFY
BOTH MY JOB AND
FAMILY/PERSONAL
RESPONSIBILITIES
I AM ABLE TO COPE UP
WITH THE PACE (SPEED) OF
THE ORGANIZATION
THE AMOUNT OF WORK I
AM ASKED TO DO IS
REASONABLE AND IT DOES
NOT CAUSE
UNREASONABLE AMOUNTS
OF STRESS IN MY LIFE
Chart Title
Strongly disagree Disagree Somewhat disagree Somewhat agree Agree Strongly Agree
58
Inference:
 From the above analysis it is clear that 44% of the employees agree that environment in
joister supports a balance between their work and personal life, 37% of them somewhat
agree, 3% of them strongly agree with this, 6% of them somewhat disagree, 4% disagree
to it and 6% of them strongly disagree.
 From the above analysis it is clear that 50% of the employees agree that they are able to
satisfy both their personal and job responsibilities, 28% of them somewhat agree, 3% of
them strongly agree with this, 9% of them somewhat disagree, 4% disagree to it and 6% of
them strongly disagree.
 From the above analysis it is clear that 54% of the employees agree that they are able to
cope up with the pace of the organization, 28% of them somewhat agree, 7% of them
strongly agree with this, 3% of them somewhat disagree, 4% disagree to it and 3% of them
strongly disagree.
 From the above analysis it is clear that 44% of the employees agree that they are not
stressed because of their routine work, 35% of them somewhat agree, 4% of them strongly
agree with this, 12% of them somewhat disagree, 4% of them strongly disagree and none
of them disagree to it.
59
N. Fairness
22. How much do you agree with the following statements?
Inference:
 79% of the employees feel that they are treated fairly, while rest 21% feel that they are not
treated fairly.
 82% of the employees feel that organization’s policies for promotion and advancement are
always fairly practiced whereas rest of the 18% feel exact opposite.
 Although 66% of the employees feel that favouritism is not practised in the organization,
whereas 34% of them feel that the organization is biased towards them.
 75% of the employees agree that their reporting manager is not biased, while rest 25% feel
that their reporting manager is biased.
 Overall, employees feel the Joister is fair in its practices.
4 2
9
7
4 4
5
3
6 6
8
7
21
22
21
18
29
31
22
28
4 3 3
5
MY ORGANIZATION TREATS
ALL EMPLOYEES FAIRLY
THE ORGANIZATION’S
POLICIES FOR PROMOTION
AND ADVANCEMENT ARE
ALWAYS FAIR
FAVORITISM IS NOT AN
ISSUE IN RAISES OR
PROMOTIONS
MY REPORTING MANAGER
DOES NOT PRACTICE
FAVORITISM
Chart Title
Strongly disagree Disagree Somewhat disagree Somewhat agree Agree Strongly Agree
60
O. Overall satisfaction
23. Overall, how satisfied are you working for Syscon/Joister?
Table:
Satisfaction Level Responses
Extremely Satisfied 20
Very Satisfied 26
Moderately Satisfied 19
Slightly Satisfied 2
Not at all Satisfied 1
Total 68
29%
38%
28%
3%2%
Responses
Extremely satisfied
Very satisfied
Moderately satisfied
Slightly satisfied
Not at all satisfied
61
Inference:
 Although 29% of the employees have expressed extremely satisfied opinion relating to
the satisfaction level of workings hours of the company, while 38% of them are very
satisfied, 28% are moderately satisfied, while 3% are slightly satisfied and rest 1% are
not at all satisfied to it.
 As satisfaction leads to being motivated, hence the workforce of Joister is motivated.
62
Chapters 5
Conclusions and Recommendations
5.1 Conclusions:
From the above study on “Employees Job Satisfaction” at JIPL. Following conclusion had been
drawn:
1) PERSONAL DETAIL OF EMPLOYEES:
 As Joister is an internet service providing company it has a majority of technical, sales and
operation/implementation department.
 Company has majority of people working at lower level i.e. entry, executive and senior
executive level.
 Joister should form a leadership team as there is no such team in the organization.
 Attrition rate is high in Joister as most of the employees are working for less than 3 years.
2) MISSION AND PURPOSE: Employees working in the organization have a good
understanding on the mission and purpose of the company. In order to achieve
organizational objective, employees demand more training and development to be arrange
for them.
3) POLICY: Joister should not only continue with current working hours, shift timings and
flexible timing policy but also, should ensure that employees are enjoying their vacation
time and paid leaves.
4) OPPORTUNITY FOR CAREER GROWTH/PATH:
 Most of the employees believe that there is good opportunity for growth in Joister and also
expect organization to provide training and development for their improved performance.
 Also they think that unclear career path and lack of training and development hinders their
growth in Joister.
63
5) FAIRNESS: Although most of the employees feel that policies are fair but 20-30% of
employees feel that organization and reporting manager are biased towards them.
6) PERFORMANCE MANAGEMENT SYSTEM: Most of the employees feel that
performance reviews should be conducted every quarterly, 180-degree appraisal method
should be adopted and a goal setting process should be held at the start of the financial year
so that employee can have a clear idea on what aspects their performance will be evaluated.
7) FEEDBACK: Most of the employees feel that they receive fair and regular feedback but
some of them feel demotivated because their contribution is not praised fairly.
8) TEAMWORK: Most of the employees feel that teamwork is valued and practiced in the
organization.
9) COMPENSATION AND BENEFITS: Equal number of the employees responded same for
satisfaction as well as dissatisfaction on their salary, statutory benefits and bonus pay-out.
Most of them are dissatisfied by their incentives and satisfied by their non-statutory
benefits.
10) REWARDS AND RECOGNITION PROGRAMS: Everyone in Joister wants rewards and
recognition programs to be conducted and most of them want it to be held quarterly.
11) WORK/LIFE BALANCE: Most of the employees believe that they have maintained a
balance between their work and personal life.
Overall 96% of the employees are satisfied by the organization. As satisfaction result in
motivation the workforce of organization is motivated towards work.
64
5.2 Recommendations:
 Joister Infomedia should form a proper hierarchical level based on managerial position.
 As attrition rate is high in organization, it should take some rightful action for the same.
Training programs, different engagement activities can be arranged to boost the morale of
employees.
 The organization should make sure that employees get the benefits of their policies. They
should make sure that employees enjoy their paid leaves.
 Employees want organization to conduct training because the feel that lack of training is
making their career growth/path stagnant.
 Organization should make sure that employees immediate supervisors are fair and not
partial while recognizing and rewarding employees for work.
 Rewards and recognition program be given importance in order to motivate employees. As
it has a young workforce, employees are ready to work even if they are provided with less
salary. They are more interested to gain experience and accept challenges.
65
ANNEXURE
A. Questionnaire on Job Satisfaction Level of the Employees
1. Which of the following department do you work in?
 Sales
 Technical department
 Finance/Accounting
 Operations/Implementation
 Marketing
 Human Resource/Administration
 Software Development
 Revenue Assurance
 Others
2. Which of the following is your position/level in Joister?
 Entry level
 Executive
 Senior Executive
 Team leader
 Manager
 Senior Manager
 Leadership Team
3. What is your primary work location?
 Office
 Field staff
66
4. How long have you been associated with Syscon/Joister?
 Less than 6 months
 6 months – 1 year
 1 – 3 years
 3 - 5 years
 More than 5 years
5. What is your age?
 18-21
 22-25
 26-30
 31-35
 36-40
 41-55
 +55 years
6. Mission and purpose
Respondents Strongly
Disagree
Disagree Somewhat
Disagree
Somewhat
agree
Agree Strongly
Agree
I have a good
understanding of
mission and goals of
the company and very
67
well know how my
work contributes to it.
My job is important in
accomplishing the
mission of the
organization
Doing my job well
gives me a sense of
personal satisfaction
7. What do you think can be done to make you feel important/involved in
accomplishing the mission?
 Seminars/workshops on industry related knowledge sharing
 Training and development programs
 Employee engagement activities
 Director's address (CEO meeting employees directly to discuss their
issues and concerns and encouraging them to come up with innovative
ways of doing work)
8. Are you satisfied with the following policies of the company?
Completely
Dissatisfied
Somewhat
dissatisfied
Somewhat
Satisfied
Completely
Satisfied
Working hours
Shift timings
68
Flexible timing policy (no late
marks)
Vacation time I receive and enjoy
Paid leaves I receive and enjoy
9. Do you want any kind of improvement in the policy structure regarding
working hours, attendance, leave policy?
10. Are you satisfied with the following amenities provided by Joister?
Completely
Dissatisfied
Somewhat
dissatisfied
Somewhat
Satisfied
Completely
Satisfied
The work environment (well
maintained, safe, hygienic
and a physically
comfortable)
The pantry facilities and
resources (tea, coffee,
drinking water, microwave
facility etc.)
The work place comfort and
design (furniture, desk
space, A/C cooling, lights
etc.)
69
The work place tools
(hardware, software,
computers)
11. Which amenities do you want Joister to provide you so as to increase your
satisfaction/comfort level?
12. Select the most appropriate option that suits you the most.
Respondents Strongly
Disagree
Disagree Somewhat
Disagree
Somewhat
agree
Agree Strongly
Agree
I receive enough on-the
job training to do my
job well
My manager
encourages, supports
and is actively
interested in my
professional
development and
advancement
My work is
challenging,
stimulating and
rewarding
I am encouraged to
learn from my mistakes
70
I have a clear idea
about my
career/growth path in
Joister
I believe that Joister
can offer me enough
learning opportunity
for career growth
I believe that I am
provided with enough
training and
development
opportunity
I have an access to
learning and
development tools
13. What do you think limits your career path/growth in Joister?
 Monotonous work
 Biased reporting manager
 Lack of training & development
 Unclear career growth/path
 Lack of challenging assignments
 Personal factors
 Your own attitude towards work
71
14. How much do you agree with the following statements?
Respondents Strongly
Disagree
Disagree Somewhat
Disagree
Somewhat
agree
Agree Strongly
agree
My reporting manager
empowers me to
perform at my best
My reporting manager
provides me with
actionable suggestions
to improve myself
My reporting manager
promotes an atmosphere
of teamwork
It is clear to me what my
reporting manager
expects of me regarding
my job performance
My reporting manager
evaluates my work
performance on a
regular basis
My reporting manager
actively listens to my
suggestions/ encourages
72
two-way
communication
When I have questions
or concerns, my
reporting manager is
able to address them
My reporting manager
gets involved in
understanding the base
level issues necessary
for smooth functioning
of department
My reporting manager
lacks in domain
knowledge
My reporting manager is
a motivating leader
15. Do you think there should be a goal setting process conducted at the start of
financial year?
 Yes
 No
73
16. How frequently do you want the performance reviews to be conducted?
 Monthly
 Quarterly
 Six monthly
 Annually
17. Which method do you want Joister to adopt while doing performance
appraisals?
 90 degree appraisals (review by reporting manager)
 180 degree appraisals (review by self and reporting manager)
 360 degree appraisals (review by reporting manager, self, peer group
and subordinates and customer feedback)
18. Please provide suggestions to make performance management system
process better and fair?
19. How much do you agree with the following statements?
Respondents Strongly
Disagree
Disagree Somewhat
Disagree
Somewhat
agree
Agree Strongly
Agree
I receive timely, useful and
constructive feedback
which helps me to improve
my performance
I have an opportunity to
participate in the goal
74
setting process of the
department
When I do a good job, I
receive the praise and
recognition I deserve
I believe that regular
appraisal keeps me
motivated towards my
work
I feel valued at my
workplace and team
I have never received any
appreciation for my
contribution to workplace
20. How often do you think is teamwork practiced in Joister?
Respondents Extremely
often
Very
often
Moderately
often
Slightly
often
Not at all
often
Teamwork is encouraged and
practiced in this organization
There is proactive sharing of tasks
done here
75
21. Are you satisfied with the following parameters?
Respondents Completely
Dissatisfied
Somewhat
Dissatisfied
Neutral Somewhat
Satisfied
Completely
Satisfied
Your salary
Your bonus pay-outs
Statutory benefits offered by
company (PF & ESIC benefits)
Non-statutory benefits offered
by company (medical policy)
Your incentives if any
22. Do you think there should be rewards and recognition programs?
 Yes
 No
23. If yes, then how frequently rewards and recognition programs should be held?
 Monthly
 Quarterly
 Half yearly
 Yearly
24. How much do you agree with the following statement?
Respondents Strongly
Disagree
Disagree Somewhat
Disagree
Somewhat
agree
Agree Strongly
Agree
The environment in this
organization supports a
76
balance between work and
personal life
I am able to satisfy both my
job and family/personal
responsibilities
I am able to cope up with the
pace (speed) of the
organization
The amount of work I am
asked to do is reasonable
and it does not cause
unreasonable amounts of
stress in my life
25. What do you think Joister can do/provide to help you in improving your
work/life balance?
26. How much do you agree with the following statements?
Respondents Strongly
Disagree
Disagree Somewhat
Disagree
Somewhat
Agree
Agree Strongly
Agree
My organization treats all
employees fairly
The organization’s
policies for promotion and
advancement are always
fair
77
Favouritism is not an issue
in raises or promotions
My reporting manager
does not practice
favouritism
27. Overall, how satisfied are you working for Syscon/Joister?
 Extremely satisfied
 Very satisfied
 Moderately satisfied
 Slightly satisfied
 Not at all satisfied
78
B. Bibliography
Websites Referred
 www.joister.net
 http://en.wikipedia/wiki/jobsatisfaction
 https://www.peoplematters.in/news/culture/bad-work-culture-troubles-india-inc-
employees-most-
13543?utm_source=peoplematters&utm_medium=interstitial&utm_campaign=learni
ngs-of-the-day
 https://www.shrm.org/Research/SurveyFindings/Documents/12-
0537%202012_jobsatisfaction_fnl_online.pdf
Books References
1. Research methodology methods & techniques; by C.R Kothari
2. Job satisfaction; by Robert Hoppock
3. C.B Mamoria and S.V. Gankar (2004), Personnel Management Text and Cases.
Himalaya Publication
4. Essentials of Human Resource Management and Industrial Relation – P. Subba
Rao

More Related Content

What's hot

Telecom sector-in-india
Telecom sector-in-indiaTelecom sector-in-india
Telecom sector-in-indiaUpendre Rai
 
Report on telecom sector
Report on telecom sectorReport on telecom sector
Report on telecom sectorsumanmalviya
 
Environmental Analysis of Telecom Company
Environmental Analysis of Telecom CompanyEnvironmental Analysis of Telecom Company
Environmental Analysis of Telecom CompanyShubham Khedekar
 
Swot Analysis Indian Telecom Industry Ppt
Swot Analysis Indian Telecom Industry PptSwot Analysis Indian Telecom Industry Ppt
Swot Analysis Indian Telecom Industry Pptrahulkalra0001
 
PESTLE ANALYSIS ON TELECOM
PESTLE ANALYSIS ON TELECOMPESTLE ANALYSIS ON TELECOM
PESTLE ANALYSIS ON TELECOMBidhan Pradhan
 
Indian telecom industry
Indian telecom industryIndian telecom industry
Indian telecom industryRavindra Kumar
 
INDIAN TELECOM INDUSTRY
INDIAN TELECOM INDUSTRYINDIAN TELECOM INDUSTRY
INDIAN TELECOM INDUSTRYBHOMA RAM
 
Mobile broadband outlook_13_16_73
Mobile broadband outlook_13_16_73Mobile broadband outlook_13_16_73
Mobile broadband outlook_13_16_73domsr
 
Industry analysis of telecom
Industry analysis of telecomIndustry analysis of telecom
Industry analysis of telecomGovinda Rajulu
 
Mark Roettgering’s Presentation at eComm 2009
Mark Roettgering’s Presentation at eComm 2009Mark Roettgering’s Presentation at eComm 2009
Mark Roettgering’s Presentation at eComm 2009eCommConf
 
Indian telecom industry-economics
Indian telecom industry-economicsIndian telecom industry-economics
Indian telecom industry-economicsAjit Kumar
 
Vskills telecom management professional sample material
Vskills telecom management professional sample materialVskills telecom management professional sample material
Vskills telecom management professional sample materialVskills
 
Telecom Industry in India- A Brief Review
Telecom Industry in India- A Brief ReviewTelecom Industry in India- A Brief Review
Telecom Industry in India- A Brief ReviewRashmi Ranjan Moharana
 
Cellular industry
Cellular industryCellular industry
Cellular industry915738
 
Macroeconomic Factors Affecting Telecom Industry
Macroeconomic Factors Affecting Telecom IndustryMacroeconomic Factors Affecting Telecom Industry
Macroeconomic Factors Affecting Telecom IndustryRhishabhJain
 
Recommondation teleco(manufacturing)
Recommondation teleco(manufacturing)Recommondation teleco(manufacturing)
Recommondation teleco(manufacturing)bsmihd
 

What's hot (20)

Telecom sector-in-india
Telecom sector-in-indiaTelecom sector-in-india
Telecom sector-in-india
 
Report on telecom sector
Report on telecom sectorReport on telecom sector
Report on telecom sector
 
Environmental Analysis of Telecom Company
Environmental Analysis of Telecom CompanyEnvironmental Analysis of Telecom Company
Environmental Analysis of Telecom Company
 
Swot Analysis Indian Telecom Industry Ppt
Swot Analysis Indian Telecom Industry PptSwot Analysis Indian Telecom Industry Ppt
Swot Analysis Indian Telecom Industry Ppt
 
PESTLE ANALYSIS ON TELECOM
PESTLE ANALYSIS ON TELECOMPESTLE ANALYSIS ON TELECOM
PESTLE ANALYSIS ON TELECOM
 
Hrm ppt (pestel)
Hrm ppt (pestel)Hrm ppt (pestel)
Hrm ppt (pestel)
 
Telecom Industry
Telecom IndustryTelecom Industry
Telecom Industry
 
Indian telecom industry
Indian telecom industryIndian telecom industry
Indian telecom industry
 
INDIAN TELECOM INDUSTRY
INDIAN TELECOM INDUSTRYINDIAN TELECOM INDUSTRY
INDIAN TELECOM INDUSTRY
 
Mobile broadband outlook_13_16_73
Mobile broadband outlook_13_16_73Mobile broadband outlook_13_16_73
Mobile broadband outlook_13_16_73
 
Industry analysis of telecom
Industry analysis of telecomIndustry analysis of telecom
Industry analysis of telecom
 
Mark Roettgering’s Presentation at eComm 2009
Mark Roettgering’s Presentation at eComm 2009Mark Roettgering’s Presentation at eComm 2009
Mark Roettgering’s Presentation at eComm 2009
 
Indian telecom industry-economics
Indian telecom industry-economicsIndian telecom industry-economics
Indian telecom industry-economics
 
Telecommunication Sector Report - March 2017
Telecommunication Sector Report - March 2017Telecommunication Sector Report - March 2017
Telecommunication Sector Report - March 2017
 
Ibef telecommunications 2010
Ibef telecommunications  2010Ibef telecommunications  2010
Ibef telecommunications 2010
 
Vskills telecom management professional sample material
Vskills telecom management professional sample materialVskills telecom management professional sample material
Vskills telecom management professional sample material
 
Telecom Industry in India- A Brief Review
Telecom Industry in India- A Brief ReviewTelecom Industry in India- A Brief Review
Telecom Industry in India- A Brief Review
 
Cellular industry
Cellular industryCellular industry
Cellular industry
 
Macroeconomic Factors Affecting Telecom Industry
Macroeconomic Factors Affecting Telecom IndustryMacroeconomic Factors Affecting Telecom Industry
Macroeconomic Factors Affecting Telecom Industry
 
Recommondation teleco(manufacturing)
Recommondation teleco(manufacturing)Recommondation teleco(manufacturing)
Recommondation teleco(manufacturing)
 

Viewers also liked

Não quero capuz, protestos..
Não quero capuz, protestos..Não quero capuz, protestos..
Não quero capuz, protestos..Jonas Rigodanzo
 
2011 pl dispõe sobre a identificação de prédios tombados pelo instituto do ...
2011   pl dispõe sobre a identificação de prédios tombados pelo instituto do ...2011   pl dispõe sobre a identificação de prédios tombados pelo instituto do ...
2011 pl dispõe sobre a identificação de prédios tombados pelo instituto do ...drtaylorjr
 
Trabajo de informática
Trabajo de informáticaTrabajo de informática
Trabajo de informáticaPablo_Tualongo
 
2011 solicita ao exmº sr. prefeito municipal o calçamento e a urbanização d...
2011   solicita ao exmº sr. prefeito municipal o calçamento e a urbanização d...2011   solicita ao exmº sr. prefeito municipal o calçamento e a urbanização d...
2011 solicita ao exmº sr. prefeito municipal o calçamento e a urbanização d...drtaylorjr
 
Termodinamica
Termodinamica Termodinamica
Termodinamica rgonz23
 

Viewers also liked (10)

Não quero capuz, protestos..
Não quero capuz, protestos..Não quero capuz, protestos..
Não quero capuz, protestos..
 
Dahab hotels
Dahab hotelsDahab hotels
Dahab hotels
 
Factura-AAA-276-EscSilves_Tito_BCN_Bus2p
Factura-AAA-276-EscSilves_Tito_BCN_Bus2pFactura-AAA-276-EscSilves_Tito_BCN_Bus2p
Factura-AAA-276-EscSilves_Tito_BCN_Bus2p
 
2011 pl dispõe sobre a identificação de prédios tombados pelo instituto do ...
2011   pl dispõe sobre a identificação de prédios tombados pelo instituto do ...2011   pl dispõe sobre a identificação de prédios tombados pelo instituto do ...
2011 pl dispõe sobre a identificação de prédios tombados pelo instituto do ...
 
Trabajo de informática
Trabajo de informáticaTrabajo de informática
Trabajo de informática
 
Poema vento
Poema ventoPoema vento
Poema vento
 
2011 solicita ao exmº sr. prefeito municipal o calçamento e a urbanização d...
2011   solicita ao exmº sr. prefeito municipal o calçamento e a urbanização d...2011   solicita ao exmº sr. prefeito municipal o calçamento e a urbanização d...
2011 solicita ao exmº sr. prefeito municipal o calçamento e a urbanização d...
 
Termodinamica
Termodinamica Termodinamica
Termodinamica
 
Unidad.2.actv.1.syag
Unidad.2.actv.1.syagUnidad.2.actv.1.syag
Unidad.2.actv.1.syag
 
relatorio_niveis_disciplina8d
relatorio_niveis_disciplina8drelatorio_niveis_disciplina8d
relatorio_niveis_disciplina8d
 

Similar to Employee Satisfaction at Joister Infomedia

Indian Telecom Industry & role of HR in it, With emphasis on Airtel
Indian Telecom Industry & role of HR in it, With emphasis on AirtelIndian Telecom Industry & role of HR in it, With emphasis on Airtel
Indian Telecom Industry & role of HR in it, With emphasis on Airtelmini244
 
Telecom industry 27, 28, 63
Telecom industry 27, 28, 63Telecom industry 27, 28, 63
Telecom industry 27, 28, 63domsr
 
Effect of Reliance Jio Promotion activites on Customers.pdf
Effect of Reliance Jio Promotion activites on Customers.pdfEffect of Reliance Jio Promotion activites on Customers.pdf
Effect of Reliance Jio Promotion activites on Customers.pdfNitesh Kumar Mishra
 
Micro economic study of Indian telecom industry
Micro economic study of Indian telecom industryMicro economic study of Indian telecom industry
Micro economic study of Indian telecom industryDipankar Mishra
 
Indian telecom service providers
Indian telecom service providersIndian telecom service providers
Indian telecom service providersPraveen Sidola
 
Telecommunication Industry overview
Telecommunication Industry overviewTelecommunication Industry overview
Telecommunication Industry overviewSiddhartha Ghose
 
Telecommunication Sector:A Prime Driver in Accelarating India's Economic Growth
Telecommunication Sector:A Prime Driver in Accelarating India's Economic GrowthTelecommunication Sector:A Prime Driver in Accelarating India's Economic Growth
Telecommunication Sector:A Prime Driver in Accelarating India's Economic Growthprofessionalpanorama
 
F figure3
F figure3F figure3
F figure3vinuhr
 
Telecommunication sector a prime driver in accelerating india's economic growth
Telecommunication sector a prime driver in accelerating india's economic growthTelecommunication sector a prime driver in accelerating india's economic growth
Telecommunication sector a prime driver in accelerating india's economic growthTapasya123
 
Vodafone idea limited services
Vodafone idea limited servicesVodafone idea limited services
Vodafone idea limited servicesGBCYBER
 
The Effect on the Telecom Industry and Consumers after the Introduction of Re...
The Effect on the Telecom Industry and Consumers after the Introduction of Re...The Effect on the Telecom Industry and Consumers after the Introduction of Re...
The Effect on the Telecom Industry and Consumers after the Introduction of Re...Dr. Amarjeet Singh
 

Similar to Employee Satisfaction at Joister Infomedia (20)

Indian Telecom Industry & role of HR in it, With emphasis on Airtel
Indian Telecom Industry & role of HR in it, With emphasis on AirtelIndian Telecom Industry & role of HR in it, With emphasis on Airtel
Indian Telecom Industry & role of HR in it, With emphasis on Airtel
 
Telecom industry
Telecom industryTelecom industry
Telecom industry
 
A03320108
A03320108A03320108
A03320108
 
Reliance Com project.docx
Reliance Com project.docxReliance Com project.docx
Reliance Com project.docx
 
Cpp report
Cpp reportCpp report
Cpp report
 
Cpp report
Cpp reportCpp report
Cpp report
 
Chiranth project
Chiranth projectChiranth project
Chiranth project
 
Telecom industry 27, 28, 63
Telecom industry 27, 28, 63Telecom industry 27, 28, 63
Telecom industry 27, 28, 63
 
Effect of Reliance Jio Promotion activites on Customers.pdf
Effect of Reliance Jio Promotion activites on Customers.pdfEffect of Reliance Jio Promotion activites on Customers.pdf
Effect of Reliance Jio Promotion activites on Customers.pdf
 
Micro economic study of Indian telecom industry
Micro economic study of Indian telecom industryMicro economic study of Indian telecom industry
Micro economic study of Indian telecom industry
 
Indian telecom service providers
Indian telecom service providersIndian telecom service providers
Indian telecom service providers
 
Telecommunication Industry overview
Telecommunication Industry overviewTelecommunication Industry overview
Telecommunication Industry overview
 
Introduction
IntroductionIntroduction
Introduction
 
Telecommunication Sector:A Prime Driver in Accelarating India's Economic Growth
Telecommunication Sector:A Prime Driver in Accelarating India's Economic GrowthTelecommunication Sector:A Prime Driver in Accelarating India's Economic Growth
Telecommunication Sector:A Prime Driver in Accelarating India's Economic Growth
 
F figure3
F figure3F figure3
F figure3
 
Telecommunication sector a prime driver in accelerating india's economic growth
Telecommunication sector a prime driver in accelerating india's economic growthTelecommunication sector a prime driver in accelerating india's economic growth
Telecommunication sector a prime driver in accelerating india's economic growth
 
Tata Docomo Report
Tata Docomo ReportTata Docomo Report
Tata Docomo Report
 
Vodafone idea limited services
Vodafone idea limited servicesVodafone idea limited services
Vodafone idea limited services
 
The Effect on the Telecom Industry and Consumers after the Introduction of Re...
The Effect on the Telecom Industry and Consumers after the Introduction of Re...The Effect on the Telecom Industry and Consumers after the Introduction of Re...
The Effect on the Telecom Industry and Consumers after the Introduction of Re...
 
Telecommunication 2
Telecommunication 2Telecommunication 2
Telecommunication 2
 

Employee Satisfaction at Joister Infomedia

  • 1. 1 Chapter 1 Executive Summary: The report encompasses the summer internship project undertaken with JOISTER INFOMEDIA PVT. LTD. under the guidance of Mrs. Vaishali, HR manager of Joister Infomedia Pvt. Ltd. as a part of summer internship project. The report gives the details of what has been done during the two months of the Summer Internship Project. It also gives a brief about JOISTER INFOMEDIA PVT. LTD. This project gave a great learning experience and at the same time it gave enough scope to implement analytical ability. The project report shows the satisfaction of the employees in the organization. This project as a whole can be divided into two parts. The first part gives an insight about the company profile, objective of the study, research methodology. One can have a brief knowledge about the Telecommunication Industry and its basics through the project. The second part of the project consist of data and its analysis collected through survey. For the collection of primary data, structured questionnaire was prepared and a survey of employees was made at Joister Infomedia Pvt. Ltd. The main objective of the project report was to analyse the employee satisfaction working in the organization which was observed by doing the survey of employees. It gives a conclusion to the study with the help of different diagrams and bar charts. The most important learning from this project was to understand how to interact with different kind of people, deal and react at different situations. This project covers the topic “Job satisfaction of the employees at JOISTER INFOMEDIA PVT. LTD.” The data collected has been well organized and presented.
  • 2. 2 Chapter 2 Introduction 2.1 Introduction to Industry: Telecom-industry The telecom industry has been divided into two major segments, that is, fixed and wireless cellular services. In today’s information age, the telecommunication industry has a vital role to play. Considered as the backbone of industrial and economic development, the industry has been aiding delivery of voice and data services at rapidly increasing speeds, and thus, has been revolutionising human communication. Although the Indian telecom industry is one of the fastest-growing industries in the world, the current tele density or telecom penetration is extremely low when compared with global standards. India’s tele density of 36.98% in FY09 is amongst the lowest in the world. Further, the urban tele density is over 80%, while rural tele density is less than 20%, and this gap is increasing. As majority of the population resides in rural areas, it is important that the government takes steps to improve rural tele density. No doubt the government has taken certain policy initiatives, which include the creation of the Universal Service Obligation Fund, for improving rural telephony. These measures are expected to improve the rural tele-density and bridge the rural-urban gap in tele-density
  • 3. 3
  • 4. 4 2.1.1 Current Status Globalisation has made telecommunication an integral part of the infrastructure of the Indian economy. The telecom sector in India has developed as a result of progressive regulatory regime. According to the TRAI, the total gross revenue of the Indian telecom services industry was Rupees 1,524 billion in FY09 up from Rupees 1,291 billion in FY08 registering a growth of 18.03% over FY08 and its subscriber base grew by 43% over FY08 to touch 429.70 million subscribers in FY09. The telecom sector in India experienced a rapid growth over the past decade on account of regulatory liberalisation, structural reforms and competition, making telecom one of the major catalysts in India’s growth story. However, much of this growth can be attributed to the unprecedented growth in mobile telephony as the number of mobile subscribers grew at an astounding rate from 10 million in 2002 to 392 million in 2009. Besides, the growth in the service and IT and IT sector also increased the prominence of the telecom industry in India. Telecom has emerged as a key infrastructure for economic and consumer growth because of its multiplier effect and the fact that it is beneficial to trade in other industries. The contribution of the sector to GDP
  • 5. 5 has been increasing gradually (its contribution in GDP has more than doubled to 2.83% in FY07 from 1.0% in FY92). Telecom is one of the fastest-growing industries in India; on an average the industry added 8 million wireless subscribers every month in FY08. The government had set a target of 500 million telecom connections by 2010. However, according to the TRAI, the total subscriber base (wireless and wireline) in the industry crossed the 500-mn-mark and reached 509.03 million by the end of September 2009, which took India to the second position in terms of wireless network in the world next only to China. Prior to liberalisation, the telecom sector was monopolised by the public sector and recorded marginal growth; in fact, during 1948-1998, the incremental tele density in the country was just 1.92%. However, the introduction of NTP’99 accelerated the growth of the sector and the tele density increased from 2.33 in 1999 to 36.98 in 2009; however, much of this growth was brought about by the NTP-99 policy changes such as migration from fixed license fee to revenue sharing regime and cost-oriented telecom tariffs. From 2003 onwards the government has taken certain initiatives such as unified access licensing regime, reduced access deficit, introduction of calling party pays (CPP) and revenue sharing regime in ADC that has provided further impetus to the sector. The Indian telecom industry is characterised with intense competition, and continuous price wars. Currently, there are around a dozen telecom service providers who operate in the wired and wireless segment. The government has been periodically implementing suitable fiscal and promotional policies to boost domestic demand and to create volumes for the industry. The Indian telecom industry has immense growth potential as the tele density in the country is just 36 as compared with 60 in the US, 102 in the UK and 58 in Canada. The wireless segment growth has played a dominant role in taking the tele density to the current levels. In the next few years, the industry is poised to grow further, in fact, it has already entered a consolidation phase as foreign players are struggling to acquire a pie in this dynamic industry.
  • 6. 6 2.1.2 Role in India’s Development Contribution to GDP According to the UNCTAD, there is a direct correlation between the growth in mobile tele density and the growth in GDP per capita in developing countries, which tend to have a high percentage of rural population. The share of the telecom services industry in the total GDP has been rising over the past few years (the telecom sector contribution in GDP went up from 2.52% in FY05 to 2.83% in FY07).  Employment The Indian telecommunication industry employs over 400,000 direct employees and about 85% of these employees are from government-owned companies. The ratio of number of subscribers to employees, an indication of efficiency and profitability, is much higher for private companies than for government companies.
  • 7. 7  Foreign Direct Investment (FDI) Foreign direct investment has been one of the major contributors in the growth of the Indian economy, and therefore, the need for higher FDI is felt across sectors in the Indian economy. The telecom sector has played a crucial role in attracting FDI in India. The share of telecom sector in the total FDI inflows in India has gone up to 10% in FY09 as compared with just 3% in FY05. The telecom sector requires huge investments for its expansion as it is capital-intensive and FDI plays a vital role in meeting the fund requirements for expansion of the telecom sector. Telecom accounts for almost 10% of the total FDI inflows in the country and has been the third-largest sector to attract FDI in India in the post-liberalisation era The Indian telecom industry has been an attractive avenue for foreign investors over the years. As per DIPP figures, the cumulative FDI inflow during August 1991 to June 2009 period, in the
  • 8. 8 telecommunication sector amounted to US$ 113 bn. FDI calculation takes into account radio paging, cellular mobile and basic telephone services in the telecommunication sector. In the 2004-05 Budget, the government raised the FDI limit from 49% to 74% in the telecom services segment subject to retention of local management control. According to the new norms, 26% share out of the 74% should be held by an Indian company or an Indian citizen with Indian management. Further, 100% FDI is permitted in telecom manufacturing, category I infrastructure providers, ISPs without gateway, call centres and IT-enabled services. Further, direct or indirect FDI up to 74% is permitted subject to licensing and security requirements for ISPs with gateways, radio paging operators and category II infrastructure providers. The relaxation in FDI norms has attracted many foreign telecom majors to the sector. The presence of foreign players has not only encouraged faster infrastructure development and upgradation but also has opened up the domestic industry to foreign competition. Since 2004, there has been a large inflow of FDI in the sector. During 2004-05 and 2005-06, a period during which the FDI norms were relaxed, the FDI inflow grew by an astounding 300% to US$ 624 million in 2005-06 from merely US$ 125 million in 2004-05. The inflow of FDI has provided tremendous impetus to the sector in the past few years and the attractiveness of the sector has kept the FDI inflows growing steadily. During FY09 the FDI in the telecom sector at US$ 2,558 million was 103% higher than that seen in FY08 at US$ 1,261 million. Further, the FDI in the sector has already reached US$ 2010 million for a six-month period of FY10 (Apr-Sep 09) and is expected to surpass the total FDI for FY09. The government’s liberalised FDI policies have resulted in several foreign companies entering into the Indian markets. The influx of foreign players in the Indian telecom industry has led to capacity creation, and better infrastructure, which in turn has bettered the network quality. The rise in FDI has also enabled technology transfer, market access and has improved organisational skills; going forward, FDI could be used for providing telecom services to rural areas, where tele density is still very low. The change in FDI policy that has raised the FDI limit from 49% to 74% for the sector has made it more attractive for foreign players. In the long run the growth prospects of telecom players that have foreign partners will improve and other players will get new avenues to raise capital.
  • 9. 9  Growth of IT-ITS and Financial Sector India has entered the league of countries with the most-advanced telecommunication infrastructure after the industry was deregulated. Furthermore, deregulation has stimulated India’s economic growth through industry growth and through rise in investments. It is evident that a well-developed communication sector improves access to social networks, lowers transaction costs, increases economic opportunities, widens markets, and provides better access to information, healthcare and educational services. The growth in Indian telecom sector has been concomitant with overall growth in GDP, government revenue, employment et al. Besides, telecommunication has increased efficiency, reduced transaction costs, attracted investments and has created new opportunities for business and employment. The NTP-99 was particularly helpful for the ITS-BPO industry as it ended the government monopoly in international calling by introducing IP telephony. After the introduction of IP telephony, there was rapid growth in the number of data processing centres and inbound/outbound call centres, which ultimately led to the outsourcing revolution in India. The telecom sector has been instrumental in creating jobs for a vast pool of talented and knowledge professionals in the IT and ITS-BPO industry, which thrives on reliable telecommunication infrastructure. India has become an important outsourcing destination for the world and the boom in this sector also has transformed India’s economic dynamics. The evolution of telecom sector has brought about a revolutionary change in the way some businesses operate. Another beneficiary of the telecom revolution is the financial services industry, which has been on a growth trajectory. The progress and quality of the financial sector has been a key factor that has driven the pace and diversity of the real economy. India has an extensive and well-developed financial sector with wide and sophisticated banking network. Banking in India has become service-oriented, and has matured greatly from the days of walk-in customers to the present situation when banks have migrated to a 24-hour banking platform to attract customers; however, this disintermediation in the business has led banks to be extremely prudent in terms of their internal operations and has led them to adopt newer products and delivery channels. Further, with introduction of internet & mobile banking the long ques at the banks are slowly becoming a thing of the past. Both the financial and the IT-ITS segments rely on good domestic as well as international network connectivity; therefore, there is a need for a sound telecommunication network.
  • 10. 10 Factors Facilitating Growth of the Sector The phenomenal growth in the Indian telecom industry was brought about by the wireless revolution that began in the nineties. Besides this, the following factors also aided the growth of the industry. 1. Liberalization The relaxation of telecom regulations has played a major role in the development of the Indian telecom industry. The liberalisation policies of 1991 and the consequent influx of private players have led the industry on a high growth trajectory and have increased the level of competition. Post- liberalisation, the telecom industry has received more investments and has implemented higher technology. 2. Increasing Affordability of Handsets The phenomenal growth in the Indian telecom industry was predominantly aided by the meteoric rise in wireless subscribers, which encouraged mobile handset manufacturers to enter the market and to cater to the growing demand. Further, the manufacturers introduced lower-priced handsets with add-on facilities to cater to the increasing number of subscribers from different strata of the society. Now even entry-level handsets come with features like coloured display and FM radio. Thus, the falling handset prices and the add-on features have triggered growth of the Indian telecom industry. 3. Prepaid Cards Bring in More Subscribers In the late nineties, India was introduced to prepaid cards, which was yet another milestone for the wireless sector. Prepaid cards lured more subscribers into the industry besides lowering the credit risk of service providers due to its upfront payment concept. Prepaid cards were quite a phenomenon among first-time users who wanted to control their bills and students who had limited resources but greater need to be connected. Pre-paid cards greatly helped the cellular market to grow rapidly and cater to the untapped market. Further, the introduction of innovative schemes like recharge coupons of smaller denominations and life time incoming free cards has led to an exponential growth in the subscriber base. 4. Introduction of Calling Party Pays (CPP) The CPP regime was introduced in India in 2003 and under this regime, the calling party who initiated the call was to bear the entire cost of the call. This regime came to be applicable for mobile
  • 11. 11 to mobile calls as well as fixed line to mobile calls. So far India had followed the Receiving Party Pays (RPP) system where the subscriber used to pay for incoming calls from both mobile as well as fixed line networks. Shifting to the CPP system has greatly fuelled the subscriber growth in the sector. 5. Changing Demographic Profile The changing demographic profile of India has also played an important role in subscriber growth. The changed profile is characterised by a large young population, a burgeoning middle class with growing disposable income, urbanisation, increasing literacy levels and higher adaptability to technology. These new features have multiplied the need to be connected always and to own a wireless phone and therefore, in present times mobiles are perceived as a utility rather than a luxury. 6. Increased Competition & Declining Tariffs Liberalisation of the telecom industry has fuelled intense competition, especially in the cellular segment. The ever-increasing competition has led to high growth of subscribers and has put pressure on tariffs, which have seen a sharp drop over the years. When the cellular phones were introduced, call rates were at a peak of Rupees 16 per minute and there were charges for incoming calls too. Today, however, incoming calls are no longer charged and outgoing calls are charged at less than a rupee per minute. Thus, the tariff war has come a long way indeed. Increased competition and the subsequent tariff war has acted as a major catalyst for attracting more subscribers. Apart from these major growth drivers, an improved network coverage, entry of CDMA players, growth of value-added services (VAS), advancement in technology, and growing data services have also driven the growth of the industry.
  • 12. 12 2.1.3 Outlook The telecom industry in India has experienced exponential growth over the past few years and has been an important contributor to economic growth; however, the cut-throat competition and intense tariff wars have had a negative impact on the revenue of players. Despite the challenges, the Indian telecom industry will thrive because of the immense potential in terms of new users. India is one of the most-attractive telecom markets because it is still one of the lowest penetrated markets. The government is keen on developing rural telecom infrastructure and is also set to roll out next generation or 3G services in the country. Operators are on an expansion mode and are investing heavily on telecom infrastructure. Foreign telecom companies are acquiring considerable stakes in Indian companies. Burgeoning middle class and increasing spending power, the government’s thrust on increasing rural telecom coverage, favourable investment climate and positive reforms will ensure that India’s high potential is indeed realised.
  • 13. 13 2.2 Introduction to the Company: About Company Joister is a technology driven company. Here we crave for giving the ultimate in service. Be it simple home based Internet solutions or a highly reliable, secure leased line connectivity. Joister provides you with Wired & wireless broadband Solutions for both single as well as multiple users. We surpass other internet service providers by delivering high speed internet service that is 10 times faster than the speeds of dialup connections! Whether you're looking for faster downloads, streaming audio & video content, you've come to the right place. Joister is an ISO 9001: 2008 Certified Company At Joister we adhere to strict code called "PREFS". Which is translates into Partners, Reliable, Efficient, Flexible and Secure Partners - When you sign up with us we end up as partners in growth, which will definitely prove to be valuable in the long run. TAG LINE: Connecting everyone and everything.  Partners - When you sign up with us we end up as partners in growth, which will definitely prove to be valuable in the long run.  Reliable - We go for the best in technology with a no compromise attitude. You can simply rely on us.  Efficient - Efficiency is the key to success. We are always there for our customers in time of their needs. We have tailor made programs to suit any of our customer's requirements.  Flexible - We believe in adapting to the need of the hour. Innovation is our mantra. Our solutions are custom based. Joister Broadband is a category 'A' ISP and ISO accredited broadband service provider. One of the leading independent ISPs in India
  • 14. 14 Infrastructure Joister has over 600 kms of optic fibre cable in operational cities facilitates world-class service delivery to its customers. Joister has expanded and invested over 10 million on broadband cable infrastructure across all operational cities. Vision Our vision is to be a leading Broadband and IT services company, offering innovative products and solutions to home, enterprise and other customers in India and globally. We believe that our next generation services will change the way we live, think, communicate and we believe that we can make a significant contribution towards a powerful Broadband enabled India. History The beauty of the human mind is that it is forever curious, 'Good' is never enough. It has an unquenchable thirst to learn, to ideate and to innovate. But the Founders of Joister are one of those rare few who directed their curiosity to find solutions that make a difference. The success of Joister parent company, Syscon Infoway Pvt. Ltd. was not enough for them. We wanted to do more. We knew that though the internet was enabling people to do great things, there was scope for more, a lot more. '' A lot more'' was the genesis of Joister. A company that would create products and services which would make the internet experience simpler, faster and better! And staying true to its promises, Joister has already created products and services like super-fast broadband, online gaming servers and email services that have greatly enhanced the internet experience for everyday users. And many more are in the offing. In just a short span of time, Joister already has a list of blockbuster products and a team of some of the best industry professionals. With Team Joister, you can be rest assured that they will not stop, not at 'good', not at 'better' but only at the 'best'! Enjoy Joister!!! Mission To be the online brand specialist, that delivers not just effective solutions but a complete brand experience. And at the same time, maximizing ROI through measurable results: higher sales and better brand equity!
  • 15. 15 Simplicity No matter how advanced technology becomes, ultimately, its simplicity matters to the end-user. Therefore, we focus on building products that are easy-to-use and user-friendly. The needs that the product serves might be diverse and complex yet the interface has to be SIMPLE!!! Effective innovation Innovations that are simply different don't always work. We focus on ''Effective Innovations'' i.e. Innovations that serve a purpose, satisfy a need. We innovate to make things easier, simpler and better! Brand Partners not just clients The client is always right except that we don't call them that. We call them, ''Brand Partners''. Brand Building is a bit like living, it's not an assignment, it's a 24/7 obsession. One needs to live and ideate every moment! And one can't do that for clients, one can only do that for partners, Brand Partners. Measurable Results We design innovations keeping in mind the brand partner's most basic need i.e. to sell! We deliver solutions that maximize reach at minimal costs! Every penny counts, it is directly proportional to the results! Not "Yes Men" We are honest, straight forward and sometimes even blunt but the last one is only for the benefit of our Brand Partners. We will disagree with you if we believe an idea doesn't work. Our aim is to use our experience to tell you what's right for the brand. We are not ''Yes Men''. And neither should we be, you pay us to build brands. And not to say only ''Yes''.
  • 16. 16 WHAT IS JOISTER BROADBAND? Joister is an ISO 9001: 2008 Certified Company that provides Wired & Wireless Broadband Solutions for both single as well as multiple users. We surpass other internet service providers by delivering high speed internet service that is 10 times faster than the speeds of dialup connections! Whether you’re looking for faster downloads, streaming audio & video content, you've come to the right place. WHAT IS BROADBAND? Broadband is an always-on-internet connection that can provide download speeds from minimum of 256 kilobits per second (kbps). WHAT ARE THE ADVANTAGES OF BROADBAND? Broadband allows you to gain superior internet experience as compared to any dial-up internet connection. This helps your tasks of downloading or uploading large-sized files or multimedia content web pages much faster and saves your valuable time. WHAT ARE THE POSSIBLE BROADBAND APPLICATIONS? Broadband can be used for applications like online banking, travel ticketing, stock trading, video chat over the Internet, Voice-over IP (VoIP) or downloading multimedia content like music, movies and games to name a few. WHY PREFER JOISTER BROADBAND OVER OTHERS?  Joister Broadband offers high-speed data transfer  Multi redundant Bandwidth Network -Trans Atlantic/Pacific and NIXI  TRULY Unlimited Data Transfer - No stars or strings attached  On-call Tech support  Joister is one of the first private ISP to announce 16 & 25 Mbps unlimited plans  Joister provides you top of it class fibre optic - in Mumbai, Maharashtra & Goa  Number of internet based services like: Video on Demand, Bandwidth on Demand, Video conferencing, Interactive Gaming and several other Value-Added-Services.
  • 17. 17 2.3 Introduction to Subject: Human resource management: Human resource management is comparatively new and rapidly growing profession in India. Human Resource Management has been recognised as a profession by academicians and industrialists because it has acquired all the qualification of a profession and has proved its worth. It is the process of acquiring, training, training, appraising, and compensating employees, and of attending to their labour relations, health and safety, & fairness concerns. HRM is also management function concerned with hiring, motivating, and maintaining people in an organization. It focuses on people in the organization. Human resource management is service industry has now become necessity and it has to achieve effective utilization of human resource, desirable working relationship among all employees, maximum employee development, high moral in the organization and continuous development and appreciation of human assets. The productivity of the organization depends significantly on employee job satisfaction. It not only influences the maximum work force but greatly improves the sense of morale and commitment towards the organization amongst the employees. Conducive work environment is the one that gives workers a sense of pride in what they do. However, employer that implement monetary as well as non-monetary initiatives to increase employee satisfaction definitely reap the benefit of reducing lethargy, absenteeism, and lower employee turnover rates with greater organizational citizenship behaviour and commitments. In order to meet the commitment of the employee’s job satisfaction, the organization supposes to apply HRM theory into practices. According to the theoretical evidence on relationship of HR practice with the organizational effective indicates that HR practice influence employee commitment and other HR performance measure, which then lead to organization effectiveness. Several elaborations of HRM have been studied in the previously research such as Bradley, Petrescu and Simmons (2004) give the term of HRM practice as define the following set of variables: work organization, supervision, employee involvement/voice, recruitment and selection, training and learning, pay practices. Along the same line Pfeiffer (1994) identify the HRM practices such as employment security, selectivity in recruiting, high wages, incentive pay,
  • 18. 18 employee ownership, participation and empowerment, promotion from within, training, and skill development. In addition, Delerly and Doty (1996) utilize the seven variables of HRM practices which are internal career opportunities, formal training system, appraisal measures, profit sharing, employment security, employee voice mechanism, and job design. Job Satisfaction: According to Nancy C. Morse (1997) “Satisfaction refers to the level of fulfilment of one’s needs, wants and desire. Satisfaction depends basically upon what an individual wants from the world, and what he gets.” Employee satisfaction is a measure of how happy workers are with their job and working environment. It is sure that there may be many factors affecting the organizational effectiveness and one of them is the employee satisfaction. Effective organizations should have a culture that encourages the employee satisfaction, Bhatti & Qureshi, (2007) Employees are more loyal and productive when they are satisfied Hunter & Tietyen, (1997), and these satisfied employees affect the customer satisfaction and organizational productivity, Potter field, (1999). There is no limit for the employees to reach the full satisfaction and it may vary from employee to employee. Sometimes they need to change their behaviours in order to execute their duties more effectively to gain greater job satisfaction, Miller, (2006). Having good relationships with the colleagues, high salary, good working conditions, training and education opportunities, career developments or any other benefits may be related with the increasing of employee satisfaction. Employee satisfaction is the terminology used to describe whether employees are happy, contended and fulfilling their desires and needs at work. Many measures support that employee satisfaction is a factor in employee motivation, employee goal achievement and positive employee morale in the work place. ‟ Susan M. Heath field (About.Com). Cranny, Smith & stone (1992) defined ES as the combination of affective reactions to the differential perceptions of what he/she wants to receive compared with he/she actually receives. According to Moyes, Shao & Newsome (2008) the employee satisfaction may be described as how pleased an employee is with his or her position of employment. As Spector (1997) defined job satisfaction as all the feelings that a given individual has about his/her job and its various aspects. Employee satisfaction is a comprehensive term that comprises job satisfaction of employees and their satisfaction overall with companies‟ policies, company environment etc.
  • 19. 19 Employee satisfaction is the terminology used to describe whether employees are happy and contented and fulfilling their desires and needs at work. Many measures meaning that employee satisfaction is a factor in employee motivation, employee goal achievement, and positive employee morale in the workplace. As per Vroom “Employee Satisfaction is a positive orientation of an individual towards a work role which he is presently occupying” Employee satisfaction is a measure of how happy workers are with their job and working environment. Keeping morale high among workers can be of tremendous benefit to any company, as happy workers will be more likely to produce more, take fewer days off, and stay loyal to the company. There are many factors in improving or maintaining high employee satisfaction, which wise employers would do well to implement. Employee satisfaction, while generally a positive in organization, can also be a bad luck if mediocre employees stay because they are satisfied with your work environment. Many experts believe that one of the best ways to maintain employee satisfaction is to make workers feel like part of a family or team. Holding office events, such as parties or group outings, can help build close bonds among workers. Many companies also participate in team-building retreats that are designed to strengthen the working relationship of the employees in a non-work related setting. Camping trips, paintball wars and guided backpacking trips are versions of this type of team- building strategy, with which many employers have found success. Of course, few workers will not experience a boost in morale after receiving more money. Raises and bonuses can seriously affect employee satisfaction, and should be given when possible. Yet money cannot solve all morale issues, and if a company with widespread problems for workers cannot improve their overall environment, a bonus may be quickly forgotten as the daily stress of an unpleasant job continues to mount. If possible, provide amenities to your workers to improve morale. Make certain they have a comfortable, clean break room with basic necessities such as running water. Keep facilities such as bathrooms clean and stocked with supplies. While an air of professionalism is necessary for most businesses, allowing workers to keep family photos or small trinkets on their desk can make them feel more comfortable and nested at their workstation. Basic considerations like these can improve employee satisfaction, as workers will feel well cared for by their employers. The backbone of employee satisfaction is respect for workers and the job they perform. In every interaction with management, employees should be treated with courtesy and interest. An easy avenue for employees to discuss problems with upper management should be maintained and carefully monitored. Even if management cannot meet all the demands of employees, showing
  • 20. 20 workers that they are being heard and putting honest dedication into compromising will often help to improve morale. Satisfaction = f (what employee expects, what he gets, time, back ground of the employee- social, economic, cultural) Satisfaction being a continuous process starts from the day 1 and gets reinforced with time depending on the importance of the various factors considered to be important for the individual employee. Loyalty towards the organization starts to develop when the employee continues to get the positive reinforcements on various important aspects for the duration of the employment. Employee satisfaction has been defined as a function of perceived performance and expectations. It is a persons’ feeling of pleasure or disappointment resulting from comparing a products’ outcome to his/her expectations. If the performance falls short of expectations, the employee is dissatisfied and if it matches the expectations, the employee is satisfied. A high satisfaction implies improvement in efficiency and performance doing work or service. The process is however, more complicated then it appears. It is more important for any organization to offer high satisfaction, as it reflects high loyalty and it will not lead to switching over once a better offer comes in.
  • 21. 21 2.4 Introduction to Project: Employee satisfaction has been defined as a function of perceived performance and expectations. It is a persons’ feeling of pleasure or disappointment resulting from comparing a products’ outcome to his/her expectations. If the performance falls short of expectations, the employee is dissatisfied and if it matches the expectations, the employee is satisfied. A high satisfaction implies improvement in efficiency and performance doing work or service. The process is however, more complicated then it appears. It is more important for any organization to offer high satisfaction, as it reflects high loyalty and it will not lead to switching over once a better offer comes in. Research employees differently described the factors contributing to job satisfaction and job dissatisfaction. The survey made regarding the job satisfaction in Joister Infomedia Pvt. Ltd. Will facilitate and enables the management to know the perceptions and inner feelings regarding the job they are performing on day-to-day basis. The term job satisfaction reveals and focuses on the likes and dislikes of the employees of JIPL. In this particular study, effort was made to identify the causes for satisfaction and dissatisfaction among the employees. So this is the most effective and selective instrument for diagnosing and peeping into the employee’s problems. Job satisfaction survey can give the most valuable information the perceptions and causes. For satisfaction/dissatisfaction among the employee attitude towards job satisfaction may be either positive or negative. With the objective to study the satisfaction level of employees in the organization a group of 68 employees of Joister Infomedia Pvt. Ltd. was selected and interviewed to gather responses to a structured questionnaire dealing with various aspects of job satisfaction. The data gathered was analysed and the results are provided in the analysis and findings.
  • 22. 22 After the detailed study of this research work, following points has been drawn: - 1) Attrition rate is quite high in Telecom Industry 2) There is a high need and demand of training and development in telecom industry, technology keeps changing and updating. Hence, to achieve competitive advantage, one needs to be updated.
  • 23. 23 Literature Review ‘Bad work culture troubles India Inc. employees the most’ Unclear growth path, reporting to the bad managers, no access to learning & development tools are making India Inc employees jittery, finds the Times Jobs Survey. Unclear growth path, reporting to the bad managers, and lack of recognition, no access to learning and development tools to upgrade skillsets are troubling India Inc. employees the most. Nearly 50% Indian employees cite bad work culture as the most worrisome workplace elements at their organizations. This was revealed in a Times Jobs Survey done on more than 1000 professionals across different sectors. Shedding more light on overall state of work culture in India Inc., 52% employees rated their workplace as ‘bad’ while only 20% rated it as “good”. The remaining 28% employees felt that their company is working towards building a strong work culture. "An engaged and motivated workforce is crucial in today's hypercompetitive environment to ensure success. So a dissatisfied employee is a liability that no organization can afford. With the advent of multiple engagement platforms such as webinars, R&Rs, AMAs, TJ Social Connect, JobBuzz and TechGig.com organizations need only chose the most suitable tools to create an atmosphere of positivity and productivity within their workforce." Says Nilanjan Roy, Head of Strategy, Times Business Solutions. About half of surveyed respondents (47%) said they were unclear about career growth path in their organizations. Among the dissatisfied lot, nearly 60% employees felt that their workplace offered limited opportunities for career growth. And about 30% said a bad boss or reporting manager was the most unpleasant thing to face at the workplace. More than half of the employees who said they are unhappy with their reporting manager also stated unclear vision of the manager as the most annoying trait which hindered their growth, followed by favouritism (30%), rigidity (25%) and lack of domain knowledge (11%). Nearly 22% of the surveyed employees said they felt a lack of learning and development opportunities and almost 70% of these stated they have no access whatsoever to learning and development tools to upgrade and upskill themselves. Another 16% were upset about the lack of recognition at their workplace.
  • 24. 24 On further probing what limited their career growth, 68% employees cited external factors while 32% blamed their personal reasons. Among external factors, 35% attributed it to monotonous work and lack of challenging assignments. While about 33% felt biased a reporting manager limited their career growth. Of those who cited personal reasons as the biggest roadblock to career growth, nearly 20% blamed it on deteriorating skills sets and 12% on their own attitude towards work. Of the employees who raised concerns about the lack of recognition at the workplace, 70% said they don’t feel valued at work. In fact, 30% claimed they have never been appreciated for their contribution to the workplace while 50% said they are appreciated only sometimes. Sadly, of those who said they have never been appreciated, 35% have spent 2-5 years at their current organizations. https://www.peoplematters.in/news/culture/bad-work-culture-troubles-india-inc-employees-most- 13543?utm_source=peoplematters&utm_medium=interstitial&utm_campaign=learnings-of-the-day
  • 25. 25 Project details 3.1 Objectives of the Research:  To identify the level of job satisfaction of employees in the organization
  • 26. 26 3.2Research Methodology: 1. Primary Data:  The source of data collection was a questionnaire (for the primary data). The data was collected by using a structured questionnaire as well as interviewing the representatives from the employees. 2. Secondary Data:  The secondary data was collected from the organizations manuals, company’s website, books and brochures. For theoretical overview various books on HR policies were consulted. Internet has played a major role in finding facts related to the study of the project.
  • 27. 27 3.3 Sample size: The data was collected from sixty-eight employees. 3.4Limitation of the Project: 1. Time Bound: The research was conducted within a short period of time. Therefore, it may not represent a true picture. 2. Particular to one Organization: The research is limited only to one organization. Therefore, no comment can be made regarding the whole industry. 3. Sampling Error: Workers were busy with their routine work and in the middle of their work the questionnaire was circulated. So there is a possibility that they did not respond to the questions properly.
  • 28. 28 Chapter 4 Analysis & Findings: A. Personal details 1. Which of the following department do you work in? Table: Department Responses Sales 15 Technical 19 Finance/Accounting 5 Operation/Implementation 15 Marketing 2 HR/Administration 3 Software Development 0 Revenue Assurance 6 Others 3 Total 68
  • 29. 29 Inference:  About 28% respondents are from technical department, 22% are from sales department, 8% are from finance/accounting department, 22% are from operations/implementation, 3% respondents are from marketing department, 4% were from HR/administration department, 9% from revenue assurance and 4% of employees are working in others department includes peons, clerk, administrator etc.  Since it’s an internet service providing company there is a majority of technical, sales and operation/implementation department. Sales 22% Technical 28% Finance/Accounting 8% Operations/Impleme ntation 22% Marketing 3% HR/Administration 4% Revenue Assurance 9% Others 4% Personal Details Sales Technical Finance/Accounting Operations/Implementation Marketing HR/Administration Software Development Revenue Assurance Others
  • 30. 30 2. Which of the following is your position in Joister? Table: Position/level Responses Entry Level 5 Executive 19 Senior Executive 16 Team Leader 3 Manager 19 Senior Manager 4 Leadership Team 0 Total 68 Graph: 7% 28% 27% 4% 28% 6% Position/level Entry level Executive Senior executive Team leader Manager Senior manager Leadership team
  • 31. 31 Inference:  Majority i.e. 28% of employee are of executive and managerial level.  Company has majority of people working at lower level i.e. entry, executive and senior executive level.  Joister should form a leadership team as there is no such hierarchy in the organization.
  • 32. 32 3. What is your primary work location? Primary work location Responses Office 47 Field Staff 21 Inference:  69% of the total employees have their primary work location as office.  31% of the total employees have their primary work location as field staff. 69% 31% Primary work location Office Field staff
  • 33. 33 4. How long have you been associated with Joister/Syscon? Table: Tenure Responses Less than 6 months 9 6 months – 1 year 8 1 – 3 years 38 3 - 5 years 10 More than 5 years 3 Total 68 Graph: Inference: From the above table and graph it is evident 81 % of employees in Joister are working for not more than 3 years, that means attrition rate is quite high in the company. 13% 12% 56% 15% 4% Responses Less than 6 months 6 months – 1 year 1 – 3 years 3 - 5 years More than 5 years
  • 34. 34 5. What is your age? Table: Age Responses 18-22 2 22-25 15 26-30 18 31-35 19 36-40 9 41-55 5 More than 55 years 0 Total 68 Inference: Most of the employees i.e.79% belong to the age group of 18-35 which means the company has a young workforce. 3% 22% 27% 28% 13% 7% Age 18-21 22-25 26-30 31-35 36-40 41-55 more than 55 years
  • 35. 35 B. Mission and purpose 6. Select the most suitable option. Table: Respondents Strongl y Disagre e Disagre e Somewhat Disagree Somewhat agree Agree Strongl y Agree To tal I have a good understanding of mission and goals of the company and very well know how my work contributes to it. 9 3 11 38 7 68 My job is important in accomplishing the mission of the organization 10 2 4 43 9 68 Doing my job well gives me a sense of personal satisfaction 9 1 3 6 42 7 68
  • 36. 36 Inference:  Approximately 82% of employees have a good understanding of mission.  Approximately 82% of employees feel that their job is important in accomplishing the mission of the company.  80% of employees feel their job gives them a sense of satisfaction.  So it can be concluded that employees working in the organization have a good understanding of mission and purpose of the company 9 10 10 1 11 4 63 2 3 38 43 42 7 9 7 I HAVE A GOOD UNDERSTANDING OF MISSION AND GOALS OF THE COMPANY AND VERY WELL KNOW HOW MY WORK CONTRIBUTES TO IT MY JOB IS IMPORTANT IN ACCOMPLISHING THE MISSION OF THE ORGANISATION DOING MY JOB WELL GIVES ME A SENSE OF PERSONAL SATISFACTION Chart Title Strongly disagree Disagree Somewhat agree Somewhat disagree Agree Strongly agree
  • 37. 37 7. What do you think can be done to make you feel important/involved in accomplishing the mission? Inference:  Most of the employees want Joister to conduct training and development programs followed by employee engagement activities, seminars/workshops on industry related knowledge sharing and then meeting with CEO to make them feel important. 35 50 40 31 0 10 20 30 40 50 60 SEMINARS/WORKSHOPS ON INDUSTRY RELATED KNOWLEDGE SHARING TRAINING AND DEVELOPMENT PROGRAMS EMPLOYEE ENGAGEMENT ACTIVITIES DIRECTOR'S ADDRESS(CEO MEETING EMPLOYEES DIRECTLY TO DISCUSS THEIR ISSUES AND CONCERNS AND ENCOURAGING THEM TO COME UP WITH… Responses Responses
  • 38. 38 C. Policies 8. Are you satisfied with the following policies of the company? Table: Completely Dissatisfied Somewhat dissatisfied Somewhat Satisfied Completely Satisfied Total Working hours 1 11 18 38 68 Shift timings 3 8 18 39 68 Flexible timing policy (no late marks) 3 2 17 46 68 Vacation time I receive and enjoy 6 12 19 31 68 Paid leaves I receive and enjoy 9 9 18 32 68
  • 39. 39 Inference:  Although 18% of the employees have expressed completely dissatisfied or somewhat dissatisfied opinion relating to the satisfaction level of workings hours of the company, while 80% of them are satisfied with it.  Although 12% of the employees have expressed completely dissatisfied or somewhat dissatisfied opinion relating to the satisfaction level of shift timings of the company, while 88% of them are satisfied with the same.  93% of the employees are satisfied with the flexible timing policy followed by the Joister whereas hardly 7% of employees are dissatisfied by it.  27% of the employees are dissatisfied by the vacation time and paid leaves. They might not be getting the permission to take those benefits because of work pressure, whereas there are 73% of employees who feel satisfied by the benefits they get. 1 3 3 6 9 11 8 2 12 9 18 18 17 19 18 38 39 46 31 32 WORKING HOURS SHIFT TIMINGS FLEXIBLE TIMING POLICY(NO LATE MARKS) VACATION TIME I RECEIVE AND ENJOY PAID LEAVES I RECEIVE AND ENJOY Chart Title Completely Dissatisfied Somewhat dissatisfied Somewhat Satisfied Completely Satisfied
  • 40. 40 D. Work environment(amenities) 9. Are you satisfied with the following amenities provided by Joister? Inference:  94% i.e. 64 number of the employees are satisfied with their working environment while just 6% i.e. 4 are dissatisfied.  72% i.e. 49 number of the employees are satisfied with the pantry facility whereas 17% i.e. 12 feel completely dissatisfied.  Although 16% i.e. 11 number of employees are dissatisfied by the work place comfort majority i.e. 84% i.e. 57 are satisfied with it.  Although 18% i.e. 12 number of the employees have expressed completely dissatisfied or somewhat dissatisfied opinion relating to the satisfaction level of workings hours of the company, while 80% i.e. 54 of them are satisfied with it. 1 12 4 53 7 7 9 21 20 17 21 43 29 40 33 THE WORK ENVIRONMENT(WELL MAINTAINED, SAFE, HYGIENIC AND A PHYSICALLY COMFORTABLE) THE PANTRY FACILITIES AND RESOURCES(TEA, COFFEE, DRINKING WATER, MICROWAVE FACILITY ETC) THE WORK PLACE COMFORT AND DESIGN(FURNITURE, DESK SPACE, A/C COOLING, LIGHTS ETC) THE WORK PLACE TOOLS (HARDWARE, SOFTWARE, COMPUTERS) Chart Title Completely Dissatisfied Somewhat dissatisfied Somewhat Satisfied Completely Satisfied
  • 41. 41 E. Opportunities for growth 10. How much do you agree with the following statements? Inference:  84% of the employees agree that they receive enough on-the job training.  94% of the employees agree that their manager is encouraging, supporting to them and also encourages them to learn from mistakes.  Majority of the employees agree that their work challenging, stimulating and rewarding and they have clear idea of career path/growth in Joister. They also believe that Joister can offer enough training to achieve career growth.  Most of the employees agree that they are provided training and development opportunity and have an access to learning and development tools. 2 1 0 1 1 2 3 24 1 1 1 1 1 4 35 3 1 0 3 1 6 2 23 16 15 16 14 14 21 22 32 42 46 44 44 48 31 35 2 5 5 6 5 2 3 4 Chart Title Strongly disagree Disagree Somewhat disagree Somewhat agree Agree Strongly Agree
  • 42. 42 F. Career path/growth: 11. What do you think limits your career path/growth in Joister? Inference: Most of the employees believe that lack of training & development, unclear growth path, monotonous work and personal factors limits their career path/growth in the organization, others think that biased reporting manager and their own attitude hinders their career growth/path. 15 9 29 18 7 14 9 0 5 10 15 20 25 30 35 MONOTONOUS WORK BIASED REPORTING MANAGER LACK OF TRAINING & DEVELOPMENT UNCLEAR CAREER GROWTH/PATH LACK OF CHALLENGING ASSIGNMENTS PERSONAL FACTORS YOUR OWN ATTITUDE TOWARDS WORK Responses Responses
  • 43. 43 G. Communication and relationship with reporting manager 12. How much do you agree with the following statements? 0 0 0 0 0 0 0 0 18 01 1 1 1 1 2 2 1 11 11 2 3 4 1 0 3 8 2 13 14 11 9 12 11 9 10 12 8 47 45 47 46 43 43 45 45 17 48 7 7 7 9 8 11 12 9 2 9 Chart Title Strongly disagree Disagree Somewhat disagree Somewhat agree Agree Strongly Agree
  • 44. 44 Inference:  From the above analysis it is clear that 69% of the employees agree that their reporting manager empowers them to perform best, 19% of them somewhat agree, 10% of them strongly agree with this, and none of them strongly disagree.  From the above analysis it is clear that 66% of the employees agree that their reporting manager provides me with actionable suggestions to improve themselves, 21% of them somewhat agree, 10% of them strongly agree with this, 4% of them somewhat disagree to it and none of them strongly disagree.  From the above analysis it is clear that 69% of the employees agree that their reporting manager promotes an atmosphere of teamwork, 16% of them somewhat agree, 10% of them strongly agree with this, 3% of them somewhat disagree with this, 1% of them disagree to it and none of them strongly disagree.  From the above analysis it is clear that 68% of the employees agree that they have a clear idea of what their reporting manager expects from them, 13% of them somewhat agree, 13% of them strongly agree with this, 3% of them somewhat disagree, 1% disagree to it and none of them strongly disagree.  From the above analysis it is clear that 63% of the employees agree that their reporting manager evaluates their performance regularly, 18% of them somewhat agree, 12% of them strongly agree with this, 6% of them somewhat disagree, 1% disagree to it and none of them strongly agree.  From the above analysis it is clear that 63% of the employees agree that their reporting manager actively listens to their suggestions/encourages two-way communication, 16% of them somewhat agree, 16% of them strongly agree with this, 1% of them somewhat disagree, 3% disagree to it and none of them strongly agree.  From the above analysis it is clear that 66% of the employees agree that their reporting manager addresses to their concerns, 13% of them somewhat agree, 18% of them strongly agree with this, 3% disagree to it and none of them strongly agree.  From the above analysis it is clear that 66% of the employees agree that their reporting manager gets involved in understanding base level issues necessary for smooth functioning
  • 45. 45 of department, 15% of them somewhat agree, 13% of them strongly agree with this, 4% of them somewhat disagree, 1% disagree to it and none of them strongly agree.  From the above analysis it is clear that 25% of the employees agree that their reporting manager lacks in domain knowledge, 18% of them somewhat agree, 3% of them strongly agree with this, 12% of them somewhat disagree, 16% disagree to it and 26% strongly agree.  From the above analysis it is clear that 71% of the employees agree that their reporting manager is a motivating leader, 12% of them somewhat agree, 13% of them strongly agree with this, 3% of them somewhat disagree, 1% disagree to it and none of them strongly agree.
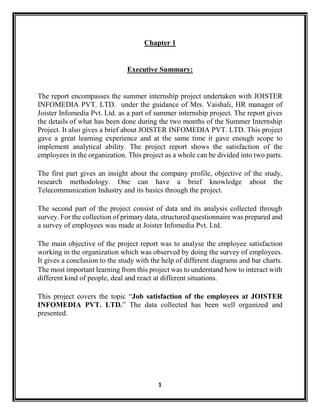
  • 46. 46 H. Performance management system 13. Do you think there should be a goal setting process conducted at the start of financial year? Responses Yes 65 No 3 Total 68 Inference: From the above table and graph it is evident that almost everyone in the organization want that there should be a goal setting process at the start of the financial year. 95% 5% Responses Yes No
  • 47. 47 14. How frequently do you want the performance reviews to be conducted? Inference:  51% of the employee want performance reviews to be conducted every quarterly.  25% of them want organization to conduct every six monthly, 22% monthly and very few people i.e. only 2% want organization to conduct performance reviews annually. 22% 51% 25% 2% Resonses Monthly Quarterly Six monthly Annually
  • 48. 48 15. Which method do you want Joister to adopt while doing performance appraisals? Table: Method Responses 90 degree appraisals (review by reporting manager) 10 180 degree appraisals (review by self and reporting manager) 56 360 degree appraisals (review by reporting manger, self, peer group and subordinates and customer feedback) 2 Total 68 15% 82% 3% Responses 90 degree appraisals (review by reporting manager) 180 degree appraisals (review by self and reporting manager) 360 degree appraisals(review by reporting manager, self, peer group and subordinates and customer feedback)
  • 49. 49 Inference:  Although 15% and 3% employees want Joister to adopt 90-degree appraisal and 360 degree appraisals.  Whereas 82% of them want Joister to adopt 180 degrees as a method of doing performance appraisals
  • 50. 50 I. Feedback 16. How much do you agree with the following statements? 1 1 0 0 1 10 3 2 3 0 1 15 3 5 4 2 5 8 18 21 19 4 18 18 41 36 38 44 40 16 2 3 4 8 3 1 I RECEIVE TIMELY, USEFUL AND CONSTRUCTIVE FEEDBACK WHICH HELPS ME TO IMPROVE MY PERFORMANCE I HAVE AN OPPORTUNITY TO PARTICIPATE IN THE GOAL SETTING PROCESS OF THE DEPARTMENT WHEN I DO A GOOD JOB, I RECEIVE THE PRAISE AND RECOGNITION I DESERVE I BELIEVE THAT REGULAR APPRAISAL KEEPS ME MOTIVATED TOWARDS MY WORK I FEEL VALUED AT MY WORKPLACE AND TEAM I HAVE NEVER RECEIVED ANY APPRECIATION FOR MY CONTRIBUTION TO WORKPLACE Chart Title Strongly disagree Disagree Somewhat disagree Somewhat agree Agree Strongly Agree
  • 51. 51 Inference:  From the above analysis it is clear that 60% of the employees agree that they receive timely, useful and constructive feedback which helps them to improve their performance, 26% of them somewhat agree, 3% of them strongly agree with this, 4% of them somewhat disagree, 4% disagree to it and 1% of them strongly disagree.  From the above analysis it is clear that 53% of the employees agree that they have an opportunity to participate in the goal setting process of the department, 31% of them somewhat agree, 4% of them strongly agree with this, 7% of them somewhat disagree, 3% disagree to it and 1% of them strongly disagree.  From the above analysis it is clear that 56% of the employees agree that when the do a good job they are praised and recognised accordingly, 28% of them somewhat agree, 6% of them strongly agree with this, 6% of them somewhat disagree, 4% disagree to it and none of them strongly disagree.  From the above analysis it is clear that 65% of the employees agree that they believe that regular appraisal keeps them motivated towards their work, 6% of them somewhat agree, 12% of them strongly agree with this, 3% of them somewhat disagree, none of them neither disagree or strongly disagree.  From the above analysis it is clear that 59% of the employees agree that they feel valued at their work place, 26% of them somewhat agree, 4% of them strongly agree with this, 7% of them somewhat disagree, 1% disagree to it and 1% of them strongly disagree.  From the above analysis it is clear that 24% of the employees agree that they have never received any appreciation for their contribution to workplace, 26% of them somewhat agree, 12% of them somewhat disagree, 22% disagree to it and 15% of them strongly disagree and none of them strongly agree with this.
  • 52. 52 J. Teamwork 17. How often do you think is teamwork practiced in Joister? Inference:  Although 38% of the employees have expressed very often opinion relating to the fact of how often teamwork is encouraged in the company, while 29%, 18%, 9%, and 6% of them feel teamwork is extremely often, moderately often, slightly often and not at all often opinion respectively.  Although 37% of the employees have expressed very often opinion relating to the fact of how often there is a proactive sharing in the company, while 26%, 22%, 9%, and 6% of them feel teamwork is extremely often, moderately often, slightly often and not at all often opinion respectively. 20 18 26 25 12 15 6 6 4 4 TEAMWORK IS ENCOURAGED AND PRACTICED IN THIS ORGANIZATION THERE IS PROACTIVE SHARING OF TASKS DONE HERE Chart Title Extremely often Very often Moderately often Slightly often Not at all often
  • 53. 53 K. Benefits 18. Are you satisfied with the following parameters? 10 9 2 3 14 16 12 2 6 6 20 26 30 29 30 20 15 21 20 11 2 6 13 10 7 YOUR SALARY YOUR BONUS PAYOUT STATUTORY BENEFITS OFFERED BY COMPANY (PF & ESIC BENEFITS) NON-STATUTORY BENEFITS OFFERED BY COMPANY (MEDICAL POLICY) YOUR INCENTIVES IF ANY Chart Title Completely Dissatisfied Somewhat Dissatisfied Neutral Somewhat Satisfied Completely Satisfied
  • 54. 54 Inference:  Although 38% of the employees have expressed completely dissatisfied or somewhat dissatisfied opinion relating to the satisfaction level of their salary, while 32% of them are completely satisfied or somewhat with, and rest 30% are neutral to it.  Although 31% of the employees have expressed completely dissatisfied or somewhat dissatisfied opinion relating to the satisfaction level of their bonus pay-outs, while 31% of them are completely satisfied or somewhat with, and rest 38% are neutral to it.  Although 6% of the employees have expressed completely dissatisfied or somewhat dissatisfied opinion relating to the satisfaction level of statutory benefits offered by the company, while 50% of them are completely satisfied or somewhat with, and rest 44% are neutral to it.  Although 13% of the employees have expressed completely dissatisfied or somewhat dissatisfied opinion relating to the satisfaction level of non-statutory benefits offered by the company, while 44% of them are completely satisfied or somewhat with, and rest 43% are neutral to it.  Although 30% of the employees have expressed completely dissatisfied or somewhat dissatisfied opinion relating to the satisfaction level of incentives offered by the company, while 26% of them are completely satisfied or somewhat with, and rest 44% are neutral to it.
  • 55. 55 L. Rewards and recognition 19. Do you think there should be rewards and recognition programs? Inference: Everyone in the organization feel the need of rewards and recognition programs and encourage that it should be conducted. 100% 0% Responses Yes No
  • 56. 56 20. If yes, then how frequently rewards and recognition programs should be held? Inference:  51% of the employee want rewards and recognition programs to be conducted every quarterly.  29% of them want organization to conduct every month, 18% respondents want half yearly and very few people i.e. only 2% want organization to conduct rewards and recognition programs annually. 29% 51% 18% 2% Responses Monthly Quarterly Half yearly Yearly
  • 57. 57 M. Work/life balance; Stress and work place 21. How much do you agree with the following statements? 4 4 2 33 3 3 04 6 2 8 25 19 19 24 30 34 37 30 2 2 5 3 THE ENVIRONMENT IN THIS ORGANIZATION SUPPORTS A BALANCE BETWEEN WORK AND PERSONAL LIFE I AM ABLE TO SATISFY BOTH MY JOB AND FAMILY/PERSONAL RESPONSIBILITIES I AM ABLE TO COPE UP WITH THE PACE (SPEED) OF THE ORGANIZATION THE AMOUNT OF WORK I AM ASKED TO DO IS REASONABLE AND IT DOES NOT CAUSE UNREASONABLE AMOUNTS OF STRESS IN MY LIFE Chart Title Strongly disagree Disagree Somewhat disagree Somewhat agree Agree Strongly Agree
  • 58. 58 Inference:  From the above analysis it is clear that 44% of the employees agree that environment in joister supports a balance between their work and personal life, 37% of them somewhat agree, 3% of them strongly agree with this, 6% of them somewhat disagree, 4% disagree to it and 6% of them strongly disagree.  From the above analysis it is clear that 50% of the employees agree that they are able to satisfy both their personal and job responsibilities, 28% of them somewhat agree, 3% of them strongly agree with this, 9% of them somewhat disagree, 4% disagree to it and 6% of them strongly disagree.  From the above analysis it is clear that 54% of the employees agree that they are able to cope up with the pace of the organization, 28% of them somewhat agree, 7% of them strongly agree with this, 3% of them somewhat disagree, 4% disagree to it and 3% of them strongly disagree.  From the above analysis it is clear that 44% of the employees agree that they are not stressed because of their routine work, 35% of them somewhat agree, 4% of them strongly agree with this, 12% of them somewhat disagree, 4% of them strongly disagree and none of them disagree to it.
  • 59. 59 N. Fairness 22. How much do you agree with the following statements? Inference:  79% of the employees feel that they are treated fairly, while rest 21% feel that they are not treated fairly.  82% of the employees feel that organization’s policies for promotion and advancement are always fairly practiced whereas rest of the 18% feel exact opposite.  Although 66% of the employees feel that favouritism is not practised in the organization, whereas 34% of them feel that the organization is biased towards them.  75% of the employees agree that their reporting manager is not biased, while rest 25% feel that their reporting manager is biased.  Overall, employees feel the Joister is fair in its practices. 4 2 9 7 4 4 5 3 6 6 8 7 21 22 21 18 29 31 22 28 4 3 3 5 MY ORGANIZATION TREATS ALL EMPLOYEES FAIRLY THE ORGANIZATION’S POLICIES FOR PROMOTION AND ADVANCEMENT ARE ALWAYS FAIR FAVORITISM IS NOT AN ISSUE IN RAISES OR PROMOTIONS MY REPORTING MANAGER DOES NOT PRACTICE FAVORITISM Chart Title Strongly disagree Disagree Somewhat disagree Somewhat agree Agree Strongly Agree
  • 60. 60 O. Overall satisfaction 23. Overall, how satisfied are you working for Syscon/Joister? Table: Satisfaction Level Responses Extremely Satisfied 20 Very Satisfied 26 Moderately Satisfied 19 Slightly Satisfied 2 Not at all Satisfied 1 Total 68 29% 38% 28% 3%2% Responses Extremely satisfied Very satisfied Moderately satisfied Slightly satisfied Not at all satisfied
  • 61. 61 Inference:  Although 29% of the employees have expressed extremely satisfied opinion relating to the satisfaction level of workings hours of the company, while 38% of them are very satisfied, 28% are moderately satisfied, while 3% are slightly satisfied and rest 1% are not at all satisfied to it.  As satisfaction leads to being motivated, hence the workforce of Joister is motivated.
  • 62. 62 Chapters 5 Conclusions and Recommendations 5.1 Conclusions: From the above study on “Employees Job Satisfaction” at JIPL. Following conclusion had been drawn: 1) PERSONAL DETAIL OF EMPLOYEES:  As Joister is an internet service providing company it has a majority of technical, sales and operation/implementation department.  Company has majority of people working at lower level i.e. entry, executive and senior executive level.  Joister should form a leadership team as there is no such team in the organization.  Attrition rate is high in Joister as most of the employees are working for less than 3 years. 2) MISSION AND PURPOSE: Employees working in the organization have a good understanding on the mission and purpose of the company. In order to achieve organizational objective, employees demand more training and development to be arrange for them. 3) POLICY: Joister should not only continue with current working hours, shift timings and flexible timing policy but also, should ensure that employees are enjoying their vacation time and paid leaves. 4) OPPORTUNITY FOR CAREER GROWTH/PATH:  Most of the employees believe that there is good opportunity for growth in Joister and also expect organization to provide training and development for their improved performance.  Also they think that unclear career path and lack of training and development hinders their growth in Joister.
  • 63. 63 5) FAIRNESS: Although most of the employees feel that policies are fair but 20-30% of employees feel that organization and reporting manager are biased towards them. 6) PERFORMANCE MANAGEMENT SYSTEM: Most of the employees feel that performance reviews should be conducted every quarterly, 180-degree appraisal method should be adopted and a goal setting process should be held at the start of the financial year so that employee can have a clear idea on what aspects their performance will be evaluated. 7) FEEDBACK: Most of the employees feel that they receive fair and regular feedback but some of them feel demotivated because their contribution is not praised fairly. 8) TEAMWORK: Most of the employees feel that teamwork is valued and practiced in the organization. 9) COMPENSATION AND BENEFITS: Equal number of the employees responded same for satisfaction as well as dissatisfaction on their salary, statutory benefits and bonus pay-out. Most of them are dissatisfied by their incentives and satisfied by their non-statutory benefits. 10) REWARDS AND RECOGNITION PROGRAMS: Everyone in Joister wants rewards and recognition programs to be conducted and most of them want it to be held quarterly. 11) WORK/LIFE BALANCE: Most of the employees believe that they have maintained a balance between their work and personal life. Overall 96% of the employees are satisfied by the organization. As satisfaction result in motivation the workforce of organization is motivated towards work.
  • 64. 64 5.2 Recommendations:  Joister Infomedia should form a proper hierarchical level based on managerial position.  As attrition rate is high in organization, it should take some rightful action for the same. Training programs, different engagement activities can be arranged to boost the morale of employees.  The organization should make sure that employees get the benefits of their policies. They should make sure that employees enjoy their paid leaves.  Employees want organization to conduct training because the feel that lack of training is making their career growth/path stagnant.  Organization should make sure that employees immediate supervisors are fair and not partial while recognizing and rewarding employees for work.  Rewards and recognition program be given importance in order to motivate employees. As it has a young workforce, employees are ready to work even if they are provided with less salary. They are more interested to gain experience and accept challenges.
  • 65. 65 ANNEXURE A. Questionnaire on Job Satisfaction Level of the Employees 1. Which of the following department do you work in?  Sales  Technical department  Finance/Accounting  Operations/Implementation  Marketing  Human Resource/Administration  Software Development  Revenue Assurance  Others 2. Which of the following is your position/level in Joister?  Entry level  Executive  Senior Executive  Team leader  Manager  Senior Manager  Leadership Team 3. What is your primary work location?  Office  Field staff
  • 66. 66 4. How long have you been associated with Syscon/Joister?  Less than 6 months  6 months – 1 year  1 – 3 years  3 - 5 years  More than 5 years 5. What is your age?  18-21  22-25  26-30  31-35  36-40  41-55  +55 years 6. Mission and purpose Respondents Strongly Disagree Disagree Somewhat Disagree Somewhat agree Agree Strongly Agree I have a good understanding of mission and goals of the company and very
  • 67. 67 well know how my work contributes to it. My job is important in accomplishing the mission of the organization Doing my job well gives me a sense of personal satisfaction 7. What do you think can be done to make you feel important/involved in accomplishing the mission?  Seminars/workshops on industry related knowledge sharing  Training and development programs  Employee engagement activities  Director's address (CEO meeting employees directly to discuss their issues and concerns and encouraging them to come up with innovative ways of doing work) 8. Are you satisfied with the following policies of the company? Completely Dissatisfied Somewhat dissatisfied Somewhat Satisfied Completely Satisfied Working hours Shift timings
  • 68. 68 Flexible timing policy (no late marks) Vacation time I receive and enjoy Paid leaves I receive and enjoy 9. Do you want any kind of improvement in the policy structure regarding working hours, attendance, leave policy? 10. Are you satisfied with the following amenities provided by Joister? Completely Dissatisfied Somewhat dissatisfied Somewhat Satisfied Completely Satisfied The work environment (well maintained, safe, hygienic and a physically comfortable) The pantry facilities and resources (tea, coffee, drinking water, microwave facility etc.) The work place comfort and design (furniture, desk space, A/C cooling, lights etc.)
  • 69. 69 The work place tools (hardware, software, computers) 11. Which amenities do you want Joister to provide you so as to increase your satisfaction/comfort level? 12. Select the most appropriate option that suits you the most. Respondents Strongly Disagree Disagree Somewhat Disagree Somewhat agree Agree Strongly Agree I receive enough on-the job training to do my job well My manager encourages, supports and is actively interested in my professional development and advancement My work is challenging, stimulating and rewarding I am encouraged to learn from my mistakes
  • 70. 70 I have a clear idea about my career/growth path in Joister I believe that Joister can offer me enough learning opportunity for career growth I believe that I am provided with enough training and development opportunity I have an access to learning and development tools 13. What do you think limits your career path/growth in Joister?  Monotonous work  Biased reporting manager  Lack of training & development  Unclear career growth/path  Lack of challenging assignments  Personal factors  Your own attitude towards work
  • 71. 71 14. How much do you agree with the following statements? Respondents Strongly Disagree Disagree Somewhat Disagree Somewhat agree Agree Strongly agree My reporting manager empowers me to perform at my best My reporting manager provides me with actionable suggestions to improve myself My reporting manager promotes an atmosphere of teamwork It is clear to me what my reporting manager expects of me regarding my job performance My reporting manager evaluates my work performance on a regular basis My reporting manager actively listens to my suggestions/ encourages
  • 72. 72 two-way communication When I have questions or concerns, my reporting manager is able to address them My reporting manager gets involved in understanding the base level issues necessary for smooth functioning of department My reporting manager lacks in domain knowledge My reporting manager is a motivating leader 15. Do you think there should be a goal setting process conducted at the start of financial year?  Yes  No
  • 73. 73 16. How frequently do you want the performance reviews to be conducted?  Monthly  Quarterly  Six monthly  Annually 17. Which method do you want Joister to adopt while doing performance appraisals?  90 degree appraisals (review by reporting manager)  180 degree appraisals (review by self and reporting manager)  360 degree appraisals (review by reporting manager, self, peer group and subordinates and customer feedback) 18. Please provide suggestions to make performance management system process better and fair? 19. How much do you agree with the following statements? Respondents Strongly Disagree Disagree Somewhat Disagree Somewhat agree Agree Strongly Agree I receive timely, useful and constructive feedback which helps me to improve my performance I have an opportunity to participate in the goal
  • 74. 74 setting process of the department When I do a good job, I receive the praise and recognition I deserve I believe that regular appraisal keeps me motivated towards my work I feel valued at my workplace and team I have never received any appreciation for my contribution to workplace 20. How often do you think is teamwork practiced in Joister? Respondents Extremely often Very often Moderately often Slightly often Not at all often Teamwork is encouraged and practiced in this organization There is proactive sharing of tasks done here
  • 75. 75 21. Are you satisfied with the following parameters? Respondents Completely Dissatisfied Somewhat Dissatisfied Neutral Somewhat Satisfied Completely Satisfied Your salary Your bonus pay-outs Statutory benefits offered by company (PF & ESIC benefits) Non-statutory benefits offered by company (medical policy) Your incentives if any 22. Do you think there should be rewards and recognition programs?  Yes  No 23. If yes, then how frequently rewards and recognition programs should be held?  Monthly  Quarterly  Half yearly  Yearly 24. How much do you agree with the following statement? Respondents Strongly Disagree Disagree Somewhat Disagree Somewhat agree Agree Strongly Agree The environment in this organization supports a
  • 76. 76 balance between work and personal life I am able to satisfy both my job and family/personal responsibilities I am able to cope up with the pace (speed) of the organization The amount of work I am asked to do is reasonable and it does not cause unreasonable amounts of stress in my life 25. What do you think Joister can do/provide to help you in improving your work/life balance? 26. How much do you agree with the following statements? Respondents Strongly Disagree Disagree Somewhat Disagree Somewhat Agree Agree Strongly Agree My organization treats all employees fairly The organization’s policies for promotion and advancement are always fair
  • 77. 77 Favouritism is not an issue in raises or promotions My reporting manager does not practice favouritism 27. Overall, how satisfied are you working for Syscon/Joister?  Extremely satisfied  Very satisfied  Moderately satisfied  Slightly satisfied  Not at all satisfied
  • 78. 78 B. Bibliography Websites Referred  www.joister.net  http://en.wikipedia/wiki/jobsatisfaction  https://www.peoplematters.in/news/culture/bad-work-culture-troubles-india-inc- employees-most- 13543?utm_source=peoplematters&utm_medium=interstitial&utm_campaign=learni ngs-of-the-day  https://www.shrm.org/Research/SurveyFindings/Documents/12- 0537%202012_jobsatisfaction_fnl_online.pdf Books References 1. Research methodology methods & techniques; by C.R Kothari 2. Job satisfaction; by Robert Hoppock 3. C.B Mamoria and S.V. Gankar (2004), Personnel Management Text and Cases. Himalaya Publication 4. Essentials of Human Resource Management and Industrial Relation – P. Subba Rao