More Related Content
More from joseleorcasita (20)
Daily livestock report dec 19 2012
- 1. Vol. 10, No. 244 December 19, 2012
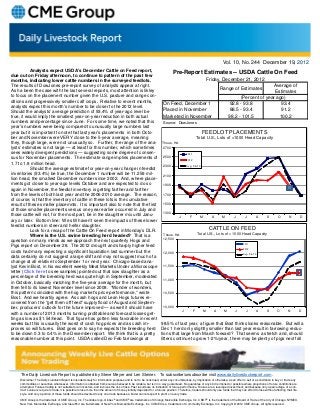
Analysts expect USDA’s December Cattle on Feed report,
due out on Friday afternoon, to continue to pattern of the past few
Pre-Report Estimates -- USDA Cattle On Feed
months, indicating lower cattle numbers in the surveyed feedlots. Friday, December 21, 2012
The results of DowJones pre-report survey of analysts appear at right. Average of
As ha been the case with the last several reports, most attention is likley
Range of Estimates
Estimates
to focus on the placement number given the U.S. pasture and range con- (Percent of year ago)
ditions and progressively smaller calf crops. Relative to recent months,
analysts expect this month’s number to be closer to the 2012 level.
On Feed, December 1 92.8 - 93.8 93.4
Should the analysts’ average prediction of 93.4% of year-ago level be Placed in November 88.5 - 93.4 91.2
true, it would imply the smallest year-on-year reduction in both actual Marketed in November 98.2 - 101.5 100.2
numbers and percentage since June. For some time, we noted that this Source: DowJones
year’s numbers were being compared to unusually large numbers last
year but it is important to note that last year’s placements in both Octo- FEEDLOT PLACEMENTS
ber and November were VERY close to the 5-year average, meaning Total U.S., Lots of >1000 Head Capacity
they, though large, were not unusually so. Further, the range of the ana- Thous. Hd.
lysts’ estimates is not large — at least for this number, which sometimes 2700
sees widely divergent predictions — suggesting some degree of consen- 2011
sus for November placements. The estimate range implies placements of 2500
2012
1.7 to 1.8 million head. Avg. '06-'10
2300
Should the average estimate for year-on-year change in feedlot
inventories (93.4%) be true, the December 1 number will be 11.259 mil- 2100
lion head, the smallest December number since 2002. And, where place-
ments got closer to year-ago levels October and are expected to do so 1900
again in November, the feedlot inventory is getting farther and farther
from the levels of both last year and the 2006-2010 average. The reason, 1700
of course, is that the inventory of cattle in these lots is the cumulative
result of these smaller placemnts. It is important also to note that the first 1500
of those smaller placements versus one year earlier occurred in July and
1300
those cattle will not, for the most part, be in the slaughter mix until Janu- J F M A M J J A S O N D
ary or later. Bottom line: We still haven’t seen the impacts of these lower
feedlot numbers in steer and heifer slaughter.
Look for a recap of the Cattle On Feed report in Monday’s DLR. CATTLE ON FEED
Thous. Hd. Total U.S., Lots of > 1000 Head Capacity
Where is the U.S. swine breeding herd headed? That is a
12,500
question on many minds as we approach the next quarterly Hogs and
2011
Pigs report on December 28. The 2012 drought and sharply higher feed
2012
costs had many expecting a significant liquidation last summer but the 12,000 Avg. '06-'10
data certainly do not suggest a large shift and may not suggest much of a
change at all relative to September 1 or next year. Chicago-based ana-
lyst Kevin Bost, in his excellent weekly Meat Markets Under a Microscope 11,500
letter (Click here to see samples) pointed out that sow slaughter as a
percentage of the breeding herd was quite high in September, moderated
11,000
in October, basically matching the five-year average for the month, but
then fell to its lowest November level since 2008. “Wonder of wonders,
this pattern coincided with the hog market’s price performance,” wrote 10,500
Bost. And we heartily agree. As cash hogs and Lean Hogs futures re-
covered from the “get them off feed” supply flood of August and Septem-
ber, producers’ outlook for the future improved — as well it should have 10,000
J F M A M J J A S O N D
with a number of 2013 months turning profitable and forecast losses get-
ting as low as $1.54/head. That figure has gotten less favorable in recent
weeks but this is usually the worst of cash hog prices and as cash im- 98.5% of last year, a figure that Bost thinks looks reasonable. But will a
proves so will futures. Bost goes on to say he expects the breeding herd Dec 1 herd only slightly smaller than last year result in farrowing reduc-
to be down 0.3 to 0.4% in the December report. We think that is a pretty tions that large from March forward? That seems a stretch and, should
reasonable number at this point. USDA called Dec-Feb farrowings at litters continue to grow 1-2%/year, there may be plenty of pigs next fall
The Daily Livestock Report is published by Steve Meyer and Len Steiner. To subscribe/unsubscribe visit www.dailylivestockreport.com.
Disclaimer: The Daily Livestock Report is intended solely for information purposes and is not to be construed, under any circumstances, by implication or otherwise, as an offer to sell or a solicitation to buy or trade any
commodities or securities whatsoever. Information is obtained from sources believed to be reliable, but is in no way guaranteed. No guarantee of any kind is implied or possible where projections of future conditions are
attempted. Futures trading is not suitable for all investors, and involves the risk of loss. Past results are no indication of future performance. Futures are a leveraged investment, and because only a percentage of a con-
tract’s value is require to trade, it is possible to lose more than the amount of money initially deposited for a futures position. Therefore, traders should only use funds that they can afford to lose without affecting their life-
style. And only a portion of those funds should be devoted to any one trade because a trader cannot expect to profit on every trade.
CME Group is the trademark of CME Group, Inc. The Globe logo, Globex® and CME® are trademarks of Chicago Mercantile Exchange, Inc. CBOT® is the trademark of the Board of Trade of the City of Chicago. NYMEX,
New York Mercantile Exchange, and ClearPort are trademarks of New York Mercantile Exchange. Inc. COMEX is a trademark of Commodity Exchange, Inc. Copyright © 2012 CME Group. All rights reserved.