More Related Content
More from joseleorcasita (20)
Daily livestock report dec 10 2012
- 1. Vol. 10, No. 238 December 10, 2012
“Have fun with that!” That was the response from a Brazilin PRIVATE NONFARM EMPLOYMENT
friend a few years ago when we mentioned that Russia was a growth
market for U.S. pork exports. And it was far more a warning than a wish 400.000
of good fortune! Brazil’s livestock sectors in general and pork sector in
particular said this based on a long history of dealing with Russian needs 200.000
and whims and knew full well how difficult that process could be at times.
h
t
We were once again reminded of our Brazilian friend’s warning n
o 0.000
this week as Russia announced that it wanted all U.S. beef and pork im- m
s
ported into Russia to be tested and certified free of ractopamine, a beta u
o
i
-200.000
v
agonist feed additive used in the U.S. and many other countries to im- e
r
p
prove animal performance in pigs and beef cattle. The U.S. Meat Export m
o
-400.000
r
Federation said that the requirement could halt shipments of U.S. prod- f
e
ucts to Russia by last Saturday, December 8. A primary concern is simp- g
n
a
-600.000
ly meeting the paperwork requirement, especially for product that is al- h
C
ready in transit. A Reuters report quoted USMEF estimates that there
were 210 shipping containers of U.S. pork and beef valued at around $20 -800.000
million already on their way to Russia.
How important is the Russian market to the U.S. beef and pork -1000.000
industries? The appropriate answer is “Not unimportant by any means. 2002 2003 2004 2005 2006 2007 2008 2009 2010 2011 2012
Small relative to some others but growing.” U.S. beef companies had
shipped 121.7 million pounds of carcass weight equivalent product to
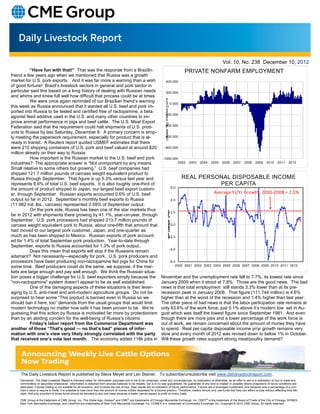
Russia through September. That figure is up 5.3% versus last year and REAL PERSONAL DISPOSABLE INCOME
represents 6.6% of total U.S. beef exports. It is also roughly one-third of PER CAPITA
6.0
the amount of product shipped to Japan, our largest beef export custom-
er, through September. Russian exports accounted 0.6% of U.S. beef Average Yr/Yr Growth, 2000‐2008 = 2.1%
output so far in 2012. September’s monthly beef exports to Russia 4.0
(11.982 mil. lbs., carcass) represented 0.59% of September output.
On the pork side, Russia has been one of the star markets thus r
far in 2012 with shipments there growing by 41.1%, year-on-year, through / 2.0
Y
r
Y
September. U.S. pork processors had shipped 213.7 million pounds of ,
e
g
carcass weight equivalent pork to Russia, about one-fifth that amount that n 0.0
a
h
had moved to our largest pork customer, Japan, and one-quarter as C
.
t
much as has been shipped to Mexico. Russian exports of pork account- c-2.0
P
ed for 1.4% of total September pork production. Year-to-date through
September, exports to Russia accounted for 1.3% of pork output..
-4.0
Does this mean that exports will stop if the Russians remain
adamant? Not necessarily—especially for pork. U.S. pork producers and
processors have been producing non-ractopamine fed pigs for China for -6.0
some time. Beef producers could do the same, we suppose, if the mar- 2000 2001 2002 2003 2004 2005 2006 2007 2008 2009 2010 2011 2012
kets are large enough and pay well enough. We think the Russian situa-
tion poses a bigger challenge for U.S. beef exporters simply because the November and the unemployment rate fell to 7.7%, its lowest rate since
“non-ractopamine” system doesn’t appear to be as well established. January 2009 when it stood at 7.8%. Those are the good news. The bad
One of the damaging aspects of these situations is their lever- news is that total employment still stands 3.3% lower than at its pre-
aging by U.S. anti-meat and anti-modern agriculture groups. Do not be recession peak in January 2008. That figure (111.744 million) is 4.6%
surprised to hear some “This product is banned even in Russia so we higher than at the worst of the recession and 1.4% higher than last year.
should ban it here, too” demands from the usual groups that would limit The other piece of bad news is that the labor participation rate remains at
modern technology no matter how safe it has been proven to be. We’re only 63.6% of the work force, just 0.1% above it’s modern low set in Au-
guessing that this action by Russia is motivated far more by protectionism gust which was itself the lowest figure since September 1981. And even
than by an abiding concern for the well-being of Russia’s citizens. though there are more jobs and a lower percentage of the work force is
Friday’s labor report from the Commerce Department was out of work, we remain concerned about the amount of money they have
another of those “That’s good — no that’s bad” pieces of infor- to spend. Real per capita disposable income yr/yr growth remains very
mation with one’s view very likely strongly correlated with the party slow and every month of 2012 was revised down to below 1% in October.
that received one’s vote last month. The economy added 118k jobs in Will these growth rates support strong meat/poultry demand?
The Daily Livestock Report is published by Steve Meyer and Len Steiner. To subscribe/unsubscribe visit www.dailylivestockreport.com.
Disclaimer: The Daily Livestock Report is intended solely for information purposes and is not to be construed, under any circumstances, by implication or otherwise, as an offer to sell or a solicitation to buy or trade any
commodities or securities whatsoever. Information is obtained from sources believed to be reliable, but is in no way guaranteed. No guarantee of any kind is implied or possible where projections of future conditions are
attempted. Futures trading is not suitable for all investors, and involves the risk of loss. Past results are no indication of future performance. Futures are a leveraged investment, and because only a percentage of a con-
tract’s value is require to trade, it is possible to lose more than the amount of money initially deposited for a futures position. Therefore, traders should only use funds that they can afford to lose without affecting their life-
style. And only a portion of those funds should be devoted to any one trade because a trader cannot expect to profit on every trade.
CME Group is the trademark of CME Group, Inc. The Globe logo, Globex® and CME® are trademarks of Chicago Mercantile Exchange, Inc. CBOT® is the trademark of the Board of Trade of the City of Chicago. NYMEX,
New York Mercantile Exchange, and ClearPort are trademarks of New York Mercantile Exchange. Inc. COMEX is a trademark of Commodity Exchange, Inc. Copyright © 2012 CME Group. All rights reserved.
- 2. Vol. 10, No. 238 December 8, 2012
PRODUCTION AND PRICE SUMMARY Week Ending 12/8/2012
Current Pct. Pct. Pct.
Item Units Week Last Week Change Last Year Change YTD Change
Total Meat & Poultry Prod. Million lbs. 1786.0 1601.9 11.49% 1738.9 2.70% 75,748 -0.75%
C FI Slaughter Thou. Head 639 635 0.63% 646 -1.14% 28,099 -3.95%
A FI Cow Slaughter Thou. Head 117.6 142.2 -17.29% 116.5 0.94% 5,759 -4.56%
T Avg. Live Weight Lbs. 1321 1324 -0.23% 1298 1.77% 1,303 1.91%
T Avg. Dressed Weight Lbs. 795 794 0.13% 777 2.32% 790 2.17%
L Beef Production Million Lbs. 507.2 502.8 0.88% 500.5 1.34% 22,133 -1.72%
E Live Fed Steer $/cwt live wt. 123.76 125.79 -1.60% 120.47 2.73%
Dressed Steer $/cwt carcass 196.00 199.57 -1.79% 195.49 0.26%
& OKC Feeder Steer 600-700 Lbs. 145.64 145.78 -0.10% 144.90 0.51%
Beef Cutout 600-750 Choice 194.47 195.65 -0.60% 188.57 3.13%
B Hide/Offal $/cwt live wt. 12.93 12.88 0.39% 12.35 4.70%
E Rib Choice 336.15 331.27 1.47% 317.12 6.00%
E Round Choice 161.52 163.67 -1.31% 158.52 1.89%
F Chuck Choice 153.79 156.48 -1.72% 150.17 2.41%
Trimmings, 50% Fresh 71.89 76.49 -6.01% 102.89 -30.13%
Trimmings, 90% Fresh 207.20 206.83 0.18% 187.55 10.48%
H FI Slaughter Thou. Head 2364 2399 -1.46% 2328 1.54% 96,292 2.04%
O FI Sow Slaughter Thou. Head 43.6 62.0 -29.65% 43.7 -0.12% 2,711 -0.58%
G Avg. Dressed Weight Lbs. 206 205 0.49% 208 -0.96% 206 0.08%
S Pork Production Million Lbs. 486.2 492.4 -1.26% 485 0.25% 19,786 2.23%
Iowa-S. Minn. Direct Avg. 84.97 80.33 5.80% 83.50 1.80%
& Natl. Base Carcass Price Weighted Avg. 82.28 78.81 4.40% 83.45 -1.40%
Natl. Net Carcass Price Weighted Avg. 84.65 81.05 4.40% 85.82 -1.40%
P Pork Cutout 200 Lbs 85.55 84.00 1.80% 89.48 -4.40%
O Hams Primal Cutout 75.73 71.76 5.50% 78.53 -3.60%
R Loins Primal Cutout 86.51 86.16 0.40% 96.25 -10.10%
K Bellies Primal Cutout 120.08 118.15 1.60% 108.48 10.70%
C Young Chicken Slaughter* Million Head 153.40 123.85 23.86% 148.06 3.61% 6,715 -3.56%
H Avg. Weight Lbs., RTC 4.43 4.37 1.37% 4.37 1.37% 4.3 0.33%
I Broiler Production Million Lbs., RTC 678.8 540.7 25.55% 646.4 5.02% 29,057 -2.37%
C Eggs Set Million 198.2 194.6 1.87% 194.2 2.09% 9,311 -2.32%
K Chicks Placed Million Head 159.6 151.7 5.17% 160.6 -0.64% 7,758 -1.88%
E 12-City Broiler Composite 98.58 98.5 0.10% 79.59 23.90%
N Georgia Dock Broiler 2.5-3 Lbs. 97.22 96.98 0.20% 88.91 9.30%
Northeast Breast Skinlss/Bonelss 130.77 128.6 1.70% 125.42 4.30%
Northeast Leg Quarters 66.67 67.43 -1.10% 66.40 0.40%
T Young Turkey Slaughter* Million Head 4.58 2.62 75.15% 4.63 -1.10% 196.8 -0.28%
U Avg. Weight Lbs. 24.82 25.25 -1.68% 23.11 7.40% 24.2 2.29%
R Turkey Production Million Lbs. 113.7 66.0 72.21% 107.1 6.22% 4,771 1.94%
K Eastern Region Hen 8-16 Lbs. 99.97 108.34 -7.70% 111.79 -10.60%
F Corn, Omaha $ per Bushel 7.77 7.80 -0.38% 6.05 28.45%
E DDGS, Minnesota $ per ton 0.00 242.50 -100.00% 196.00 -100.00%
E Wheat, Kansas City $ per Bushel 8.67 8.68 -0.12% 6.37 36.11%
D Soybeans, S. Iowa $ per Bushel 15.07 14.60 3.22% 11.39 32.30%
SB Meal, 48% Central Illinois $ per Ton 468.70 462.70 1.30% 273.30 71.50%
* Chicken & turkey slaughter, production and prices are 1 week earlier than the date at the top of this table. Cow & sow slaughter are for 2 weeks earlier