More Related Content
More from joseleorcasita (20)
Daily livestock report aug 3 2012
- 1. Vol. 10, No. 150 August 3, 2012
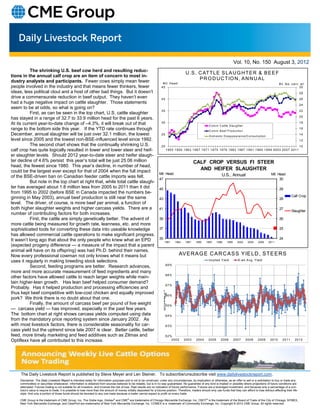
The shrinking U.S. beef cow herd and resulting reduc-
U .S . C AT T LE S LA U G H T E R & B E E F
tions in the annual calf crop are an item of concern to most in-
dustry analysts and participants. Fewer cows simply mean fewer
P R O D U C T IO N , A N N U A L
M il. H ead B il. lbs. carc. w t.
people involved in the industry and that means fewer thinkers, fewer 45 30
ideas, less political clout and a host of other bad things. But it doesn’t 28
drive a commensurate reduction in beef output. They haven’t even 40 26
had a huge negative impact on cattle slaughter. Those statements 24
seem to be at odds, so what is going on?
35 22
First, as can be seen in the top chart, U.S. cattle slaughter
20
has stayed in a range of 32.7 to 33.9 million head for the past 6 years.
At its current year-to-date change of –4.3%, it will break out of that 30 18
C o m m C a ttle S la u g hte r
range to the bottom side this year. If the YTD rate continues through C o m m B e e f P ro d u ctio n
16
December, annual slaughter will be just over 32.1 million, the lowest 25
D o m e stic D isa p p e a ra n ce /C o n su m p tion
14
level since 2005 and the lowest non-BSE-influenced level since 1992. 12
The second chart shows that the continually shrinking U.S. 20 10
calf crop has quite logically resulted in lower and lower steer and heif- 195 5 195 9 196 3 1967 197 1 197 5 197 9 198 3 198 7 199 1 199 5 199 9 2003 200 7 201 1
er slaughter levels. Should 2012 year-to-date steer and heifer slaugh-
ter decline of 4.6% persist this year’s total will be just 25.06 million CALF CROP VERSUS FI STEER
head, the fewest since 1980. This year’s decline, in number of head,
could be the largest ever except for that of 2004 when the full impact AND HEIFER SLAUGHTER
Mil. Head U.S., Annual Mil. Head
of the BSE-driven ban on Canadian feeder cattle imports was felt.
47 30
But note in the top chart at right that, while total cattle slaugh-
ter has averaged about 1.8 million less from 2005 to 2011 than it did 45 29
from 1995 to 2002 (before BSE in Canada impacted the numbers be-
ginning in May 2003), annual beef production is still near the same Calf Crop
43 28
level. The driver, of course, is more beef per animal, a function of
both higher slaughter weights and higher carcass yields. There are a 41 27
Slaughter
number of contributing factors for both increases.
First, the cattle are simply genetically better. The advent of 39 26
more cattle being measured for growth rate, leanness, etc. and more
sophisticated tools for converting these data into useable knowledge 37 25
has allowed commercial cattle operations to make significant progress.
It wasn’t long ago that about the only people who knew what an EPD 35 24
1981 1984 1987 1990 1993 1996 1999 2002 2005 2008 2011
(expected progeny difference — a measure of the impact that a parent
animal will have on its offspring) was had Ph.D. behind their names.
Now every professional cowman not only knows what it means but AV E R A G E C A R C A S S Y IE LD , S TE E R S
uses it regularly in making breeding stock selections. Im plied Y ield 8-w k A vg. Y ield
69%
Second, feeding programs are better. Research advances,
more and more accurate measurement of feed ingredients and many
68%
other factors have allowed cattle to reach larger weights while main-
tain higher-lean growth. Has lean beef helped consumer demand?
67%
Probably. Has it helped production and processing efficiencies and
.
t
thus kept beef competitive with low-cost chicken and equally improved W
e66%
pork? We think there is no doubt about that one. v
i
L
f
Finally, the amount of carcass beef per pound of live weight o
.
t 65%
c
— carcass yield — has improved, especially in the past few years. P
The bottom chart at right shows carcass yields computed using data 64%
from the mandatory price reporting system since January 2002. As
with most livestock factors, there is considerable seasonality for car- 63%
cass yield but the uptrend since late 2007 is clear. Better cattle, better
feed, more timely marketing and feed additives such as Zilmax and 62%
Optiflexx have all contributed to this increase. 2002 200 3 2004 2005 2006 2007 2008 2009 2010 2011 2012
The Daily Livestock Report is published by Steve Meyer and Len Steiner. To subscribe/unsubscribe visit www.dailylivestockreport.com.
Disclaimer: The Daily Livestock Report is intended solely for information purposes and is not to be construed, under any circumstances, by implication or otherwise, as an offer to sell or a solicitation to buy or trade any
commodities or securities whatsoever. Information is obtained from sources believed to be reliable, but is in no way guaranteed. No guarantee of any kind is implied or possible where projections of future conditions are
attempted. Futures trading is not suitable for all investors, and involves the risk of loss. Past results are no indication of future performance. Futures are a leveraged investment, and because only a percentage of a con-
tract’s value is require to trade, it is possible to lose more than the amount of money initially deposited for a futures position. Therefore, traders should only use funds that they can afford to lose without affecting their life-
style. And only a portion of those funds should be devoted to any one trade because a trader cannot expect to profit on every trade.
CME Group is the trademark of CME Group, Inc. The Globe logo, Globex® and CME® are trademarks of Chicago Mercantile Exchange, Inc. CBOT® is the trademark of the Board of Trade of the City of Chicago. NYMEX,
New York Mercantile Exchange, and ClearPort are trademarks of New York Mercantile Exchange. Inc. COMEX is a trademark of Commodity Exchange, Inc. Copyright © 2012 CME Group. All rights reserved.