1. Track Performance in Real Time
Analyze performance, risk, composition, style, and characteristics for multiple portfolios and portfolio managers in real time. With
analytics that work at the speed of the markets, you have a more accurate picture of your portfolio and a clear idea of the impact of
any investment changes you are considering.
Customize Interactive Reports
and Charts
Examine reports and charts dynamically
with custom sorting, easy formatting
options, and quick views of group- and
security-level details. View multiple
reports and charts side-by-side, with
intelligent linking that carries the portfolio,
benchmark, and other details across all of
your views. Create a personalized display
of reports and charts to open automatically
when you launch FactSet.
Access Streaming Global Data
Combine your proprietary holdings
with FactSet content or third-party data
sources, including extensive benchmark
data and global exchange indices.
Integrate your holdings with a nightly
upload or intraday connection to your
firm’s OMS. Accurately monitor your
portfolio’s performance with access to
real-time prices and intraday trades.
FactSet’s sophisticated analytics let you spend your time finding answers, not
managing data. Leverage our decades of industry-leading portfolio analytics
experience to discover your portfolio’s true alpha. No other analytics provider
understands your investment process like FactSet.
Equity Portfolio
Analysis
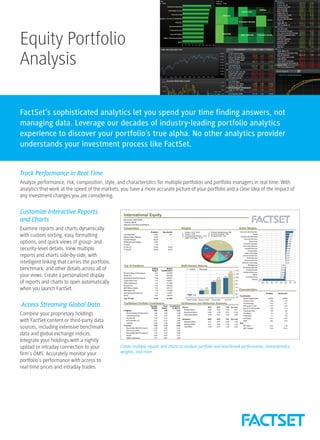
Create multiple reports and charts to analyze portfolio and benchmark performance, characteristics,
weights, and more.
2. Analyze Composition and Characteristics
Customize weights reports and gain insight into portfolio and benchmark weights using your own groupings for reports and charts.
Use characteristic reports to view weights on the portfolio level, including market capitalization, valuation measures, growth rates, and
other financial ratios for your portfolio and selected benchmarks. View details at the security level to examine the current valuation for
individual holdings, groups, and the total portfolio with customizable valuation ratios.
Chart Performance from Multiple Perspectives
Chart the performance of your portfolio management decisions over a series of months, quarters, years, or other periods, and plot
this data against the overall effect. View intraday performance relative to a benchmark with performance heat maps to uncover
problem sectors, and then examine each sector to see which individual securities helped or hurt performance during the day.
Customize the colors, labels, and other formatting aspects. You can also look at the raw data and charts simultaneously.
View market cap, valuation measures, growth rates, and other financial
ratios for your portfolios and benchmarks.
Analyze portfolio and benchmark characteristics in a chart display to easily
identify differences.
Gain an overall perspective of your best and worst performing countries throughout the day with atlas heat
map charts.
3. Analyze Relative and Absolute Performance
Research the performance of your portfolio relative to a benchmark to see if it outperformed and how each group contributed to
overall performance. Understand how management decisions such as group allocation, security selection, and currency tilts may have
affected performance results.
++ Evaluate relative performance using several different attribution models
++ Use a traditional model to evaluate allocation, selection, and interaction at a glance
++ Access a multi-manager or fund of fund investment approach using a top-down or macro attribution model
++ Assess portfolio performance on an absolute basis
++ View how price changes and dividend payments contributed to total return
++ Investigate each company’s weight, price change, market value, total return, and contribution to return
Create Custom Groups
Examine how segments of your portfolio performed by creating groupings by sector, industry, market cap, country, or your own
criteria. Create custom groupings of the highest and lowest securities in your portfolio based on factors like market value, P/E, or
growth rate. Choose grouping definitions from FactSet, vendors such as SP, or your own proprietary definitions.
Analyze Performance on the Road
Receive the highest level of access to your portfolios while you’re on the go with FactSet for iPad, where your portfolio holdings are
automatically synced. View PL, analyze attribution, or decompose risk for multiple portfolios in one view. See how market shifts
impact your investment decisions with intraday prices and portfolio updates. Create alerts to easily identify significant movements in
your portfolio values and view notifications on your iPad.
Audit any value in your
report to view the
underlying calculations.