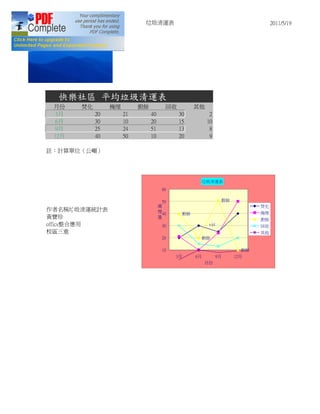
The document contains a table with 4 columns and 4 rows of numerical data, listing numbers between 10 and 60 in each cell. A line graph is shown with the x-axis labeled with numbers 3, 6, 9, 12, and the y-axis labeled up to 60, with a line rising from left to right showing a general upward trend.