130-Ince Business patenting and publishing
•
1 like•270 views

Blue Sky 3 - Poster Gallery
Recommended

Recommended
More Related Content
What's hot
What's hot (20)
Viewers also liked
Viewers also liked (14)
Similar to 130-Ince Business patenting and publishing
Similar to 130-Ince Business patenting and publishing (20)
More from innovationoecd
More from innovationoecd (20)
Recently uploaded
Recently uploaded (20)
130-Ince Business patenting and publishing
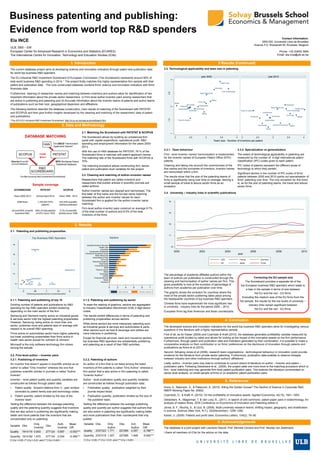
- 1. The current database project aims at developing science and innovation indicators through patent and publication data for world top business R&D spenders. The EU Industrial R&D Investment Scoreboard of European Commission (The Scoreboard) represents around 90% of total world business R&D spending in 2014. 1 The project firstly matches this highly representative firm sample with their patent and publication data. . The core constructed database combine firms’ science and innovation indicators with firms’ financials data. Furthermore, cleaning of researcher names and matching between inventors and authors allow for identification of two important information about the private sector researchers: (i) Firm-level author-inventor pairs among researchers that are active in publishing and patenting and (ii) Accurate information about the inventor teams of patents and author teams of publications such as their size, geographical dispersion and affiliations. The following sections describe the database construction, main results of matching of the Scoreboard with PATSTAT and SCOPUS and then give further insights developed by the cleaning and matching of the researchers’ data of patent and publications. 2. Data and Methodology 4. Conclusion 1. Introduction 3. Results 5. References 3.Results (Continued) Business patenting and publishing: Evidence from world top R&D spenders Ela INCE ULB, SBS – EM European Center for Advanced Research in Economics and Statistics (ECARES) The International Centre for Innovation, Technology and Education Studies (iCite) Arora, A., Belenzon, S., & Patacconi, A. (2015). Killing the Golden Goose? The Decline of Science in Corporate R&D, NBER Working Paper No. 20902. Czarnitzki, D., & Kraft, K. (2010). On the profitability of innovative assets. Applied Economics, 42(15), 1941–1953. Debackere, K., Magerman, T. & Van Looy, B., (2011). In search of anti-commons: patent paper pairs in biotechnology. An analysis of citation flows. ZEW Conference on Economics of Innovation and Patenting edition:4. Jones, B. F., Wuchty, S., & Uzzi, B. (2008). Multi-university research teams: shifting impact, geography, and stratification in science. Science (New York, N.Y.), 322(November), 1259–1262. Kaiser, U. (2009). Patents and profit rates. Economics Letters, 104(2), 79–80. 6. Acknowledgements 3.4. University – industry links in scientific publications 3.2. Firm-level author – inventor pairs 3.1. Patenting and publishing propensities 3.3. Technological applicability and team size in patenting 3.1.1. Patenting and publishing of top 10 Dividing number of patents and publications by R&D spending for top R&D spenders exhibit clustering depending on the main sector of the firm. Samsung and Siemens mainly active on industrial goods & services sector hold the highest patenting propensities. However, Samsung, being active on more than one sector, publishes more and patents less on average with respect to its overall R&D spending. Firms active on automobiles sector have higher patenting but lower publishing propensities than firms active in health care sector except for Johnson & Johnson. Microsoft is the only software-technology firm shown among the sample. 3.1.2. Patenting and publishing by sector To ease the reading of graphics, sectors are aggregated to Industry Classification Benchmark (ICB) 2-digit sector codes. The results exhibit differences in terms of patenting and publishing propensities across sectors. While some sectors are more intensively patenting such as industrial goods & services and automobiles & parts, other sectors such as food & beverage and utilities are more intensive in publishing. Except for financial services, bank and insurance sectors, top business R&D spenders are substantially publishing and patenting as a result of their R&D activities. 2.1. Matching the Scoreboard with PATSTAT & SCOPUS The Scoreboard allows for building an unbalanced firm panel with capital expenditure, operational profit, R&D spending and employment information for the years 2000- 2013. With the use of HAN database for PATSTAT, 79 % of the Scoreboard firms is matched with patent applicant names. The matching rate of the Scoreboard firms with SCOPUS is 70%. The matching procedure allows constructing firm, sector, patent and publication level variables for the project. 2.2. Cleaning and matching of author–inventor names Researchers that patent are called inventors and researchers that publish articles in scientific journals are called authors. Author-inventor names are cleaned and harmonised. The first letter of first name and the full last name matching between the author and inventor names for each Scoreboard firm is applied for the author-inventor name matching. Firm-level author-inventor pairs construct on average 9.7% of the total number of authors and 8.5% of the total inventors of the firms. 3.3.1. Team behaviour Firm - level inventor names’ harmonisation is implemented for the inventor names of European Patent Office (EPO) patents. Cleaning and taking into account the commonness of the first names and the surnames of inventors, inventor names are harmonised within a firm. The results show that the size of the patenting teams of firms is significantly rising over time on average, leaving a small sample of travel & leisure sector firms as an exception. 3.3.2. Specialization vs generalization The extent of technological applicability in patenting are measured by the number of 4-digit international patent classification (IPC) codes given to each patent. IPC codes of patents represent the different areas of technology to which they pertain. Significant decline in the number of IPC codes of firms’ patents between 2000 and 2010 points out specialisation of firms’ patenting over time. The only exception for this trend is, as for the size of patenting teams, the travel and leisure sector firms. The percentage of academia affiliated authors within the team of authors per publication is constructed through the cleaning and harmonisation of author names per firm. This gives possibility to look at the evolution of percentage of authors from academia per publication over time. The graphic shows the evolution for countries where the most of the private sector publishing takes place among the headquarter countries of top business R&D spenders. Chinese firms have experienced the most significant rise in university - industry links for the period 2000 – 2010. European firms lag their American and Asian counterparts. Correcting the EU sample size The Scoreboard provides a separate list of the top European business R&D spenders which leads to a bias in the sample in terms of size between the EU and the non - EU firms. Excluding the medium size of the EU firms from the full sample, the results for the low levels of university – industry links remain significant between the EU and the non - EU firms. 0 .1.2.3.4 Average%ofauthorsfromacademia 2000 2002 2004 2006 2008 2010 year USA France Germany UK Japan China Contact Information: SBS-EM, Université Libre de Bruxelles Avenue F.D. Roosevelt 50, Brussels, Belgium Phone: +32 (0)650 3929 Email: ela.ince@ulb.ac.be 3.2.1. Publishing of inventors An inventor that doesn’t appear in scientific articles as an author is called “Only Inventor” whereas the one that publishes scientific articles in journals is called “Author Inventor”. Inventor – level patent quality and quantity variables are constructed as follows through patent data: i. Patent quality: forward citations from 3 - year window corrected by patent family size and technology codes. ii. Patent quantity: patent divided by the size of the inventor team Testing the difference between the average patenting quality and the patenting quantity suggests that inventors that are also active in publishing are significantly making better and more patents than the inventors that are concentrated only on patenting: 3.2.2. Patenting of authors An author of a firm that is not listed among the listed inventors of firm patents is called “Only Author” whereas a firm author that is also active in firm patenting is called “Inventor Author”. Author - level publication quality and quantity variables are constructed as follows through publication data: i. Publication quality: publication weighted by their journal impact factor. ii. Publication quantity: publication divided by the size of the publisher team. Testing the difference between the average publishing quality and quantity per author suggests that authors that are also active in patenting are significantly making better and more publications than their counterparts that only publish: The database is a joint project with Lauriane Dewulf, Prof. Michele Cincera and Prof. Nicolas van Zeebroeck. I thank all members of iCite for the advice on the data. 0 .2 .4 .6 .8 1 Insurance Banks Financial Services Utilities Technology Media Travel & Leisure Retail Food & Beverage Real Estate Telecommunications Oil & Gas Automobiles & Parts Basic Resources Personal & Household Goods Construction & Materials Chemicals Health Care Industrial Goods & Services Sectors patent propensity publication propensity The developed science and innovation indicators for the world top business R&D spenders allow for investigating various questions in the literature with a highly representative sample. First of all, as for Kaiser (2009) and Czarnitzki & Kraft (2010), the database generates profitability variable measured by operational profit divided by sales and allows for looking at the impact of the innovative assets on the firm performance. Furthermore, through patent and publication data and indicators generated by their combination, it is possible to make a comparative analysis on their contribution or on firms’ preferences on the disclosure of innovation through patents and publications as Arora et al (2015). Second, following Jones et al (2008), research team organisations - technological behaviour in innovation could provide evidence for the literature from private sector patenting. Furthermore, publication data enables to observe linkages between industry and other institutions through authors’ affiliations. Lastly, author - inventor pairs may lead to contribute to current strand of literature on author - inventor and patent – publication pairs. Following Debackere et al., (2009), the project adds one more level to the matching procedure which is firm - level matching and may generate firm-level patent-publication pairs. This extends the literature concentrated on sector level analysis, on small sample of firms or on academic patent-publication pairs. 1The 2015 EU Industrial R&D Investment Scoreboard: http://iri.jrc.ec.europa.eu/scoreboard.html SAMSUNG GSK PFIZER FORD MICROSOFT DAIMLER GM VW SIEMENS J&J 0 .2.4.6.8 0 .05 .1 .15 .2 Publishing propensity (Number of publications/€m)' Top Business R&D Spenders Automobiles Basic Resources Chemicals Construction Food & Beverage Health Care Industrials Media Oil & Gas HH Goods Retail Technology Telecomm. Travel & Leisure Utilities Automobiles Basic Resources Chemicals Construction Food & Beverage Health Care Industrials Media Oil & Gas HH Goods Retail Technology Telecommunications Travel & Leisure Utilities 1 1.5 2 2.5 3 2 2.5 3 3.5 4 2 2.5 3 3.5 4 year 2000 year 2010 Applicability-IPCcodesperpatent Team size - Number of inventors per patent Variable Obs. Only Inventor Obs. Auth. Inventor Mean Diff. Quality 1914119 0.643 277124 0.697 -0.053*** Quantity 1914162 1.670 277134 2.034 -0.365*** (*) if p < 0.05, (**) if p < 0.01, and (***) if p < 0.001. Variable Obs. Only Author Obs. Invt. Author Mean Diff. Quality 2337323 1.771 227285 2.557 -0.786*** Quantity 2337319 1.307 227285 1.848 -0.542*** (*) if p < 0.05, (**) if p < 0.01, and (***) if p < 0.001.