1. aniefiok Otu Akpan, augustine A. Umoh, ubon E. Asuquo / International Journal of
Engineering Research and Applications (IJERA) ISSN: 2248-9622 www.ijera.com
Vol. 3, Issue 1, January -February 2013, pp.1482-1486
Investigating The Effect Of Classroom Amplification On
Students’ Listening Behaviour In Akwa Ibom State, South- South
Nigeria
1
aniefiok Otu Akpan, 2augustine A. Umoh And 3ubon E. Asuquo
1
Department of Physics, Akwa Ibom State University, PMB 1167, Uyo Akwa Ibom State, South South Nigeria.
2
Deparment of Physics, University of Uyo, Uyo, Akwa Ibom State, South- south Nigeria.
3
Department of Physics, University of Calabar, PMB 1115, Calabar, Cross River State, South- South Nigeria
Abstract
Investigation of the effects of classroom impairment. For optimal academic achievement,
amplification on students’ listening behaviour in accurate transmission of acoustical information is
Akwa Ibom state has shown high correlation imperative. Acoustical variables that can
between the teachers’ rating of the listening compromise the perception of speech include level
behaviour of students studying under a sound of background noise, level of speech signal relative
field amplified classroom conditions which was to the background noise, reverberation time and the
rated excellent by 14.5% ,very high by 53%, distance from the teacher to the student ( Crandell
good by 22.3% of the respondents and the SNR and Smaldino , 2000). Speech intelligibility of the
of the lecturers amplified speeches. A correlation pupils in Federal Airport Authority of Nigeria
coefficient of 0.87 between these two variables (FAAN) nursery primary/secondary school and that
clearly shows that sound field amplification of of the students of the Federal Government girls
classrooms greatly increases the SNR of the college, Calabar is greatly affected by aircraft noise
lecturers speeches which in turn positively (Akpan et al, 2012).
influences the listening behaviour of the students Background noise refers to any undesired
. It is therefore necessary to encourage the auditory stimuli that interferes with what a student
teaching of students in amplified classroom wants or needs to hear and understand ( Crandell et
conditions as this will enhance their listening al, 1995). This can affect a student’s concentration
and attending behaviour and their academic causing misinterpretation of lessons thereby making
performance as a whole. Schools should not be learning to suffer ( Johnson, 2001). Background
sited close to major and busy highways where noise sources in classrooms include external noise,
vehicular noise will greatly increase their i.e noise that is generated outside the building such
background noise as this will negatively affect the as aircraft, construction sites, vehicular traffic and
listening and attentive behaviour of the students play ground. It can also be internal noise, ie noise
which of course will have adverse affect on their that generates from the building but outside the
general academic performance. If sited close to classroom such as rooms adjacent to cafeterias,
highways, the schools should be well shielded lecture rooms, gymnasiums and busy hall ways, and
from vehicular traffic. room noise ie noise that is generated within the
classroom ( Bess and McCoonnell, 1981; Crandell
Key Words: Classroom amplification, Students’ and Smaldino, 1994, 1995, 1996, 2000b; Olse, 1981,
listening behaviour, Signal to noise ratio, 1988)
Background noise Level of speech signal relative to the
background noise is referred to as the signal to noise
1.0 Introduction ratio (SNR). Speech perception ability is highest at
According to the American Speech favourable SNR and decreases as a function of
Language Hearing Association (ASHA) poor reduction in SNR (Crum, 1974; Finitzo-Hieber and
acoustical environments can affect the students Tillman, 1978).
attention and listening behaviours, speech SNR = Speech signal -
perception and ultimately academic performance. Background noise...................(1)
The effects of the acoustical environment become Signal to noise ratio of the classroom environment
greater if the student has a hearing loss ( ASHA, can be improved by effecting changes to the
1995), students with hearing loss may have classroom environment which will reduce the
difficulty with understanding of auditory background noise while the teacher’s voice remains
information ( Beattie and Zipp, 1990 ; Woglemuth the same. Alternatively, this can be done by
et al, 1998). Acoustical environment of a classroom increasing signal to noise ratio of the teachers voice
is a critical factor in the academic, using amplification systems such as personal
psychoeducational and psychosocial achievement of frequency modulated (FM) systems, sound field
students with normal hearing and with hearing amplification, induction loop amplification or infra
1482 | P a g e
2. aniefiok Otu Akpan, augustine A. Umoh, ubon E. Asuquo / International Journal of
Engineering Research and Applications (IJERA) ISSN: 2248-9622 www.ijera.com
Vol. 3, Issue 1, January -February 2013, pp.1482-1486
red systems while the classroom environment noise during the school day (Crandell et al,1995;
remains unchanged. Sapienza, Crandell and Curtis, 1999).
Reverberation is the persistence or prolongation of Research results have shown that there are benefits
sound within an enclosure as sound waves reflect of from the use of amplification devices in classrooms,
hard surfaces. The major determinant of room these studies show that the listening and attending
acoustics is reverberation time (RT) , it is the time in behaviours of students improved after
seconds required for sound pressure at a particular implementation of the amplification system ( Flexer
frequency to decay 60 dB after the sound source has et al, 1994; Rosenberg et al, 1995; Arnold and
stopped (Siebein, Crandell and Gold, 1997). A Cannig,1999)
decrease of 60dB represents a reduction of 1x 10⁻⁶ 1.1 Materials and Methods
of the original intensity of the sound. With digital sound level meter S-100 ( voltcraft
Mathematically product) set at fast time evaluation and frequency
RT60 = 0.161V/ evaluation filter (weighting) set at A, background
∑Sα..............................................(2) noise levels were measured in selected classrooms
Where RT60 = RT in seconds, 0.161 is a constant, V in institutions listed in table 1.0. The classroom
= room volume in cubic feet and ∑Sα = the sum of background noise levels were taken when the
surface area S of the various materials in the room classrooms were occupied by the students and the
multiplied by their respective absorption coefficients lecturer. After a long term observation of the
α at a given frequency ( Sabine, 1964) students thought in Sound field amplified
There is spatial decay of sound levels as the classrooms where amplified signal is sent out to a
distance of the sound source increases from the loud speaker placed in the classroom, students’
receiver, the intensity of the sound decreases as listening behaviour was evaluated through
distance from the receiver increases. Direct sound questionnaires by their lecturers. For the purpose of
pressure obeys the inverse square law which states analysis the institutions were coded in line with the
that sound level decreases 6dB for every doubling of parameter being investigated, SLB stands for “
distance from the sound source. students’ listening behaviour”. Speech signals of the
Crook and Langdon (1974) observed that lecturers were measured 25 meters from the
teachers performance is also affected by classroom lecturers lecturing position, this was at about the
noise. Information received from 1200 teachers centre of the lecture halls for all assessed
concerning the effect of noise in the classroom on institutions. The students’ listening behaviour was
teachers showed that noise related to classroom rated excellent (4 points),very good (3 points),
activities and traffic or airplane correlated with good( 2 points), moderately good (1 points) and
teacher fatigue, increase tension and discomfort and poor (0 points) as the case may be . Pearson’s
an interference with teaching and speech recognition product moment correlation is used to correlated the
( Ko, 1979). Additional studies reported that rating with the signal to noise ratio (SNR) of the
teachers exhibit a significantly higher incidence of lecturers’ amplified voices to see the strength of
vocal problems than do the general population and it their relationship. The signal to noise ratio of
is reasonable to assume that these vocal difficulties amplified lecturers’ speech were calculated using
are caused at least in part by having to increase equation 1.0
vocal output to overcome the effects of classroom
Table 1.0 Institutions and Codes
S/N Names of Institution Codes
1 Akwa Ibom State University, Mkpat Enin SLB1
2 University of Uyo, SLB2
3 Akwa Ibom State Polytechnic, Ikot Osurua SLB3
4 School of Art and Science, Nnung Ukim Ikono SLB4
5 College of Education, Afaha Nsit SLB5
6 Maritime Academy, Oron SLB6
7 School of Nursing, Nwaniba, Uyo SLB7
8 School of Health Technology, Etinan SLB8
9 School of Nursing, Urua Akpan SLB9
10 Heritage Polytechnic, Eket SLB10
11 School of Accountancy, Ikpa Road, Uyo SLB11
1483 | P a g e
3. aniefiok Otu Akpan, augustine A. Umoh, ubon E. Asuquo / International Journal of
Engineering Research and Applications (IJERA) ISSN: 2248-9622 www.ijera.com
Vol. 3, Issue 1, January -February 2013, pp.1482-1486
1.2 Result
A total of 410 (four hundred and ten) questionnaires institution, the background noise levels of occupied
were distributed to lecturers in the 11 ( eleven ) classrooms and the signal to noise ratio of the
assessed institutions out of which 296 (two hundred lecturers voice in non amplified and amplified
and ninety six) valid response were received situations. Figure 1.0 shows the lecturers’
representing 72.2% of the total. Table 1.1 shows the evaluation of the students’ listening behaviour in
number of received questionnaires from each amplified classroom situations.
Table 1.1 Data for the evaluation of SLB
No. Of received Average occupied SNR of SNR of amplified
Institution Codes questionnaires background levels unamplified lecturers speech (
( dBA) lecturers speech ( dBA)
dBA)
SLB 1 19 59 +1 +4
SLB 2 68 61 0 +2
SLB 3 45 65 -2 +1
SLB 4 34 68 -4 +3
SLB 5 21 57 +2 +5
SLB 6 12 69 -1 +1
SLB 7 19 75 -6 +2
SLB 8 18 70 -2 +2
SLB 9 10 58 +2 +3
SLB 10 28 56 +2 +4
SLB 11 22 72 -3 +1
TOTAL 296
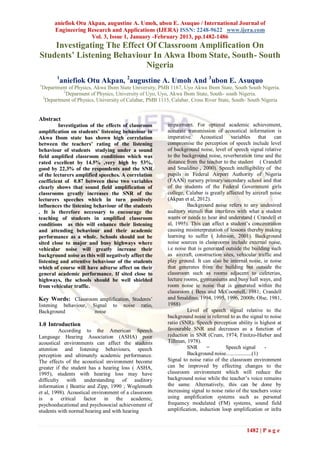
Fig 1.0 Lecturers’ rating of the listening behaviour of students studying in amplified sound field
conditions
SLB1
SLB2
SLB3
SLB4
SLB5 Excellent
SLB6 Very Good
SLB7
Good
SLB8
SLB9 Moderately Good
SLB10 Poor
SLB11
0 20 40 60 80
% of total respondents
1484 | P a g e
4. aniefiok Otu Akpan, augustine A. Umoh, ubon E. Asuquo / International Journal of
Engineering Research and Applications (IJERA) ISSN: 2248-9622 www.ijera.com
Vol. 3, Issue 1, January -February 2013, pp.1482-1486
Table 1.2 Overall students’ listening behaviour rating by lecturers
Response Weighting Average
Institution Excellent Very Good Moderately Poor per rating value per
(4) good (2) Good (0) institution (nx) institution
(3 (1) (n) (nx/n)
SLB1 4 7 5 3 0 19 50 2.6
SLB2 11 31 19 7 0 68 182 2.7
SLB3 5 28 11 1 0 45 127 2.8
SLB4 3 21 7 3 0 34 92 2.7
SLB5 4 13 4 0 0 21 63 3.0
SLB6 0 8 2 1 1 12 29 2.4
SLB7 2 10 4 3 0 19 49 2.6
SLB8 5 9 1 3 0 18 52 2.9
SLB9 2 5 1 3 0 10 28 2.8
SLB10 6 14 5 2 1 28 39 1.4
SLB11 1 11 7 3 0 22 54 2.5
TOTAL 43 157 66 26 2 296 765 28.4
Table 1.3 Correlation between SNR (X) of amplified lectures’ voices and the average response
value per institution (Y) on the effect of classroom amplification on students’ listening behaviour
Institutions X Y XY X2 Y2
SLB1 4 2.6 10.4 16 6.76
SLB2 2 2.7 5.4 4 7.29
SLB3 1 2.8 2.8 1 7.84
SLB4 3 2.7 8.1 9 7.29
SLB5 5 3.0 15 25 9.0
SLB6 1 2.4 2.4 1 5.76
SLB7 2 2.6 5.2 4 6.76
SLB8 2 2.9 5.8 4 8.41
SLB9 3 2.8 8.4 9 7.84
SLB10 4 1.4 5.6 16 1.96
SLB11 1 2.5 2.5 1 6.25
TOTAL 28 28.4 71.6 90 75.16
Correlation coefficient = 0.87
1.3 Discussion of Results dB(A) respectively as compared to others. These
Table 1.0 shows that the school of nursing, Nwaniba schools are located away from the highways such
road ( SLB 7) has the highest background noise that the vehicular noise from the highways have
level of 75 dB (A). This school is situated along a little or no effects on increasing their background
major street with heavy traffic flow at Uyo, the state noise. It can be seen that the SNR of the lecturers
capital. The high level of background noise is not amplified speeches are also significantly high, +4,
therefore unconnected with vehicular noise from +5, +3 and +4 respectively.
this major street. This has greatly affected the SNR Figure 1.0 shows that majority of the respondents
of unamplified and amplified speeches of the acknowledged the fact that the students’ listening
lecturers which were -6 and +2 dB(A) respectively. behaviour under amplified classroom conditions was
Ikpa road is also major road in Uyo metropolis excellent, very good and good, this is also reflected
where the school of accountancy is situated, it in table 1.2. This observation by the respondents
recorded second in terms of background noise again correlates well with the SNR of amplified lecturers
due to vehicular noise from this major road. The voices hence the high correlation coefficient of 0.87.
SNR of the lecturers unamplified and amplified This shows that classroom amplification has a
speeches are equally affected, -3 and + 1 dB ( A ) positive effect on the students’ listening behaviour,
respectively. The Heritage Polytecnic, Eket (SLB this is in line with the research findings of Flexer et
10), College of Education, Afaha Nsit (SLB 5), al, 1994, Rosenberg et al, 1995 and Arnold and
School of Nursing, Urua Akpan (SLB 9) and Akwa Cannig, 1999. They all observed that the listening
Ibom State University main campus, Mkpat Enin and attending behaviours of students improved upon
have low background noise of 56, 57, 58 and 59 implementation of amplified systems.
1485 | P a g e
5. aniefiok Otu Akpan, augustine A. Umoh, ubon E. Asuquo / International Journal of
Engineering Research and Applications (IJERA) ISSN: 2248-9622 www.ijera.com
Vol. 3, Issue 1, January -February 2013, pp.1482-1486
Conclusion devices for the hearing impaired (pp. 142 –
The investigation of the effect of classroom 164). Baltimore, MD: Williams & Wilkins.
amplification on students’ listening behaviour in [9]. Crandell, C., & Smaldino, J. (1995). An
Akwa Ibom State has shown that sound field update of classroom acoustics for children
amplification of classrooms greatly improve the with hearing impairment. Volta Review, 1,
SNR of the amplified teachers speech and this in 4 – 12.
turn makes the students to be more attentive to the [10]. Crandell, C., & Smaldino, J. (1999). Sound
teachers. field amplification in the classroom:
Applied and theoretical issues. In F. Bess,
Recommendation J. Gravel, & A. Tharpe (Eds.),
It is therefore highly recommended that schools Amplification for children with auditory
should not be sited close to major and busy deficits (pp. 229 – 250). Nashville, TN: Bill
highways where vehicular noise will greatly Wilkerson Center Press.
increase their background noise as this will greatly [11]. Crandell, C., & Smaldino, J. (2000b).
affect the listening and attentive behaviour of the Room acoustics for listeners with normal
students which of course will have adverse affect on hearing and hearing impairment. In M.
the general academic performance of the students. If Valente, R. Roeser, & H. Hosford-Dunn
sited close to highways, the schools should be well (Eds.). Audiology treatment (pp. 601-637).
shielded from vehicular traffic. New York: Thieme Medical.
[12]. Finitzo-Hieber, T., & Tillman, T. (1978).
References Room acoustics effects on monosyllabic
[1]. American Speech-Language-Hearing word discrimination ability for normal and
Association (ASHA). (1995). Position hearing-impaired children. Journal of
statement and guidelines for acoustics in Speech and Hearing Research, 21, 440 –
educational settings. ASHA, 37(14), 15-19. 458.
[2]. Aniefiok Akpan et al (2012). Aircraft noise [13]. Flexer, C., Richards, C., Buie, C., &
and the quality of life of community Brandy, W. (1994). Making the grade with
residents around Port Harcourt amplification in classrooms. Hearing
international airport, South-South Nigeria. Instruments, 45(10), 24 – 26.
Journal of Environment and Earth [14]. Klatte, M. And Hellbruck,J. (2010). Effects
Science,Vol. 2, No 5. of classroom acoustics on performance and
[3]. Aniefiok Akpan et al (2012). Dose- Effect wellbeing in elementary school children: A
relationship on annoyance and sleep field study. Inter noise, Lisbon, Portugal.
disturbance due to industrial and aircraft [15]. Ko, N. (1979). Response of teachers to
noise in Calabar, Cross River State, South- aircraft noise. Journal of Sound and
South Nigeria. Innovative Systems Design Vibration, 62, 277 – 292.
and Engineering, Vol. 3, No. 11 [16]. Rosenberg, G., Allen, L. Redmond, B.,
[4]. Aniefiok Akpan et al (2012). Study of Phillips, J., & Stigers, K. (1995).
Noise pollution during pre-carnival, Improving classroom acoustics, listening,
carnival and post-carnival festivals in and learning with FM soundfield
Calabar municipality, Calabar, Cross amplification. Poster Presentation at the
Rivers State, South-South Nigeria. Prime American Academy of Audiology
Journals, Vol. 2 (10), pp 373-377 Convention, Dallas, TX.
[5]. Beattie, R. C., & Zipp, J. A. (1990). Range [17]. Sabine, W. (1964). Collected papers on
of intensities yielding PB max and the acoustics. Dover Publications.
threshold for monosyllabic words for [18]. Sapienza, C, M., Crandell, C. C., & Curtis,
hearing-impaired subjects. Journal of B. (1999). Effects of sound-field frequency
Speech and Hearing Disorders, 55, 417 – modulation amplification on reducing
426. teachers’ sound pressure level in the
[6]. Bess, F. (1985). The minimally hearing- classroom. Journal of Voice, 3, 375 – 381.
impaired child. Ear and Hearing, 6, 43 – [19]. Siebein, G., Crandell, C., & Gold, M.
47. (1997). Principles of classroom acoustics:
[7]. Crandell, C. C., Smaldino, J. J., & Flexer, Reverberation. Educational Audiology
C. (1995). Sound-field fin applications: Monographs, 5, 32 – 43.
Theory and practical applications. San [20]. Wolgemuth, K. S., Kamhi, A. G., & Lee,
Diego: Singular. R. F. (1999). Metaphor performance in
[8]. Crandell, C., & Smaldino, J. (1994). The children with hearing impairment.
importance of room acoustics. In R. Tyler Language Speech, and Hearing Services in
& D. Schum (Eds.), Assistive listening Schools, 29, 216 – 231.
1486 | P a g e