More Related Content
More from hydrologyproject0
More from hydrologyproject0 (20)
Nia nsa
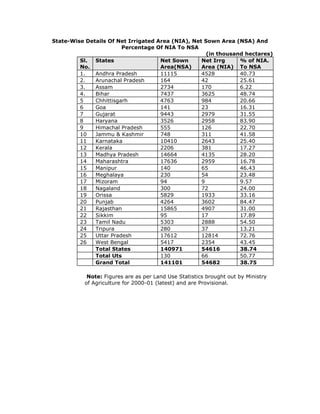
- 1. State-Wise Details Of Net Irrigated Area (NIA), Net Sown Area (NSA) And
Percentage Of NIA To NSA
(in thousand hectares)
Sl.
No.
States Net Sown
Area(NSA)
Net Irrg
Area (NIA)
% of NIA.
To NSA
1. Andhra Pradesh 11115 4528 40.73
2. Arunachal Pradesh 164 42 25.61
3. Assam 2734 170 6.22
4. Bihar 7437 3625 48.74
5 Chhittisgarh 4763 984 20.66
6 Goa 141 23 16.31
7 Gujarat 9443 2979 31.55
8 Haryana 3526 2958 83.90
9 Himachal Pradesh 555 126 22.70
10 Jammu & Kashmir 748 311 41.58
11 Karnataka 10410 2643 25.40
12 Kerala 2206 381 17.27
13 Madhya Pradesh 14664 4135 28.20
14 Maharashtra 17636 2959 16.78
15 Manipur 140 65 46.43
16 Meghalaya 230 54 23.48
17 Mizoram 94 9 9.57
18 Nagaland 300 72 24.00
19 Orissa 5829 1933 33.16
20 Punjab 4264 3602 84.47
21 Rajasthan 15865 4907 31.00
22 Sikkim 95 17 17.89
23 Tamil Nadu 5303 2888 54.50
24 Tripura 280 37 13.21
25 Uttar Pradesh 17612 12814 72.76
26 West Bengal 5417 2354 43.45
Total States 140971 54616 38.74
Total Uts 130 66 50.77
Grand Total 141101 54682 38.75
Note: Figures are as per Land Use Statistics brought out by Ministry
of Agriculture for 2000-01 (latest) and are Provisional.