Download to read offline


![32
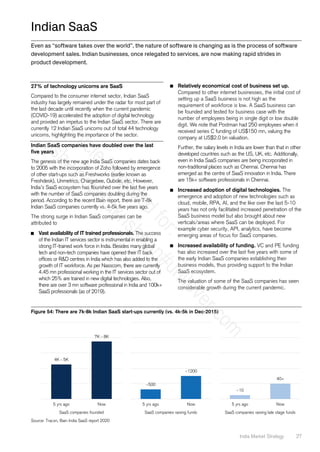
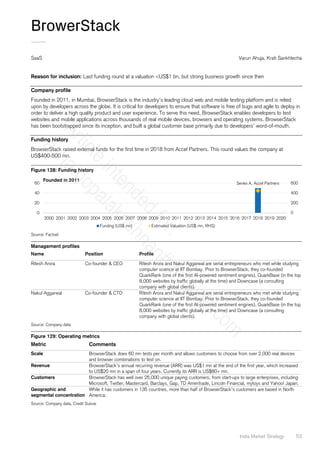
High unorganised contribution presents strong growth
prospects for online platforms
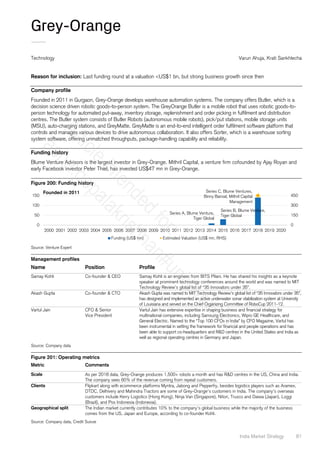
One of the key unique aspects of the India retail market is the
higher contribution from the unorganised sector especially in
the grocery space. The unorganised segment is more than
80% of the total Indian retail market while the same for
grocery is c.96%. Also, the online contribution in grocery is in
low single digit while in non-grocery the online contribution is
in the teens. We note that grocery’s share of the total retail
market was c.65% in 2020 increasing from c.60% in 2019.
With total retail market growth due to go back to 9-10% by
2021, we believe the e-commerce market size in India can be
c.US$100 bn by 2025, representing c.10% total retail sales.
Given massive growth opportunities in the grocery vertical, the
sector has seen the emergence of many vertical players—Big
Basket, Grofers, Nykaa, etc. Even established horizontal
companies, such as Flipkart and Amazon, are making increasing
investment in to the segment. The other key theme is hyperlocal
or modernisation of mom-and-pop stores so as to provide
inventory fulfilment and enabling them to do last mile delivery.
Reliance Industries is looking to play a big role in the segment.
We expect e-commerce to remain one of the largest sub-
segments of India’s internet sector due to the strong growth
prospects in organised Indian retail and, thus, support
emergence of more unicorns in the sector.
Figure 67: E-commerce’s contribution to FMCG sales has
inched up in 2020
Figure 68: And also has the share of online retail spend
for SBI cards
Source: Nielsen, Credit Suisse Source: SBI Cards, Credit Suisse
Figure 69: Unorganised segment is more than 80% of
the total Indian retail market…
Figure 70: …while the same for grocery is c.96%.
Source: Euromonitor, IBEF, Credit Suisse Source: Euromonitor, Credit Suisse
Figure 71: Online contribution in grocery is the lowest Figure 72: E-commerce market size in India can
potentially be c.US$100 bn by 2025
Source: Euromonitor, Credit Suisse Source: Euromonitor, BCG, Credit Suisse]
0
2
4
6
8
10
1QCY20 3QCY20
All India Metros
Vaue contribution of E-commerce to FMCG Sales
0%
10%
20%
30%
40%
50%
60%
FY17 FY18 FY19 FY20 1H21
Share of online retail spends
84%
9%
7%
Unorganised
Organised
e-commerce
Non-Grocery
34%
Traditional
96%
Modern
3%
Online
1%
Grocery
66%
17%
1%
7%
% online,
Grocery
% online,
Non-Grocery
% online,
Total retail
sales
42
101
0
200
400
600
800
1,000
1,200
2020 2025E
Offline Online
640
1,007
5-year
CAGR of
9.5%
Penetration
6.5%
Penetration
10.0%
US$ bn
A
r
t
i
c
l
e
i
n
t
e
n
d
e
d
f
o
r
:
a
s
h
a
.
g
o
p
a
l
a
k
r
i
s
h
n
a
n
#
u
n
i
l
e
v
e
r
.
c
o
m](https://image.slidesharecdn.com/indias100unicorns-210724041519/85/India-s-100-unicorns-32-320.jpg)


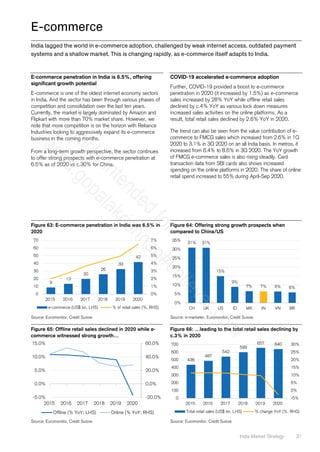
![India Market Strategy 127
Sri Chaitanya
Education Varun Ahuja, Krati Sanklecha
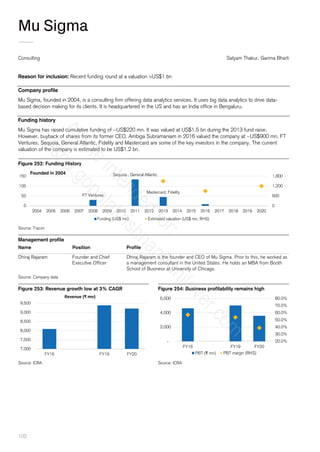
Reason for inclusion: Valuation >US$1 bn at latest EBITDA and multiple
Company profile
Sri Chaitanya Group is engaged in providing educational services. It operates under the name Sri Chaitanya Educational
Institutions. It provides coaching for entrance exams like Indian Institute of Technology joint entrance exam (IIT-JEE), pre-
medical test (PMT), chartered accountancy, Indian administrative service (IAS) exams, and the like. The group also operates
private schools, junior colleges, a] chartered accountancy academy and an Indian administrative service academy. The
company was founded in 1986 and is based in Hyderabad, Telangana.
Funding history
NA
Management profiles
Name Position Profile
Dr BS Rao Founder and Chairman A practicing doctor, Dr BS Rao opened the first school in 1986 with just one
branch of 56 students.
Sushma Bopanna Academic Director Mrs Sushma Bopanna completed her BTech from BITS Pilani and her master’s in
IT from US University.
Source: Company data
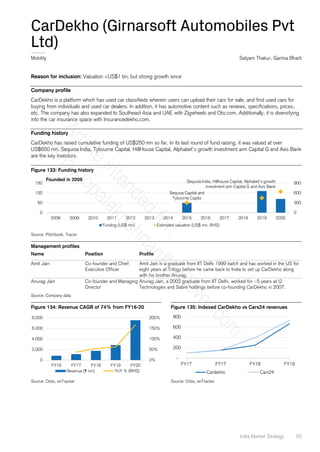
Figure 316: Number of universities growing at a CAGR of
8%
Figure 317: Education industry grew by 10% in India
Source: Company data, Credit Suisse Source: Company data, Credit Suisse
0
200
400
600
800
1,000
1,200
FY16 FY17 FY18 FY19
Number of Universities in India
0
20
40
60
80
100
FY18 FY19
Number of Universities in India
A
r
t
i
c
l
e
i
n
t
e
n
d
e
d
f
o
r
:
a
s
h
a
.
g
o
p
a
l
a
k
r
i
s
h
n
a
n
#
u
n
i
l
e
v
e
r
.
c
o
m](https://image.slidesharecdn.com/indias100unicorns-210724041519/85/India-s-100-unicorns-127-320.jpg)


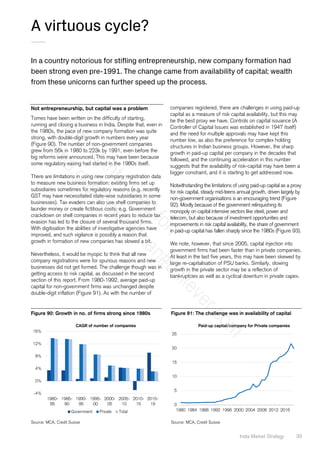
![136
Vishal Mega Mart
Consumer Discretionary Arnab Mitra, Pratik Rangnekar
Reason for inclusion: Valuation <US$1 bn, but strong growth
Company profile
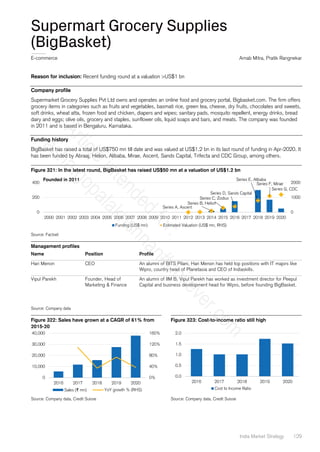
Founded by Mr Ram Chandra Agarwal in 1994, Vishal Mega Mart started off as a value retailer franchising out ~170 stores
across India mainly outside the metros. However, saddled with debt, the company was sold to TPG Private Equity and
Shriram Group for Rs700 mn in a fire sale. In 2018, the company changed hands again with Kedaara Capital and Global
investment firm Partners Group acquiring it. The network has grown to 375 franchised stores across 241 cities mainly in
north, south and east of India with an area of 6.4 mn sq ft. Its presence in under-penetrated markets and a value positioning
have driven a 35% CAGR over the last three years with a wide offering of private label fast fashion and other general
merchandise and grocery.
Funding history
Vishal Mega Mart was sold to TPG Private Equity and Shriram Group for Rs700 mn in a fire sale. In 2018, the company
changed hands again with Kedaara Capital and global investment firm, Partners Group, acquiring it for a deal reported in
media at ~US$700 mn (source: Mint).
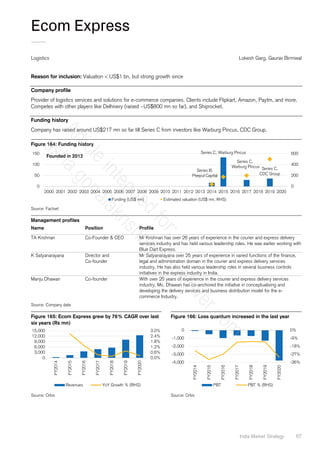
Figure 339: Kedaara Capital and Partners Group acquired Vishal from TPG capital in 2018
Source: Factset
Management profile
Name Position Profile
Gunendar Kapoor CEO Has been the CEO since TPG took over and has overseen a turnaround in the
company. Prior to this he has been a veteran in Unilever/HUL for 12 years and
thereafter was the CEO at Reliance Retail for c.4 years.
Source: Company data
Figure 340: Revenues have grown at a 16% CAGR over
FY15-19
Figure 341: PAT margin has expanded sharply as well
(EBITDA = US$ mn]
Source: Company data, Euromonitor Credit Suisse Source: Company data, Credit Suisse
TPG Capital purchased in
slump sale
Kedaara Capital and
Partners Group
0
400
800
1,200
0
1
1
2
2000 2001 2002 2003 2004 2005 2006 2007 2008 2009 2010 2011 2012 2013 2014 2015 2016 2017 2018 2019 2020
Funding (US$ mn) Estimated Valuation (US$ mn, RHS)
Founded in 1994
30%
32%
34%
36%
38%
0
100
200
300
400
500
600
2017 2018 2019
Revenues (US$ m) % YoY (RHS)
9%
10%
10%
11%
0
20
40
60
2019 2020
EBITDA EBITDA % (RHS)
A
r
t
i
c
l
e
i
n
t
e
n
d
e
d
f
o
r
:
a
s
h
a
.
g
o
p
a
l
a
k
r
i
s
h
n
a
n
#
u
n
i
l
e
v
e
r
.
c
o
m](https://image.slidesharecdn.com/indias100unicorns-210724041519/85/India-s-100-unicorns-136-320.jpg)


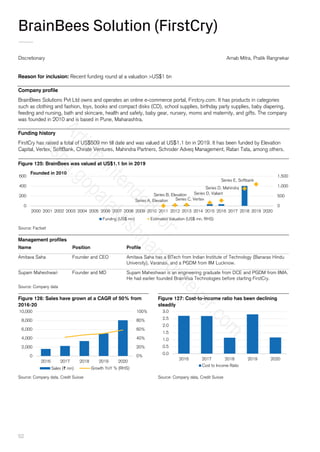
![India Market Strategy 145
Companies Mentioned (Price as of 08-Mar-2021)
Alphabet (GOOGL.OQ, $2007.5)
Disclosure Appendix
Analyst Certification
Neelkanth Mishra and Abhay Khaitan each certify, with respect to the companies or securities that the individual analyzes, that (1) the views
expressed in this report accurately reflect his or her personal views about all of the subject companies and securities and (2) no part of his or her
compensation was, is or will be directly or indirectly related to the specific recommendations or views expressed in this report.
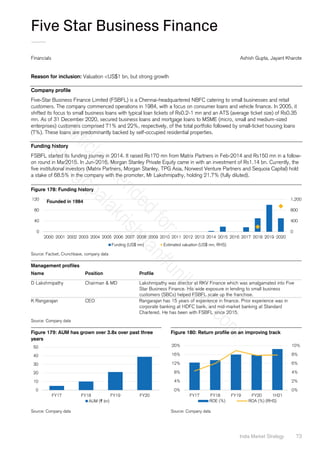
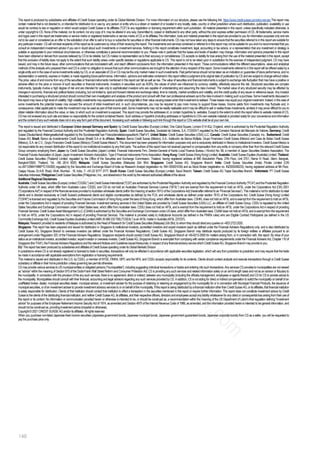
3-Year Price and Rating History for Alphabet (GOOGL.OQ)
GOOGL.OQ Closing Price Target Price
Date (US$) (US$) Rating
20-Apr-18 1077.32 1350.00 O
16-Jul-18 1196.51 1330.00
24-Jul-18 1258.15 1375.00
19-Oct-18 1105.18 1500.00
26-Oct-18 1083.75 1450.00
05-Feb-19 1151.87 1400.00
26-Jul-19 1245.22 1500.00
23-Oct-19 1257.63 1700.00
20-Apr-20 1261.15 1500.00
29-Apr-20 1342.18 1600.00
20-Jul-20 1563.84 1850.00
30-Oct-20 1616.11 1950.00
22-Jan-21 1892.56 2000.00
03-Feb-21 2058.88 2360.00
* Asterisk signifies initiation or assumption of coverage.
As of December 10, 2012 Analysts’ stock rating are defined as follows:
Outperform (O) : The stock’s total return is expected to outperform the relevant benchmark* over the next 12 months.
Neutral (N) : The stock’s total return is expected to be in line with the relevant benchmark* over the next 12 months.
Underperform (U) : The stock’s total return is expected to underperform the relevant benchmark* over the next 12 months.
*Relevant benchmark by region: As of 10th December 2012, Japanese ratings are based on a stock’s total return relative to the analyst's coverage universe which
consists of all companies covered by the analyst within the relevant sector, with Outperforms representing the most attractive, Neutrals the less attractive, and
Underperforms the least attractive investment opportunities. As of 2nd October 2012, U.S. and Canadian as well as European (excluding Turkey) ratings are
based on a stock’s total return relative to the analyst's coverage universe which consists of all companies covered by the analyst within the relevant sector, with
Outperforms representing the most attractive, Neutrals the less attractive, and Underperforms the least attractive investment opportunities. For Latin America,
Turkey and Asia (excluding Japan and Australia), stock ratings are based on a stock’s total return relative to the average total return of the relevant country or
regional benchmark (India - S&P BSE Sensex Index); prior to 2nd October 2012 U.S. and Canadian ratings were based on (1) a stock’s absolute total return
potential to its current share price and (2) the relative attractiveness of a stock’s total return potential within an analyst’s coverage universe. For Australian and
New Zealand stocks, the expected total return (ETR) calculation includes 12-month rolling dividend yield. An Outperform rating is assigned where an ETR is
greater than or equal to 7.5%; Underperform where an ETR less than or equal to 5%. A Neutral may be assigned where the ETR is between -5% and 15%. The
overlapping rating range allows analysts to assign a rating that puts ETR in the context of associated risks. Prior to 18 May 2015, ETR ranges for Outperform and
Underperform ratings did not overlap with Neutral thresholds between 15% and 7.5%, which was in operation from 7 July 2011.
Restricted (R) : In certain circumstances, Credit Suisse policy and/or applicable law and regulations preclude certain types of communications,
including an investment recommendation, during the course of Credit Suisse's engagement in an investment banking transaction and in certain
other circumstances.
Not Rated (NR) : Credit Suisse Equity Research does not have an investment rating or view on the stock or any other securities related to the
company at this time.
Not Covered (NC) : Credit Suisse Equity Research does not provide ongoing coverage of the company or offer an investment rating or
investment view on the equity security of the company or related products.
Volatility Indicator [V] : A stock is defined as volatile if the stock price has moved up or down by 20% or more in a month in at least 8 of the past
24 months or the analyst expects significant volatility going forward.
Analysts’ sector weightings are distinct from analysts’ stock ratings and are based on the analyst’s expectations for the fundamentals and/or
valuation of the sector* relative to the group’s historic fundamentals and/or valuation:
Overweight : The analyst’s expectation for the sector’s fundamentals and/or valuation is favorable over the next 12 months.
Market Weight : The analyst’s expectation for the sector’s fundamentals and/or valuation is neutral over the next 12 months.
Underweight : The analyst’s expectation for the sector’s fundamentals and/or valuation is cautious over the next 12 months.
*An analyst’s coverage sector consists of all companies covered by the analyst within the relevant sector. An analyst may cover multiple sectors.
Target Price Closing Price GOOGL.OQ
01- Jan- 2019 01- Jan- 2020 01- Jan- 2021
500
1,000
1,500
2,000
2,500
O U T PERFO RM
A
r
t
i
c
l
e
i
n
t
e
n
d
e
d
f
o
r
:
a
s
h
a
.
g
o
p
a
l
a
k
r
i
s
h
n
a
n
#
u
n
i
l
e
v
e
r
.
c
o
m](https://image.slidesharecdn.com/indias100unicorns-210724041519/85/India-s-100-unicorns-145-320.jpg)


This document lists and analyzes 100 Indian startup companies that have reached unicorn status, meaning a valuation of over $1 billion. It discusses how India's corporate landscape is being transformed by the rapid growth of startups in recent years. Key factors enabling this transformation include increased funding from investors, improved infrastructure and regulation, and growth in sectors like FinTech, EdTech, e-commerce, and pharmaceuticals/biotech. The document argues this trend could create a virtuous cycle of further startup growth and investment in India.