Call Girls Navi Mumbai Just Call 9907093804 Top Class Call Girl Service Avail...
105-26-Fortum-FCF.pdf
1. Auditor’s
report
Key
figures
Key figures
2010–2019
Proposal for the use of the profit
shown on the balance sheet
Quarterly financial
information
Parent company
financial statements
Investor
information
Operating and
financial review Notes 35
Consolidated
financialstatements
Balance sheet
Statement of comprehensive income Statement of changes in total equity Cash flow statement
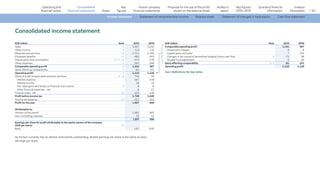
Income statement
EUR million Note 2019 2018
Sales 6 5,447 5,242
Other income 9 110 130
Materials and services 10 -2,721 -2,795
Employee benefits 11 -480 -459
Depreciation and amortisation 6, 17, 18 -575 -536
Other expenses 9 -591 -594
Comparable operating profit 6 1,191 987
Items affecting comparability 7 -81 151
Operating profit 6 1,110 1,138
Share of profit of associates and joint ventures 6, 19 744 38
Interest expense -167 -148
Interest income 28 34
Fair value gains and losses on financial instruments 8 8 -8
Other financial expenses - net 6 -15
Finance costs - net 12 -125 -136
Profit before income tax 1,728 1,040
Income tax expense 13 -221 -181
Profit for the year 1,507 858
Attributable to:
Owners of the parent 1,482 843
Non-controlling interests 25 15
1,507 858
Earnings per share for profit attributable to the equity owners of the company
(EUR per share) 14
Basic 1.67 0.95
As Fortum currently has no dilutive instruments outstanding, diluted earnings per share is the same as basic
earnings per share.
EUR million Note 2019 2018
Comparable operating profit 1,191 987
Impairment charges -8 -4
Capital gains and other 7 102
Changes in fair values of derivatives hedging future cash flow 8 -72 98
Nuclear fund adjustment -9 -45
Items affecting comparability 6, 7 -81 151
Operating profit 1,110 1,138
See4Definitions for key ratios
Consolidated income statement
2. Auditor’s
report
Key
figures
Key figures
2010–2019
Proposal for the use of the profit
shown on the balance sheet
Quarterly financial
information
Parent company
financial statements
Investor
information
Operating and
financial review Notes 37
Consolidated
financialstatements
Income statement Statement of comprehensive income Statement of changes in total equity Cash flow statement
Balance sheet
EUR million Note 31 Dec 2019 31 Dec 2018
ASSETS
Non-current assets
Intangible assets 17 1,143 1,087
Property, plant and equipment and right-of-use assets 18 10,123 9,981
Participations in associates and joint ventures 19 6,435 5,978
Share in State Nuclear Waste Management Fund 29 813 899
Other non-current assets 20 151 139
Deferred tax assets 28 77 70
Derivative financial instruments 4 180 229
Long-term interest-bearing receivables 21 651 683
Total non-current assets 19,571 19,065
Current assets
Inventories 22 230 233
Derivative financial instruments 4 131 326
Short-term interest-bearing receivables 21 384 409
Income tax receivables 28 133 172
Trade and other receivables 23 1,176 1,620
Deposits and securities (maturity over three months) 76 29
Cash and cash equivalents 1,356 557
Liquid funds 24 1,433 584
Total current assets 3,486 3,344
Assets held for sale 3 307 -
Total assets 23,364 22,409
Consolidated balance sheet
EUR million Note 31 Dec 2019 31 Dec 2018
EQUITY
Equity attributable to owners of the parent
Share capital 25 3,046 3,046
Share premium 73 73
Retained earnings 9,982 9,232
Other equity components -118 -510
Total 12,982 11,841
Non-controlling interests 26 252 236
Total equity 13,235 12,077
LIABILITIES
Non-current liabilities
Interest-bearing liabilities 27 6,118 5,007
Derivative financial instruments 4 137 362
Deferred tax liabilities 28 865 720
Nuclear provisions 29 813 899
Other provisions 30 87 91
Pension obligations 31 125 98
Other non-current liabilities 32 167 182
Total non-current liabilities 8,311 7,358
Current liabilities
Interest-bearing liabilities 27 570 1,086
Derivative financial instruments 4 252 829
Trade and other payables 33 943 1,058
Total current liabilities 1,766 2,973
Liabilities related to assets held for sale 3 52 -
Total liabilities 10,129 10,332
Total equity and liabilities 23,364 22,409
3. Auditor’s
report
Key
figures
Key figures
2010–2019
Proposal for the use of the profit
shown on the balance sheet
Quarterly financial
information
Parent company
financial statements
Investor
information
Operating and
financial review Notes 39
Consolidated
financialstatements
Income statement Balance sheet
Statement of comprehensive income Statement of changes in total equity Cash flow statement
EUR million Note 2019 2018
Cash flow from operating activities
Profit for the year 1,507 858
Adjustments:
Income tax expense 221 181
Finance costs - net 125 136
Share of profit of associates and joint ventures -744 -38
Depreciation and amortisation 575 536
Operating profit before depreciations (EBITDA) 1,685 1,674
Items affecting comparability 81 -151
Comparable EBITDA 1,766 1,523
Non-cash flow items -1 -90
Interest received 29 23
Interest paid -177 -171
Dividends received 239 61
Realised foreign exchange gains and losses 14 231
Income taxes paid -165 -94
Other items -13 -9
Funds from operations 1,691 1,474
Change in settlements for futures 356 -524
Change in working capital -33 -146
Net cash from operating activities 2,015 804
Cash flow from investing activities
Capital expenditures 17, 18 -695 -579
Acquisitions of shares 6 -107 -4,088
Proceeds from sales of fixed assets 35 38
Divestments of shares 53 259
Shareholder loans to associated companies and joint ventures 9 -24
Change in cash collaterals and restricted cash 311 -36
Change in other interest-bearing receivables 25 31
Net cash used in investing activities -369 -4,398
Consolidated cash flow statement
EUR million Note 2019 2018
Cash flow before financing activities 1,646 -3,594
Cash flow from financing activities
Proceeds from long-term liabilities 2,805 1,764
Payments of long-term liabilities -2,567 -586
Change in short-term liabilities -78 135
Dividends paid to the owners of the parent 14 -977 -977
Dividends paid to non-controlling interests -23 -5
Other financing items 1 -4
Net cash from/used in financing activities -839 326
Total net increase(+)/decrease(-) in liquid funds 806 -3,268
Liquid funds at the beginning of the year 584 3,896
Foreign exchange differences in liquid funds 44 -43
Liquid funds at the end of the year 1)
24 1,435 584
1) Includes cash balances of EUR 2 million relating to assets held for sale at 31 December 2019. See4Note 3 Acquisitions, disposals and assets held
for sale.
Realised foreign exchange gains and losses relate mainly to financing of Fortum’s Russian and Swedish subsidiaries and the fact
that the Group’s main external financing currency is EUR. The foreign exchange gains and losses arise from rollover of foreign
exchange contracts hedging these internal loans as major part of the forwards are entered into with short maturities i.e. less
than twelve months.
In Fortum's cash flow statement the daily cash settlements for futures are shown in cash flow from operating activities whereas
the changes in cash collaterals for forwards are included in cash flow from investing activities. The daily cash settlements are
included in trade and other receivables and the cash collaterals are included in the short-term interest-bearing receivables,
see4Note 21 Interest-bearing receivables for additional information.
Capital expenditures in cash flow do not include not yet paid investments. Capitalised borrowing costs are presented in
interest paid.
4. 1
2
3
4
5
6
7
8
9
10
11
12
13
14
15
16
17
18
19
20
21
22
23
24
25
26
27
28
29
30
31
32
33
34
35
36
37
38
39
40
1
2
3
4
5
6
7
8
9
10
11
12
13
14
15
16
17
18
19
20
21
22
23
24
25
26
27
28
29
30
31
32
33
34
35
36
37
38
39
40
34 Leases
ACCOUNTING POLICIES
The Group leases mainly office buildings and land areas. Until 31 December 2018, the Group's leases were classified as
operating leases under the previous accounting standard, IAS 17 Leases; from 1 January 2019, the Group recognises all leases,
with the exception of short-term (i.e. lease term less than 12 months) and low value leases, in line with IFRS 16 Leases as
right-of-use assets with a corresponding lease liability at the date at which the leased asset is available for use by the Group.
See4Note 1 Significant accounting policies for information on the change in lease accounting policy.
A contract is, or contains a lease if the Group has the right to control the use of an identified asset for a period of time in
exchange for consideration. When determining the lease term, the Group assesses the probability of exercising extension and
termination options over the non-cancellable period by considering all relevant facts and circumstances.
Right-of-use assets and lease liabilities are initally recognised on the consolidated balance sheet at future fixed lease
payments over the lease term. Lease payments are discounted to present value using an effective interest rate. Right-of-use
assets are depreciated on a straight-line basis over the lease term, and reviewed periodically for indication of impairment.
When the future lease payments are revised due to changes in index-linked considerations or the lease term changes,
the right-of-use asset and the corresponding lease liability is remeasured. Any differences arising on reassessments are
recognised in the consolidated income statement.
Interest expense on lease liabilities is presented within Interest expense in the consolidated income statement. In the
consolidated cash flow statement, the principal portion of the lease payment is presented under Payments of long-term
liabilities, and the interest portion as Interest paid under Funds from operations. Variable lease payments, as well as costs for
leases not capitalised due to exemptions in the standard, are presented in Other expenses.
33 Trade and other payables
EUR million 2019 2018
Trade payables 316 334
Accrued expenses and deferred income
Accrued personnel expenses 97 103
Accrued interest expenses 80 98
Contract liabilities 31 40
Other accrued expenses and deferred income 42 80
Other liabilities
VAT liability 54 34
Current tax liability 64 30
Advances received 78 110
Current provisions 1)
13 14
Other liabilities 168 214
BS Total 943 1,058
1) See4Note 30 Other provisions.
Contract liabilities comprise mainly of project and waste management services that are invoiced but not delivered
at the reporting date.
The management considers that the amount of trade and other payables approximates fair value.
Auditor’s
report
Consolidated
financial statements
Key
figures
Key figures
2010–2019
Proposal for the use of the profit
shown on the balance sheet
Quarterly financial
information
Parent company
financial statements
Investor
information
Operating and
financial review 108
Notes
Basis of preparation Income statement Off balance sheet items
Risks Group structure and related parties
Balance sheet
5. 1
2
3
4
5
6
7
8
9
10
11
12
13
14
15
16
17
18
19
20
21
22
23
24
25
26
27
28
29
30
31
32
33
34
35
36
37
38
39
40
1
2
3
4
5
6
7
8
9
10
11
12
13
14
15
16
17
18
19
20
21
22
23
24
25
26
27
28
29
30
31
32
33
34
35
36
37
38
39
40
Amounts recognised in consolidated financial statements
EUR million 2019
In consolidated Income Statement
Depreciation -18
Interest expense on lease liabilities -3
On consolidated balance sheet
Additions to right-of-use assets 38
Of which land 8
Of which buildings, plants and structures 27
Of which machinery and equipment 4
Carrying amount of right-of-use assets 114
Of which land 33
Of which buildings, plants and structures 70
Of which machinery and equipment 11
Lease liabilities 108
In consolidated cash flow statement
Cash outflow for leases -18
Lease commitments
The Group has EUR 22 million off-balance sheet future commitments for leases that have not commenced on 31
December 2019.
See4Note 1 Significant accounting policies,4Note 4 Financial risk management,4Note 18 Property, plant and
equipment and right-of-use assets, and4Note 27 Interest-bearing liabilities for more information.
35 Capital and other commitments
Capital commitments
EUR million 2019 2018
Property, plant and equipment 260 322
Capital commitments are off-balance sheet capital expenditures contracted for at the balance sheet date.
Other commitments
On 8 October 2019, Fortum entered into agreements to acquire all the shares in Uniper SE held by funds
managed by Elliott Management Corporation and its affiliates (Elliott) and Knight Vinke Energy Advisors Limited
and its affiliates (Knight Vinke), a total shareholding in excess of 20.5%. The transaction will be financed
with existing cash resources and committed credit facilities underwritten by Barclays Bank PLC. In the said
agreements Fortum has committed to paying the acquisition price of EUR 2.3–2.6 billion depending on the
amount of shares acquired.
Fortum has committed to provide a maximum of EUR 85 million to Voimaosakeyhtiö SF, for its participation in
the Fennovoima nuclear power project in Finland. Furthermore, Fortum's remaining direct commitment regarding
the construction of a waste-to-energy combined heat and power plant (CHP) in Kaunas, Lithuania is EUR 7 million
at maximum. The investment is made through Kauno Kogeneracinė Jėgainė (KKJ), a joint venture owned together
with Lietuvos Energija.
Fortum has also commited to provide a maximum of EUR 7 million to a joint venture with Numaligarh Refinery
Limited (NRL) and Chempolis to build and operate a biorefinery in Assam, India.
Teollisuuden Voima Oyj (TVO) is building Olkiluoto 3, the nuclear power plant, which is funded through external
loans, share issues and shareholder loans according to shareholders' agreement between the owners of TVO.
At end of December 2019, Fortum had EUR 170 million (2018: 170) outstanding receivables regarding Olkiluoto
3 and is additionally committed to provide at maximum EUR 63 million. TVO shareholder loan is classified as
participation in joint ventures.
In June 2018, the Swedish Government approved the legislation regarding Sweden’s national strategy for
implementation of the EU’s Water Framework Directive. The largest hydro industry companies will create a
common hydro-power fund to finance large parts of the environmental actions needed. The fund will have a total
financial cap of SEK 10 billion to be paid over a 20-year period, and the largest operators will contribute to the
fund proportionately based on their respective market share of hydro-power production. Fortum's share is 23% of
the funds' total financing.
Auditor’s
report
Consolidated
financial statements
Key
figures
Key figures
2010–2019
Proposal for the use of the profit
shown on the balance sheet
Quarterly financial
information
Parent company
financial statements
Investor
information
Operating and
financial review 109
Notes
Basis of preparation Income statement
Risks Group structure and related parties
Off balance sheet items
Balance sheet