FERC Staff Report on Underground Natural Gas Storage
1. C U R R E N T S TAT E O F A N D I S S U E S C O N C E R N I N G
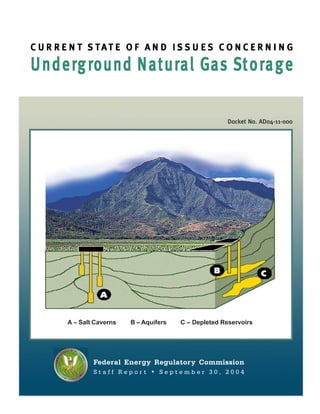
Under g r ound Natur al G as S t o r a g e
Docket No. AD04-11-000
A – Salt Caverns B – Aquifers C – Depleted Reservoirs
Federal Energy Regulatory Commission
Staff Report • September 30, 2004
Federal Energy Regulatory Commission • Staff Report • September 30, 2004
2. Current State of and Issues Concerning
Underground Natural Gas Storage
TABLE OF CONTENTS
Summary of Key Findings 1
Introduction 2
I. Background and History of Underground Storage 4
Traditional Underground Storage 4
The Nontraditional Usage of Underground Storage 4
Three Types of Underground Gas Storage Facilities 4
Summary of Physical Characteristics of Traditional Storage 5
Operating Characteristics of the Types of Underground Storage 6
Nationwide Storage Capacity 7
Actual Storage Operating Capacities 9
Storage Capacity Summary 10
Regional Distribution of Underground Storage 10
The Commission’s Role in Underground Storage 12
Current Developments Regarding Underground Storage 14
Problems with Underground Storage Projects 15
Need for More Storage 15
Staff Observations on the Current State of Underground Storage 16
II. Economics of Underground Storage 18
Storage Economics 18
Storage Development Costs 18
The Value of Storage 19
Economic Summary and Conclusions 24
III. Possible Options for Stimulating Underground Storage Development 26
Cost-Based Rate Options for Storage Development 27
Market-Based Rates 29
Revise or Waive Commission Policies 31
Underg Tar Ra
ariff
Appendix A – Underg round Gas Storage Tariff Rates 32
Appendix B – Example of State Regulatory Approach 33
Federal Energy Regulatory Commission • Staff Report • September 30, 2004
3. K E Y FI N D I N G S:
• Under average conditions and from a nationwide perspective, storage appears to be
adequate to meet seasonal demand; however, continued commodity price volatility
indicates that more storage may be appropriate.
• Storage may be the best way of managing gas commodity price, so the long-term
adequacy of storage investment depends on how much price volatility customers
consider “acceptable.”
• A study performed by the National Petroleum Council indicates that there may be a
need in North America for 700 Bcf of new storage between now and 2025. Another
study, by The INGAA Foundation, concludes that 651 Bcf of new storage may be
needed in the United States and Canada by 2020. In addition, there may be certain
region-specific (e.g., Southwest, New England) needs for new storage.
• Geology, economics and environmental impacts may stall development and could
jeopardize achieving forecasted capacity needs.
• Reengineering of existing storage fields is underway in order to improve working
gas capability – application of new engineering techniques can help to ensure that
development of new fields stays on track.
• Four key methods that market participants use to value storage (e.g., cost of service;
least-cost planning; seasonal valuation, or intrinsic; and, option-based valuation,
or extrinsic) do not always reach the same result because they are based on differing
views of the need and reasons for storage.
• Storage projects in certain geographic areas (e.g., Southwest) often fail the
Commission’s market-based rates tests.
• Creative ratemaking approaches may encourage storage development.
• Creative certificate and policy choices may also encourage storage development by
reducing costs and permitting additional opportunities to generate revenues.
Federal Energy Regulatory Commission • Staff Report • September 30, 2004 1
4. INTRODUCTION
This report addresses three aspects of the state of and issues concerning the underground storage of natural gas: the
history of storage development and its physical characteristics and the need for storage; the economics of underground
storage; and, ratemaking options for future storage development.
The underground storage of natural gas has historically been critical in assuring that overall demands and use-
specific requirements of natural gas customers are met. The Natural Petroleum Council’s (NPC) September 2003
report1 noted that the demand for storage is expected to increase in the foreseeable future. Specifically, the NPC
foresees the need for an additional 700 Bcf of new storage in the United States and Canada over the next 20 years,
which translates to an average of 35 Bcf of new storage being added each year.
Presently, from a national perspective and assuming the cost of service. Accordingly, there may be a public
average weather, storage appears to be adequate. policy interest in encouraging storage development.
However, simply considering average demand and
national balances does not tell the complete story. For While the desire of project sponsors to build new storage
some market areas, particularly those that are distant from in the Southwest and Northeast has been demonstrated
supply sources, the development of new storage by the various applications seeking to develop projects,
infrastructure could cost-effectively help customers the development has not occurred for economic,
maintain service reliability and manage commodity price environmental, geological and political reasons.
volatility.
Specifically, in the Southwest there have been three recent
In addition, gas prices have increased with the decline in storage projects that, for various reasons, have not been
gas production. During the “gas bubble” of the 1980s- developed. The Desert Crossing storage project, although
1990s, production increased in response to short-term initiated, has not been further pursued; while no formal
spikes in demand. Production increases coupled with reason for not pursing development was provided, market
demand decreases in this same period allowed supply to (contractual) support did not materialize and
meet demand, even during peak periods, without environmental concerns associated with certain aspects
significant price spikes. As production declined or of the proposal were raised.3 The Copper Eagle storage
flattened over the past few years, production spikes can project, located on the outskirts of Luke Air Force Base,
no longer be relied upon to meet demand spikes. As a became the subject of security and safety concerns; plans
result, commodity price swings manage demand for its development have been delayed following
fluctuations.2 expressions of concern by the State of Arizona legislature.4
The sponsor of the Red Lake storage project did not pursue
Building new storage may be an effective way to reduce development owing to Red Lake’s unwillingness to go
commodity price volatility. Demand for storage services forward without authorization for market-based rates. Its
to manage price volatility will depend on customer inability to demonstrate a significant lack of market power
tolerance for price risk, how that price risk is valued, and resulted in the Commission’s decision to deny market-
1
Balancing Natural Gas Policy – Fueling the Demands of a Growing Economy, National Petroleum Council (2003).
2
See Report on the Natural Gas Price Spike of February 2003, Staff Investigating Team, July 23, 2003.
3
Desert Crossing Gas Storage and Transportation System LLC, 98 FERC ¶ 61, 277 (2002).
4
Copper Eagle Gas Storage L.L.C., 97 FERC ¶ 62,193 (2001); Copper Eagle Gas Storage, L.L.C., 99 FERC ¶ 61,270 (2002).
2 Current State of and Issues Concerning Underground Natural Gas Storage
5. based rate authority.5 Evidence of the desire for storage and, least-cost planning seasonal arbitrage, or intrinsic;
in the Southwest was demonstrated in the Southwestern and option-based or extrinsic) do not always reach the
Gas Storage Conference held on August 23, 2003, in Phoenix, same result because they are based on differing views of
Arizona.6 There, participants, including the Chairman the need and reasons for storage.
of the Arizona Corporation Commission, expressed
unanimous support for the proposition that development But regulatory requirements may prove to be a financial
of new storage in the region was needed. barrier inhibiting development in some regions. Storage
developers have claimed a preference for market-based
In the Northeast, two major projects, the NE Hub storage rates. And, in the markets where new storage developers
project and the Avoca storage project, similarly never came cannot assert market power, market-based rates have been
into service, and the Wyckoff/Greyhawk storage project allowed.
has been delayed, although they all were certificated by
the Commission, but encountered various technical and Current Commission rate policy provides considerable
economic problems.7 While these projects were located flexibility to design cost-based rates, negotiated rates and
in New York state in areas where the geology is conducive market-based rates. Additional cost-based rates and
to the development of underground storage, the geology market-based rate alternatives could be explored to
in other parts of the Northeast is not practical for the encourage additional storage development. Further,
development of underground storage. revised storage project certification requirements and
procedures could potentially reduce costs and offer the
As discussed in more detail in this report, there are other potential to generate additional revenues
approaches to achieving the development of new storage
using both new and existing fields. For example, This report sets out some of these approaches and also
reengineering of existing storage fields is an ongoing describes some non-cost-based approaches that may be
exercise to improve working gas capability. In addition, useful in addressing financial obstacles to new storage
the application of new engineering techniques can prove development.
useful in achieving greater deliverability from existing
fields. These techniques also help to ensure the efficient
development of new fields in areas geologically conducive
to storage, stays on track.
Through new design approaches and the application of
advanced engineering techniques, certain physical
barriers to the development of new storage can potentially
be overcome. However, as discussed later in this report,
long-term market price signals appear to be weak for new
storage development. Further, the four key methods that
market participants use to value storage (cost of service;
5
Red Lake Gas Storage, L.P, 103 FERC ¶ 61,277 (2003); Red Lake Gas Storage, L.P., 102 FERC ¶ 61,077 (2003).
6
Southwestern Gas Storage Technical Conference, Docket No. AD03-11-000, Notice of Technical Conference (2003).
7
NE Hub Partners, L.P., 105 FERC ¶ 61,334 (2003); Avoca Natural Gas Storage, 88 FERC ¶ 62,245 (1999); Wyckoff Gas Storage Company, LLC, 105 FERC
¶ 61,027 (2003).
Federal Energy Regulatory Commission • Staff Report • September 30, 2004 3
6. B ACKGROUND AND HISTORY OF UNDERGROUND STORAGE
Natural gas storage facilities are used to meet gas demand measuring facilities, compressors, etc. Underground
peaks which exceed production and long-haul pipeline storage fields come in three basic types: depleted gas/oil
throughput. Increasingly, storage also plays a variety of reservoirs, salt caverns, and aquifers. Access to at least
roles helping market participants manage pipeline one major transportation pipeline to receive gas or deliver
imbalance charges and daily and seasonal price volatility. gas is, of course, a complementary requirement.
When cold weather or other market conditions create
more demand for gas than domestic production or imports The Nontraditional Usage of Underground
can satisfy, gas that has been put in storage can be Storage
withdrawn to make up the difference. While natural gas
is also stored for peak daily and hourly uses mainly by In addition to meeting the traditional seasonal load
distribution companies and liquefied natural gas (LNG) variations, the hourly swings, and emergency situations,
is stored briefly at import terminals, this report will focus storage is now being used to meet services created by both
on what is known as traditional underground gas storage, the unbundling of storage and by the new market
as well as, the new, nontraditional usage of storage conditions. Specifically, storage is being used to:
developed by the unbundling of storage and the new
market conditions. 1. Meet the regulatory obligation to ensure supply
reliability at the lowest cost to the ratepayer by
Traditional Underg round Storage
Underg maintaining specific levels of storage inventory.
2. Avoid imbalance penalties and facilitate daily
Geology is a key issue for determining the location of nomination changes, parking and lending
new traditional underground storage projects and the services, and simultaneous injections and
expansion of existing projects. There are areas that have withdrawals.
the geological characteristics to construct storage fields; 3. Ensure liquidity at market centers to help contain
other areas do not. Selection of any new underground price volatility and maintain orderly gas markets.
gas storage location depends on geological and 4. Offset the reduction in traditional supplies that
engineering properties of the storage reservoir, its size were relied upon to meet winter demand.
and its cushion, or base, gas requirements. It also depends 5. Increase the comfort inventory level of working
on the site’s access to transportation pipeline gas or top gas.
infrastructure, gas production sources, and to markets. 6. Offset, through the injection of more gas during
the shoulder months, the growing summer peak
The use of underground gas storage facilities in the natural impacts from electric generation.
gas industry is almost as old as the development of long 7. Support other electric generation loads.
distance transmission lines. The first high pressure
transmission lines began operations in 1891 with
successful construction of two parallel 120-mile, 8-inch Three Types of Underground Gas Storage Facilities
diameter lines from fields in northern Indiana to Chicago.
The first successful gas storage project was completed in Salt Cavern
1915 in Welland County, Ontario. The following year,
operations began in the Zoar field near Buffalo, New York. Some storage facilities use caverns that are leached or
mined out of underground salt deposits (salt domes or
Underground storage field operations include a host of salt formations). Salt cavern capacity typically is 20 percent
component and interdependent facilities. There are to 30 percent cushion gas and the remaining capacity is
injection/withdrawal wells, observation wells, water working gas. Working gas can generally be recycled 10-12
disposal wells, gathering lines, dehydration facilities, gas times a year in this type of storage facility. These facilities
4 Current State of and Issues Concerning Underground Natural Gas Storage
7. are characterized by high deliverability and injection
Types of Underground
capabilities and are mainly used for short peak-day
deliverability purposes (i.e., for fueling electric power Storage Capacity
plants).
Depleted Oil/Gas Reservoir
Depleted Aquifer
The most common underground gas storage facilities are Reservoir 10%
those that use deep underground natural gas or oil 86%
reservoirs that have been depleted through earlier
production. These reservoirs are naturally occurring, and
their potential as secure containers has been proven over
the millennia that the reservoirs held their original Salt Cavern
deposits of oil and gas. An underground gas storage field 4%
or reservoir is a permeable underground rock formation
(average of 1,000 to 5,000 feet thick) that is confined by Source: Energy Information Administration
impermeable rock and/or water barriers and is identified
by a single natural formation pressure. The working gas
capacity is typically 50 percent, with the rest of the capacity
maintained to ensure adequate deliverability. Gas is
typically withdrawn in the winter season and injected
during the summer season. This type of storage facility Summar y of Physical Characteristics of Traditional
Summary Physical Characteristics Traditional
haracteris
could be used for seasonal system supply or for peak-day Natural Gas Storage
demands.
( The following descriptions are from the Natural Gas
Aquifer Supply Association)9
A large number of reservoirs are bound partly or The most common form of underground storage consists
completely by water-bearing rocks called “aquifers.” The of depleted gas/oil reservoirs. Depleted reservoirs are
nature of the water in the aquifer may vary from fresh to those formations that have already been tapped of all
nearly saturated brines. Aquifer storage facilities typically their recoverable hydrocarbons. This leaves an
have high cushion gas requirements, ranging between 50 underground formation geologically capable of holding
percent to 80 percent. However, they achieve high natural gas. In addition, using an already developed
deliverability rates, with gas injected in the summer season reservoir for storage purposes allows the use of the
and withdrawn in the winter. extraction and distribution equipment left over from when
the field was productive. Having this network in place
The following chart , based on the Department of Energy’s reduces the cost of converting a depleted reservoir into a
Energy Information Administration (EIA) final 2001 data, storage facility. Depleted reservoirs are also attractive
shows that depleted reservoirs are the dominant type of because their geological characteristics are already well
underground storage based on total capacity. These known. Of the three types of underground storage,
percentages have slightly changed using 2002 EIA data, depleted reservoirs, on average, are the cheapest and
which are not yet final.8 easiest to develop, operate and maintain.
8
Form EIA-191, Monthly Underground Gas Storage Report.
9
See NGSA’s Web site at http://www.naturalgas.org/naturalgas/storage.asp
Federal Energy Regulatory Commission • Staff Report • September 30, 2004 5
8. Aquifers are underground permeable rock formations that (2) the flow capacity of the wells, and (3) compression
act as natural water reservoirs. However, in certain requirements when injecting gas into the reservoir or
situations, these water-containing formations may be delivering to market. Normally gas and oil fields have
reconditioned and used as natural gas storage facilities. pressures at discovery in the range of 0.43 to 0.52 pounds
Because they are more expensive to develop than depleted per square inch per foot of depth. The highest pressure
reservoirs, these types of storage facilities are usually used level possible normally will provide the maximum
only in areas where there are no nearby depleted storage capacity and the wells will have the highest flow
reservoirs. Traditionally, these facilities are operated with capacity.
a single winter withdrawal period, although they may be
used to meet peak load requirements as well. Aquifers Peak-day or seasonal deliverability is directly related to
are the least desirable and most expensive type of natural storage volume vs. storage pressure. Required storage
gas storage facility for a number of reasons. First, the deliverability services (daily or seasonal volumes) require
geological characteristics of aquifer formations are not as maximum storage pressure and gas-in-place volumes prior
thoroughly known as are depleted reservoirs. A to the withdrawal season.
significant amount of time and money goes into
discovering the geological characteristics of an aquifer and Therefore, the main issues are how much gas can be carried
determining its suitability as a natural gas storage facility. over from year to year, how long the gas can remain in
Also, the cushion gas requirement for aquifers is higher the reservoir prior to being turned over and how soon
than for depleted oil/gas reservoirs. can the capacity be refilled. These problems are not based
on some theoretical behavior, but instead are based on
Underground salt formations offer another option for experience under a variety of turnover and injection
natural gas storage. These formations are well suited to conditions.
natural gas storage because salt caverns, once formed,
allow little injected natural gas to escape from the It is operationally improper to simply let the gas sit in
formation unless specifically extracted. The walls of a salt any storage field. If working gas is not recycled properly,
cavern also have the structural strength of steel, which it will move from higher pressure areas of the storage
makes it resilient to reservoir degradation over the life of field to lower pressure areas, move into tighter formations
the storage facility. Salt caverns are formed out of existing or migrate to a point that will result in an increase in
salt deposits. These underground salt deposits may exist cushion gas requirements or gas loss.
in two possible forms: salt domes and salt beds. Salt domes
are thick formations created from natural salt deposits The following table summarizes our understanding of how
that, over time, move up through overlying sedimentary the three types of storage fields are generally operated.
layers to form large dome-like structures. Salt beds are Less cushion gas is needed for salt caverns and they can
shallower, thinner formations. Because salt beds are wide be filled and emptied much more frequently than aquifers
and thin, salt caverns in them are more prone to or depleted reservoirs. For aquifers or depleted reservoirs,
deterioration and may also be more expensive to develop the injection period usually corresponds with the months
than salt domes. of April through October (214 days), while the withdrawal
period is usually the months of November through March
Operating Characteristics of the Types of (151 days). Storage operators must use their best geologic
Underground Storage and engineering judgment to vary from this schedule.
Early season cold weather can reduce storage gas in place
The pressure range in a depleted reservoir for the storage and deliverability, while late season cold weather can
operating cycle depends upon (1) the safe upper limit of reduce the next season’s required injections in terms of
the reservoir pressure (bottom hole or surface pressure), volumes and days.
6 Current State of and Issues Concerning Underground Natural Gas Storage
9. Gas Storage Facility Operations
Cushion to Working Injection Period Withdrawal Period
Type
Gas Ratio (Days) (Days)
Aquifer Cushion
50% to 80% 200 to 250 100 to 150
Depleted Oil/Gas 200 to 250
Cushion 50% 100 to 150
Reservoirs
Cushion 20 to 40 10 to 20
Salt Cavern
20% to 30%
Source: Analysis of FERC filings
Nationwide Storage Capacity
Because not all storage is under the Commission’s the 8 Tcf level for the past eight years (8 to 8.4 Tcf), while
jurisdiction, we have to look to other sources of for the same period, the EIA reports that working gas
information to get nationwide totals of storage capacity. storage capacity has varied between 4.4 and 4.7 Tcf.
The EIA reports that as of 2002 (the latest data available),
interstate pipelines operated nearly 55 percent of the Using a different survey, the Office of Fossil Energy –
nation’s gas storage capacity10 but had contractual rights which, like EIA, also is in the Department of Energy –
to use only 8 percent of the working gas capacity for their reported that as of 2003 there were 110 underground gas
own purposes. Local distribution companies (LDCs) and storage operators that maintain and operate 415
intrastate pipeline companies operated about 35 percent underground gas storage facilities with a working gas
of working gas capacity and independent operators capacity of 3.9 Tcf in this country. Of this total number of
operated about 10 percent of working gas capacity. facilities, 201 are FERC-jurisdictional, controlled by 43
However, most of the pipeline’s storage capacity, about operators. The total FERC-jurisdictional working gas
73 percent, is contractually committed to LDCs. Marketers capacity is 2.5 Tcf. Close to half of all the storage capacity
also hold a significant share of storage capacity under is located in the Midwest. The graph on the following
contract, about 15 percent. The total maximum U.S. page shows the relatively stable amount of storage capacity
natural gas storage capacity (cushion, or base, gas plus from 1997 to present, based on EIA’s data.
working gas) reported to the EIA fluctuated slightly above
10
Form EIA-191, Monthly Underground Gas Storage Report.
Federal Energy Regulatory Commission • Staff Report • September 30, 2004 7
10. Volumes of Underground Natural Gas Storage
9.00
8.00
7.00
6.00
5.00
Tcf
4.00
3.00
2.00
1.00
0.00
1997 1998 1999 2000 2001 2002 2003 2004
Northeast Midwest Southeast West Total U.S.
Source: U.S. Department of Energy, Office of Fossil Energy
However, total reported storage capacity has never really years, the staff estimates that there is as much as 600 Bcf of
been tested with operating experience. Thus, the value potential working gas capacity available within existing
that defines “full” when determining the total working storage fields for future use. Thus, staff estimates the total
gas capacity is not known exactly. Even the EIA’s “Basics U.S. potential working gas capacity to be 3.6 to 3.8 Tcf.
of Underground Natural Gas Storage” discusses three Based on these estimations, there is 200 Bcf to 500 Bcf of
different approaches to measuring “percent full” of U.S. potential working gas capacity beyond the presently
natural gas storage. Based on our interpretation of proven 3.5 Tcf of working gas that could be reengineered
historical data, staff believes there is a total practical storage and used.
operating capacity of 7.6 Tcf, of which 3.5 Tcf 11 is working
gas capacity and the remaining 4.1 Tcf is cushion gas. The Another technical point is that storage working gas
American Gas Association (AGA) reported that the largest capacity is directly related to the availability of supply. If
working gas capacity held in storage during a given time there is sufficient gas supply available during the early
period was 3,294 Bcf. Therefore, based on EIA data of injection season when storage pressures are lowest, the
total storage capacity being at least 8.2 Tcf for several recent storage operators could inject at the highest rates and re-
11
Actual total operating capacity reported by EIA monthly (2001-02 withdrawal season). However, the total potential working gas capacity is
estimated by EIA to be 3.9 Tcf, thus we would accept that working gas could be 3.5 Tcf to 3.9 Tcf.
8 Current State of and Issues Concerning Underground Natural Gas Storage
11. pressurize their storage reservoirs to be ready for Actual Storage Operating Capacities
withdrawal season, which usually begins November 1
each year. As storage reservoir pressures increase, gas-in- As shown below, based on historic EIA data, cushion gas
place volume also increases and the injection rate declines averaged about 54 percent of the total operating capacity
gradually in late injection season. Therefore, the injection from 1975 through 1991. In 1992, cushion gas began to
rate is higher at the beginning of injection season and increase, reaching 61 percent of the total operating
lower at the end of injection season. The withdrawal rate capacity in 2000. While cushion gas has been increasing,
is highest at the end of injection season, when storage working gas capacity has been decreasing. This increase/
reservoir pressure is highest. Storage operators estimate decrease of cushion and working gas capacity could
the volume of supply needed for each season and they try represent the reclassification of working gas to cushion
to refill their storage fields’ working gas capacities based gas as a result of open access, as well as maintaining higher
on historical performance levels and match their storage storage pressures to support higher withdrawal rates. Also,
capacities with their customers’ requirements. Many this supports the need for realignment or re-engineering
storage fields are designed to have some excess working of existing storage fields to improve the cycling capability
gas capacities and operational flexibility to withdraw some of the storage fields and reduce cushion gas requirements
cushion gas, as needed, within the late withdrawal season. if and when higher storage services are needed.
Relative Volumes of Working and Cushion Gas
8,000
7,000
6,000
5,000
4,000
Bcf
3,000
2,000
1,000
0
1973
1975
1977
1979
1981
1983
1985
1987
1989
1991
1993
1995
1997
1999
2001
2003
Cushion Gas Working gas
Source: Graph generated by FERC staff from EIA data
Federal Energy Regulatory Commission • Staff Report • September 30, 2004 9
12. Capacity Summary
Storage Capacity Summar y
Total U.S., storage operating capacity (EIA data) =
7.6 Tcf (actual)
Total U.S., working gas capacity (potential) =
3.9 Tcf (estimated by EIA)12
Total U.S., actual operating working gas =
3.5 (1990-1991 withdrawal season)
Total Jurisdictional operating capacities
(staff estimation) = 5.2 Tcf
Total Jurisdictional working gas capacities
(staff estimation) = 2.5 Tcf
Regional Distribution of Underground Storage
The maps below illustrate the regional distribution of
underground storage, which is concentrated in upper
Ohio Valley, Michigan, Illinois, Gulf Coast and south
central locations. This regional distribution is based on
convenient geology, historic natural gas usage patterns
and location of depleted oil/gas reservoirs. There are
locations in the northeastern United States where there
are no depleted oil/gas field, salt domes/formations or
natural geological confinements for the development of
underground storage fields. While an alternative is the
importation and storage of LNG (surface or subsurface),
this alternative faces land use and local siting barriers.13
12
EIA, Natural Gas Monthly, 1973-2003, shows estimated working gas capacity of 3.2 to 3.5 Tcf.
13
In addition to the LNG import terminal at Everett, Mass., which has a storage capacity of 3.4 Bcf, there are 46 liquefaction and satellite storage
tanks located in Connecticut, Maine, Massachusetts, New Hampshire and Rhode Island owned and operated by LDCs. The total combined
storage of peak shaving and satellite storage is 15 Bcf. Cumulative vaporization capacity of these storage tanks, plus that from the Everett facility,
is approximately 2.3 Bcfd, which can supply as much as 50 percent of the region’s peak day needs. In addition to the LNG storage, LDCs have
260 propane tanks in New England with a total storage capacity of 1 Bcf of liquefied petroleum gas (LPG). Vaporization from LPG can meet 5
percent of New England’s peak day needs. See also New England Natural Gas Infrastructure, Docket No. PL04-1-000, December 2003.
10 Current State of and Issues Concerning Underground Natural Gas Storage
13. FERC Jurisdictional U.S. Storage by Type and Location
Depleted Gas Reservoir Aquifer Storage Field Salt Cavern Storage
Non-jurisdictional U.S. Storage by Type and Location
Depleted Gas Reservoir Aquifer Storage Field Salt Cavern Storage
Source: Developed using Platts PowerMap and GasData
Federal Energy Regulatory Commission • Staff Report • September 30, 2004 11
14. The Commission’s Role in Underg round Storage
Commission’
ommission Underg Likewise, based on our compilation of applications at the
Commission, the number of applications to construct and
Commission Certificates modify storage facilities has fluctuated from the 1970s
through 2004. We attribute the large number of
The Commission has jurisdiction over any underground applications during the late 1970s and early 1980s to the
storage project that is owned by an interstate pipeline industry’s reaction to colder-than-normal winters. The
and integrated into its system. Also, independently current increase in the number of storage applications
operated storage projects that offer storage services in reflects modifications of existing storage fields (increasing
interstate commerce are under the Commission’s capacity and efficiency) as well as applications by
jurisdiction. The chart below is based on staff ’s independent storage operators entering the natural gas
compilation of Commission orders and it shows that the market as a result of Order No. 636.
annual number of new storage fields certificated by the
Commission has decreased since the 1970s and early 1980s. Current Commission Cases
Beginning in 2002, the new certificated storage fields
mostly involved the development of small depleted gas Eleven major interstate storage projects (adding six new
fields and salt cavern storage fields. storage fields) were certificated since 2002, authorizing
FERC Certification of New Storage Fields by Year
10
9
8
7
Number of Fields
6
5
4
3
2
1
0
2000
2004
2002
2003
1988
1968
1986
1989
1998
1980
1984
1982
1969
1996
1999
1983
1990
1994
1992
1985
1993
2001
1978
1987
1995
1976
1979
1997
1970
1974
1972
1973
1975
1977
1981
1991
1971
Year
Source: FERC filings
12 Current State of and Issues Concerning Underground Natural Gas Storage
15. Certificate Applications for Realignment of Storage
20
18
16
14
Number of Applications
12
10
8
6
4
2
0
78
88
98
76
86
96
70
74
80
84
90
94
00
04
02
72
82
92
68
19
19
19
19
19
19
19
19
19
19
19
19
19
19
19
20
20
20
19
Source: FERC filings
Year
the development of 74.7 Bcf of new interstate working Midwest and Gulf Coast/Southeast regions. The present
storage capacity for the U.S. Of the 74.7 Bcf of new storage pending and anticipated storage projects will be required
capacity, 17.9 Bcf has been delayed or put on hold when to meet the increasing seasonal peak-day requirements.
compared to the applicant’s originally projected in-service
date. Of the 11 storage projects, four projects would add Ten publicly announced storage projects are on the
12.2 Bcf of new storage capacity into the Northeast region, horizon with potential storage capacity totaling 115.8 Bcf.
but it is these projects that have been delayed. Two Of this amount, 5 Bcf would be in the Northeast, 27 Bcf
projects have added 12.1 Bcf of new storage capacity in the would be in the Midwest, 53.6 Bcf would be in the Gulf
Midwest and five projects added 50.4 Bcf of new storage Coast/Southeast and 3.2 would be in the West.
capacity in the Gulf Coast/Southeast.
The regional distribution of these approved, pending and
Four storage projects are pending before the Commission; on-the-horizon projects is shown on the map below.
they have a projected capacity of 54 Bcf for the Northeast,
Federal Energy Regulatory Commission • Staff Report • September 30, 2004 13
16. Recent Gas Storage Projects
Capacity in Bcf; August 2004
Bluewater Wyckoff
(27.0)
Dominion (6.0)
(9.4)
Seneca
NGO (0.8)
KM (6.0) (6.1) Tennessee
(5.0)
Dominion
(5.6)
Columbia
Saltville (12.4)
NGPL Liberty Gas (5.8)
(10.0) (17.0) NUI Texas Gas
(11.6)
Copper Eagle (8.2)
Caledonia
(3.2) Natural (11.0)
(10.7)
Falcon Gas Sempra Falcon Gas
(3.0) (24.0) SG Resources (20.0)
EnCana Egan (12.0)
(8.0) (8.0)Copiah
Gulf South
(10.6) (3.3)
Certificated Since 2002 (11) On the Horizon (10) Currently Pending (4)
Source: FERC filings and price industry reports
Current Developments Regarding Underground • In salt cavern development, operators can chill the
Storage natural gas and condense its volume to reduce the
size of the storage field and the amount of brine that
New Technologies needs disposing.
Current methods of improving storage field efficiency, • Operators can use “lined rock caverns” in storage
such as mechanically removing debris, washing, injecting facilities, in which a steel tank has been installed in a
acids and creating new perforations in the well pipe often cavern that has been blasted into the rock of a hill.
provide only limited and temporary improvements. New
technologies are now being used to improve storage field • Freezing natural gas in the presence of water creates
efficiency: hydrates, thus allowing for large quantities to be
stored in same volumes.
• To unclog storage wells, a low-frequency/high
frequency sound wave device is being used that • Operators can use the Bishop Process (TM by
vibrates the scale off the well pipe. Conversion Gas Imports) in which LNG is unloaded
offshore, warmed to 40 degrees Fahrenheit and then
• There are innovative fracturing technologies, such stored as natural gas vapor in underground salt
as injecting high pressure liquid carbon dioxide caverns either onshore or offshore.
instead of water or other liquids, to keep clays from
sticking and sealing off parts of the reservoir.
14 Current State of and Issues Concerning Underground Natural Gas Storage
17. More on LNG and Underground Storage issues and rate issues. Specifically, storage projects have
been placed on hold until the market improves or have
Quantities of LNG imports into the United States have been cancelled due to a lack of market interests.
increased almost six-fold from 85 Bcf in 1998 to 507 Bcf in Environmental concerns such as brine disposal used in
2003. Should LNG imports grow in the future as projected, the development of salt caverns and land use have been
more storage facilities (LNG tanks, salt cavern storage and raised. Storage projects have incurred funding problems
depleted offshore oil/gas reservoirs) will be needed. The and cost concerns, and some projects have been cancelled
DOE is studying a novel method of unloading and or delayed due to pipeline infrastructure problems. With
regassifying LNG directly from ocean tankers for storage the denial of market based rates for storage projects by the
in underground salt caverns. Under the Bishop Process, Commission, certain storage proponents believe cost-
LNG would be received directly from an offshore tanker, based rates may not provide adequate incentives to attract
regasified, pressurized and warmed to 40 degrees F, then the investment necessary to develop the proposed storage
injected into underground salt caverns. A DOE study facilities.
identified more than two dozen potential sites that had
suitable salt formations, sufficiently close proximity to Need for More Storage
existing pipelines and navigable water.14 This process
would eliminate the need to build expensive aboveground Estimations of the need for more storage first require
cryogenic storage tanks. A combination of the Bishop projections of national and regional natural gas supply
Process with the construction or conversion of existing and demand. Then one must estimate the future
offshore depleted gas fields, platforms and lines could also expansion of natural gas transmission and distribution
be a means to import, store and transport LNG. There are to gauge how much more storage might be needed to meet
many offshore depleted gas fields that could be used for seasonal and peak deliverability demands. The price of
this purpose. natural gas and the price volatility also affect the need for
storage and such factors also need to be estimated. The
Problems with Underground Storage Projects NPC gas study and other sources have estimated a need
for additional storage in the United States and Canada of
A few storage projects have been canceled, delayed or up to 700 Bcf by 2025. This has been projected on a regional
placed on hold due to market concerns, environmental basis by work sponsored by The INGAA Foundation, as
follows below:
New North American Gas Storage Requirements
Incremental Working Gas
Capacity in EEA Base Case 2004-2008 2009-2020 Total
Western Canada 30 Bcf 40 Bcf 70 Bcf
Eastern Canada/Michigan 36 Bcf 74 Bcf 110 Bcf
Midwest – 60 Bcf 60 Bcf
New York 10 Bcf 56 Bcf 66 Bcf
Pennsylvania / West Virginia 33 Bcf 90 Bcf 123 Bcf
Gulf Coast 72 Bcf 5 Bcf 77 Bcf
West Coast 21 Bcf 78 Bcf 99 Bcf
Other 10 Bcf 37 Bcf 47 Bcf
Total 212 Bcf 439 Bcf 651 Bcf
Source: Energy and Environmental Analysis Inc, At the Crossroads: Crisis or Opportunity for Natural Gas
14
See http://www.fe.doe.gov/programs/oilgas/storage/index.html.
Federal Energy Regulatory Commission • Staff Report • September 30, 2004 15
18. St aff O bser va tions on the Cur r ent St a te of
Staff Obser vations
bserva Curr Sta of existing storage facilities. Storage field re-alignments
Underground Storage are being implemented to increase working gas capacity
within existing fields and to reduce cushion gas
Natural gas storage is in better shape this year than last. requirements, which results in increases in deliverability.
From a national perspective, we have adequate storage
volumes in place in the United States at this time to cover Since 1968, there have been many applications for the
normal conditions. The EIA’s “Weekly Natural Gas realignment of old storage fields. Storage operators have
Storage Report” divides U.S. underground gas storage modified old storage designs, incorporated new design
into three regions: East, West and Producing. As of procedures and constructed surface and subsurface
September 9, the United States had 257 Bcf more in storage facilities. These modifications include drilling large-
than at this time last year and 183 Bcf more than the five- diameter wells, relocating wells within reservoirs,
year average for this time of year. If storage injection incorporating coil tubing drilling (CTD)15 and horizontal
continues at its current pace, there should not be any well drilling and completing larger diameter wells.
problem in refilling working gas storage to the previous Additionally, storage operators are adding compression,
year’s level (3,155 Bcf on October 31, 2003) and the storage dehydration facilities, and new gathering lines.
fields should be full and pressurized to their designed Operators are also using new technical procedures to better
levels. understand reservoir geology, confinement and reservoir
flow behaviors, abandoning uneconomical facilities and
In recent years, however, relatively few new storage fields incorporating new storage operational procedures.
have been built. Also, there has been an abandonment
of a number of old, inefficient, and uneconomically Storage field modifications have generally provided new
operated underground gas storage fields. Traditionally, operational capability for storage operators to recycle more
underground storage fields were designed to meet peak working gas efficiently. By cycling working gas during
seasonal demands. Today, especially with the both injection and withdrawal seasons, the storage
proliferation of gas-fired electric plants, storage facilities operator is able to confine the storage gas, better define
are increasingly expected to meet rather dramatic daily or geological parameters, reduce gas migration/loss, increase
even hourly swings. Thus, storage operations are efficiency and reduce operational cost. Finally, a few
changing with changing market characteristics. The load storage fields’ working gas volume has increased and
profile has changed for natural gas customers over the cushion gas volume of those same fields were reduced.
past few years, and gas supply now is required – sometimes
quickly – throughout the year rather than merely meeting On balance, through realignments or re-engineering
peak seasonal demands. Therefore, storage fields with procedures, injection/withdrawal capability has increased
high injection and withdrawal capabilities are becoming without any significant increase in total storage operating
the main choice for many storage operators. The capacity. In fact, data indicate that the total U.S. storage
traditional marketplace now values highly diversified operating capacity (jurisdictional and nonjurisdictional)
types of storage services and has increasingly sought has remained about the same over the past few years.
storage that rewards flexibility, safety and reliability. This Thus, the recent trend in storage field construction activity
is the main reason why storage operators are re- has predominantly been the modification and
engineering and conducting detailed studies of their realignment of existing storage fields to meet changing
storage fields to see how they can improve the performance market demands rather than a dramatic increase in
15
CTD is used in existing storage reservoir when the conventional well enhancing techniques (hydraulic fracturing, acidizing and/or reperforating)
for enhancing well performance have not proved to be effective.
16 Current State of and Issues Concerning Underground Natural Gas Storage
19. construction of new storage fields. During the past 10 new working storage capacity by 2025 discussed above
years, there has been a significant increase in the ability can be met by the construction of only 35 Bcf of working
to move gas in and out of storage. capacity per year over the next 20 years. The industry
appears to be close to meeting or surpassing this goal based
It is the staff’s technical opinion that prudent operational on the storage projects that we have approved, have
procedures and realignment of storage facilities within pending before us or are expecting to be filed in the near
the past few years by storage operators have resulted in future. While several old storage fields have been
better use of storage capacity. Storage operators have abandoned, others have been sold for less-active local
modified their storage facilities and improved storage uses. However, over the past 10 years the Commission
capabilities with different types of storage operations and has authorized many storage realignment applications to
services than offered in previous years. In staff’s view, in improve injection/withdrawal and operational capability
the future, storage operators will construct a limited of existing storage fields.
number of storage facilities on an as-needed basis.
However, these projects will tend to be highly selective,
taking advantage of particularly advantageous locations
or highly favorable geological characteristics.
Historical storage engineering and operational data
indicate that not all working gas has been recycled in
many storage fields. There are many old storage fields
that could and should be redesigned and realigned by
incorporating new technology, reducing cushion gas
volume, increasing working gas volume and increasing
efficiency of storage operation by recycling more working
gas. All these new designs and modifications will improve
operational capability and reduce operational costs
without necessarily increasing the total certificated storage
capacity. It is advantageous environmentally and also
more cost effective to improve the cyclic capability of
existing underground field than to construct a new
depleted oil/gas field. It is important to recognize that
steadily increasing storage demands will not necessarily
be met with large investment in new storage fields in the
United States.
The level of total gas storage capacity has been relatively
flat for a number of years. During the past few years we
have seen an average of only one or two new underground
gas storage certificated per year. However, the National
Petroleum Council’s projected need of up to 700 Bcf of
Federal Energy Regulatory Commission • Staff Report • September 30, 2004 17
20. ECONOMICS OF UNDERGROUND STORAGE
Storage Economics Storage Development Costs
Successful storage infrastructure investments, as with all Among the three types of storage fields (salt cavern,
private sector capital expenditures, must provide depleted reservoir and aquifer), salt caverns are generally
attractive financial characteristics. Many investment the most expensive to develop on a capacity basis.
measures are used by industry to evaluate the commercial However, because salt cavern storage can be cycled many
viability of projects including, although not limited to, times (up to 12 times for some facilities), on a
net present value and internal rate of return. These deliverability basis it can be less costly than other types
techniques provide different indicators of a project’s merit of storage facilities.
but fundamentally each is a measure of cash flow benefits
relative to capital expenditures and operating expenses. A typical 6-12 cycle Gulf Coast salt cavern can costs
Independent, unregulated storage projects will generally upwards of $10 million/Bcf of working gas capacity and is
be expected to have returns on equity exceeding 20 percent higher in other regions, with Midwestern facilities the
while jurisdictional storage projects will typically have next most expensive, followed by the Rockies, the
equity returns between 12 percent and 15 percent. The Northeast and finally California and the Pacific
higher return for unregulated projects, often salt-cavern Northwest. A typical 2-cycle depleted reservoir field can
based, is due to the perceived market, geologic and cost between $5 million and $6 million/Bcf.1 6 The
development risks. following table summarizes broad ranges of development
costs.
Capital costs and cash flow, and hence, the economic
attractiveness of storage, depends upon the physical
characteristics and capabilities of a particular storage field,
the services to be provided and to a lesser extent, Development Cost of
regulatory regimes. Development costs vary greatly by
the type of storage and its performance characteristics. Working Gas Storage
The projected revenue and cash flow benefits differ for
facilities designed to ensure seasonal supply reliability Development Costs
and meet daily or intra-day demand swings as compared Type Per Bcf of Working
to capturing commodity arbitrage opportunities. Further, Gas Capacity
regulators can restrict the ability of storage projects to
realize profits or, conversely, guarantee profits. 2-Cycle
Reservoir $5 - $6 million
Consistent with the physical perspective that storage
amounts nationally are generally adequate and the 6-to-12 Cycle
requirement for new storage is more of a chronic versus Salt Cavern
acute need, the economics for new storage development
are not robust, with the exception of expansions of
Gulf Coast $10 - $12 million
existing fields. In particular, high-deliverability storage Northeast As much as $25 million
projects that could serve to mitigate price levels and
and West
volatilities as seen during the price spikes of 2003 and
2004 have particular challenges in matching value to Source: Industry sources
capital costs.
16
Industry sources
18 Current State of and Issues Concerning Underground Natural Gas Storage
21. Generalizations aside, costs are site-specific based on: Gas Storage
Development Costs
• the quality and variability of the geologic
structure of the proposed site;
Gulf Coast Northeast
• the amount of compressive horsepower
required; Salt Reservoir
• the type of surface facilities needed; Cavern Storage
• the proximity to pipeline infrastructure; and Capacity (BCF) 5 9.4
• permitting and environmental issues.
Deliverability 500 147
Significant project development effort must be done before (MMcfd) (est.)
a storage site is located and planned, increasing the risk
of project delays and cost overruns. Base Gas Cost
($ Millions) 12 3.2
The cost of base gas is one of the most expensive elements
of a storage project. As a rule of thumb, the total capacity Total Development
of depleted reservoirs normally consists of 50 percent base Costs ($ Millions) 65 39.5
gas. Expansions of existing reservoir storage, however,
can significantly reduce the need for base gas. Total aquifer Source: Dominion Resources, Inc, CBI Storage Conference,
Feb. 23-24, 2004
storage field capacity is made up of between 50 percent
and 80 percent base gas. A salt cavern storage field typically
requires 25 percent base gas. However, leaching and brine The Value of Storage
Value
disposal costs for salt caverns are high. This is due to the
large amounts of water needed to leach a salt cavern and The value of storage will depend on what function storage
the environmental problems associated with disposing provides with different purposes, for instance, for
of the brine during the leaching process. reliability of supply, imbalance management, seasonal
arbitrage and trading. Storage operators and customers
The majority of recent storage projects involve re-working have developed sophisticated techniques for valuing
and expanding older high-quality depleted reservoirs to storage based on option theory. Consistent with the
generate higher deliverability using new technologies variety of storage uses are a range of valuation approaches
such as horizontal drilling. These projects minimize that include:
development costs by leveraging the existing infrastructure
and avoiding many environmental issues.17 In addition, • Cost of Service Valuation;
field performance is easier to judge because the • Least Cost Planning;
characteristics are already known. • Seasonal Valuation (Intrinsic); and
• Option-Based Valuation (Extrinsic).
The table in he next column summarizes recent examples
of storage development costs.18 Cost of Service Valuation
Cost-of-service is used to value services offered by
regulated storage providers such as interstate pipeline
17
CBI Storage Conference, Houston, Texas, February 23-24, 2004.
18
Dominion Application, CBI Storage Conference, February 23-24, 2004.
Federal Energy Regulatory Commission • Staff Report • September 30, 2004 19
22. companies. It allows for recovery of costs and a return on The differential for July 2005 to January 2006 is ($6.578-
capital. Published rates and tariffs are maintained. $5.933)/(1.05) = 62¢ as of September 3, 2004, and assuming
Services priced in this manner include firm storage one year of discounting at 5 percent (thus, the
service, no-notice storage service, interruptible storage denominator of 1.05). More conservatively, the seasonal
and parking and lending services. Based on a review of spread assuming average values over the entire injection
20 storage operator tariffs, the median cost-of-service rate and withdrawal periods would be approximately 47¢. The
per Dth of annual working gas capacity for firm storage more conservative estimate uses average prices for the
service is $0.64.19 A summary of the tariff rates is provided seven-month injection and five-month withdrawal
in Appendix A. season as compared with using the highest and lowest
values.
Most cost-of-service regulated storage is reservoir storage.
A cost-of-service rate for high-deliverability salt cavern While the spread is 47¢-62¢, for the 2005-05 winter the
storage would be much higher than traditional storage. spread going into the current winter widened to $1.84 for
As a hypothetical example: October 2004 to January 2005. This differential was high
by historical standards and was largely the result of falling
– Capital cost = $60 million for a 5-Bcf Gulf Coast cavern October prices rather than increasing January prices;
– Annual Cost of service = $14.63 million20 January prices remained relatively stable during this
– Unit storage cost = $2.93 per Mcf per year period. This appeared to reflect an adequate supply of
gas in the market due to a mild summer with reduced
Seasonal Valuation cooling demand. In terms of ability to store excess
production, if more storage capacity were available at these
The seasonal valuation of storage is called the intrinsic prices, it’s likely that gas would have been injected into it
value. It is the difference between the two prices in a pair and prices wouldn’t have fallen so much. Eventually,
of forward prices and does not include trading benefits. this would have resulted in a reduction in January prices
This strategy, based on locking-in forward spreads, is under “normal” weather expectations, or increased
simple to execute, both financially and physically. The reliability to handle extreme demand situations.
seasonal spread for next winter is demonstrated in the However, with regard to the planning horizon for storage
following table.21 development, developers would look to next year’s prices
and beyond to economically justify projects as compared
Monthly Contract Values to a short-term spread of three to four months.
for Natural Gas Futures
Historical seasonal spreads for a variety of locations are
shown in the following chart.22
Delivery Month Forward Price
Jul-05 5.933
Aug-05 5.955
Sep-05 5.950 19
Staff review of rates and tariffs as maintained on informational
Oct-05 5.985 postings.
Nov-05 6.225 20
Staff calculation assuming: return on equity of 13 percent, debt cost of
Dec-05 6.438 8 percent, 50/50 debt/equity ratio, 34 percent federal tax rate, 3 percent
Jan-06 6.578 state ad valorem tax, 20-year book life and 10-year tax life.
21
Staff analysis of September 3, 2004, settlements on the New York
Feb-06 6.538
Mercantile Exchange (Nymex).
Mar-06 6.380 22
Staff analysis of Gas Daily data, nominal values.
Source: Derived from New York Mercantile Exchange data
20 Current State of and Issues Concerning Underground Natural Gas Storage
23. Average Gas Price Differentials Between Summer and Winter Seasons
6
5 Long Term Averages:
Henry Hub $0.65
Dominion NP $1.10
4
Dominion SP $0.92
Northwest $1.57
3 Chicago $0.72
Avg. $/MMbtu
2
1
0
Period 1 Period 2 Period 3 Period 4 Period 5 Period 6
(1998-1999) (1999-2000) (2000-2001) (2001-2002) (2002-2003) (2003-2004)
-1
Henry Hub Dominion North Point Dominion South Point Northwest Chicago
Source: Derived from Platts Gas Daily data
Option-Based Valuation for High-Delivery Storage This gives storage holders the opportunity, although not
the obligation, to inject at one time and withdraw at
High-deliverability storage provides trading benefits that another time. Similar to any option, the value is
increase with the number of turns, or cycles, per year. proportional to forward prices, price volatility, strike price
This is often referred to as the extrinsic value of the storage and time to expiration.
and is in addition to the intrinsic value.
The chart on the following page illustrates the difference
The premium of extrinsic value is similar to a call option between extrinsic and intrinsic values.
on a time spread, increasingly so for a high delivery facility.
Federal Energy Regulatory Commission • Staff Report • September 30, 2004 21
24. Difference Between Intrinsic and Extrinsic Value of Natural Gas Storage
Nymex Gas Contracts, July 2003 and January 2004
Opportunity for additional value on July-January spread
7
Jan. '04
contract
6.5
6
$/MMBtu
5.5
5
Intrinsic value of storage =
the difference between the cost of July '03
July '03
4.5 gas (here at contract expiration) and the
contract Cost of July gas in storage
value of Jan '04 gas sold the same day
fixed after contract expiration
4
3/1/03 4/1/03 5/1/03 6/1/03 7/1/03 8/1/03 9/1/03 10/1/03 11/1/03 12/1/03
Source: Based on New York Mercantile Exchange data
If all opportunities for injection and withdrawal are valuation, including both seasonal arbitrage and extrinsic
successfully exploited, the value of the multiple-turn trading benefits, of approximately $1.60 to $1.90 for the
facility will be several times the value of a single-turn three-turn and nine-turn facilities, respectively.
facility with no opportunities to take advantage of market
prices. Current, average estimates of extrinsic values in The chart on the next page demonstrates the extrinsic
the Gulf Coast range from $1.00 for a three-turn facility to value as compared to storage cycles.23
$1.30 for a nine-turn facility, resulting in total storage
23
The extrinsic value is determined by not only the spread between future prices for injection periods and future prices for withdrawal periods, but
also by the volatility of prices along the natural gas futures curves curve and the degree to which the individual months move together as measured
by correlation. The more volatile and less correlated the prices for individual months are, the greater the probability that the spread between prices
for an injection month and a withdrawal month will widen. This is in turn increases a storage facility’s potential profitability.
22 Current State of and Issues Concerning Underground Natural Gas Storage
25. Extrinsic Value of Natural Gas Storage
$1.80
$1.60
$1.40
Storage Valuation
$1.20
$1.00
$0.80
$0.60
$0.40
$0.20
$0.00
1 2 3 4 5 6 7 8 9
Turns (Cycles)
High Correlation Low Correlation
Source: Analysis of New York Mercantile Exchange forward prices and Bloomberg data
Federal Energy Regulatory Commission • Staff Report • September 30, 2004 23
26. Least-Cost Planning pipeline capacity, the unit value for market area storage
given a 50 percent load factor is 70¢ to $1.10.24
Least cost planning is storage valuation as typically
performed by local distribution companies and other
large-volume gas customers. Storage is valued by Summary Conclusions
Economic Summar y and Conclusions
considering the savings resulting from not having to use
a more expensive option. There is a wide range of A summary of current, alternative valuations, depending
valuations that are highly dependent upon a gas on use of the facilities, and based on the proceeding
consumers’ load profile. The following hypothetical load analyses, is shown below. These approaches are not
duration curve illustrates least cost planning. mutually exclusive, all of them are currently in use, and
most prudent customers will use some combination in
Using this evaluation technique and assuming the quantifying value.
incremental storage capacity is priced relative to long haul
Least Cost Planning for Gas Storage
Peak Shaving (LPG)
Interruption
Storage
Capacity
MMcfd of sendout
Incremental
Storage Capacity Pipeline Capacity
1 Days Per Year 365
Source: Based on representative industry data
24
Does not take into account additional transportation capacity to make storage comparable to pipeline delivery. Chart is an illustrative load duration
curve.
24 Current State of and Issues Concerning Underground Natural Gas Storage
27. Varying Costs of Gas Storage
Type $/Mcf of Working Gas
Storage Median Cost-of-Service $0.64
Storage Seasonal Spread (Intrinsic) for Winter 05/06 as of August 2004 $0.47 to $0.62
Least-Cost Planning (Generally Applies to Reservoir Storage) $0.70 to $1.10
Salt Cavern Hypothetical Cost-of-Service (Gulf Coast) $2.93
Salt Cavern Market Value (Intrinsic plus Extrinsic Gulf Coast) $1.60 to $1.90
Source: Summary of industry and financial data cited in this report
Seasonal spreads, ranging from 47¢ to almost 62¢ for the new storage facilities, it may be easier for local distribution
winter of 2005-06 as of September 2004, are comparable to companies to simply purchase gas at index rather than
the cost expansions of reservoir storage, and indicate invest in facilities to mitigate volatility. Thus, many
storage supply and demand are reasonably in balance on local distribution companies do not see the value of
a national level. However, storage may be the best way entering into storage contracts that reflect extrinsic value.
of managing gas commodity price volatility under more The Arizona Corporation Commission (ACC) recently
extreme weather conditions, so the long-term adequacy released a policy statement embracing the need for new
of storage investment depends on how much price storage capacity and may be amenable to addressing this
volatility is considered “acceptable”. The public policy problem by altering the incentives to contract for storage
interest in volatility mitigation may be different than service.
wholesale market valuations.
The loss of a vibrant trading sector means fewer customers
Although storage costing less than or near its intrinsic or will pay for the trading benefits of storage. For instance,
seasonal arbitrage value will always be fully subscribed, one developer said he would be lucky to get $1 for storage
the market value of storage relative to its costs currently valued intrinsically and $1.60 extrinsically. The market
does not provide incentives for most independent storage will often only pay for 50 percent of the extrinsic value to
development. Project economics are a challenge for salt account for the likelihood of not being able to realize the
cavern storage. At a market value of approximately $1.60 full value.
to $1.90/Dth/year, it is difficult to justify developing salt
caverns outside of the low-cost Gulf Coast. Project Electric generators can use inexpensive pipeline
developers are not likely to achieve a cost-of-service imbalance management that makes third party storage
comparable returns that would require a rate approaching less attractive as an alternative. Park and loan rates are
$3 in the Gulf Coast and much higher elsewhere where typically less than 20¢ per day and more palatable to
development is more expensive. independent electric generators, especially given their
weak credit and inability to make long-term commitments
The financial and regulatory circumstances of storage to storage. Finally, at high gas prices, base gas becomes a
customers can hinder storage development. Even if a barrier to entry for reservoir storage development and
proposed new storage facility is economic, state regulatory also provides incentives to abandon existing fields to sell
policies may inhibit its development. Because state the base gas.
regulators exercise prudence reviews for cost recovery of
Federal Energy Regulatory Commission • Staff Report • September 30, 2004 25
28. P OSSIBLE OPTIONS FOR ST IM UL AT ING
OSS PTION
IONS
UNDERGROUND STORAGE DEVELOPMENT
In prior sections we discussed how underground natural Paso had no daily penalties for service imbalances. As a
gas storage is a valuable resource that can ensure service result, El Paso’s customers had no need to individually
reliability, serve as a substitute for gas transmission and contract for storage services to meet peak demand or
thereby reduce overall delivery costs, and through hedging pipeline balancing requirements.
help moderate gas commodity price volatility. By all
accounts, demand for the natural gas resource will Some independent storage developers, such as Red Lake,
continue to grow over the next 20 years, particularly with assert that storage development is considerably more risky
respect to gas-fired electric generation. Gas storage than pipeline construction primarily because of the
development is an essential element of the infrastructure inability to secure similar long-term contractual
that will be necessary to reliably and efficiently serve commitments. They assert that in contrast with new
these new demands. pipeline construction, where contract commitments are
typically in the 10 to 20 year range, contract commitments
While current and projected storage development is for storage service exceeding a 1 to 5 year range are rare.
keeping pace with aggregate storage demands, They contend that traditional cost-based storage rate
underground storage development in some market areas, design will not encourage further development of storage
such as the Southwest and New England, has been due to the evolving and risky nature of storage services,
virtually non-existent. Few new projects in the Southwest the fact that the primary users of these new services (e.g.,
have been proposed and several have failed or face daily and intraday balancing, and commodity arbitrage)
significant opposition.25 The geology in these areas is are often not the traditional creditworthy LDCs, and that
also not favorable to large scale underground storage traditional cost-based rates do not reflect the value of
development, and competition from pipeline expansions service on peak, and do not reflect rates of return that
and LNG development may be dampening demand for adequately account for the risky nature of these
new underground gas storage. Further, state unbundling investments. Additionally, they imply that affiliated
initiatives limit the ability of LDCs, the traditional storage development has subtle, and in some instances,
purchasers of storage services, to renew or enter into new tariff advantages over storage provided by independent
contracts for long-term storage service, primarily due to third parties, which may lead to increased costs and service
uncertainty over cost recovery at the local level and to inefficiency for all customers. According to Red Lake, the
stranded cost considerations. Additionally, in the best and preferred way to permit them to fairly compete
Southwest, until the Commission reformed services on and recover their costs is through the flexibility of market-
the El Paso Natural Company system to put in place firm based rates. Pricing schemes short of market-based rates
contract demand levels for all of its customers,26 market may provide too little flexibility and shift too much risk
signals for new storage services were virtually non- to independent storage providers to encourage storage
existent. Almost all gas service in the East-of-California development.
market was provided on a full requirements basis and El
25
The Red Lake storage project failed after being denied market-based rate authority for failing the Commission’s market power test. The Desert
Crossing storage and transportation project failed due to environmental issues and the contract support that did not materialize. The developers of
the Copper Eagle storage project failed to secure contractual support and have sold development rights to the project to El Paso Natural Gas Company
(El Paso). El Paso has yet to overcome local opposition to the project, secure contractual commitments and file for certificate authorization. Additionally,
no LDCs in these areas have pursued development of storage projects, which could be another indicator of demand for new storage.
26
See El Paso Natural Gas Co., 99 FERC ¶ 61,244 (2002); El Paso Natural Gas Co., 100 FERC ¶ 61,285 (2002); El Paso Natural Gas Co., 104 FERC ¶ 61,045 (2003).
26 Current State of and Issues Concerning Underground Natural Gas Storage