2. crashes (Horne & Rayner, 1995). These numbers are
likely under-estimated for the reasons outlined above.
In an effort to document the circumstances surrounding
crashes objectively, Virginia Tech Transportation
Institute (VTTI), under the sponsorship of the U.S.
Department of Transportation (USDOT) National
Highway Traffic Safety Administration (NHTSA),
instrumented 100 cars with cameras and sensors to
record driver behaviors, road and vehicle conditions
prior to crashes. The 100-car study found that 78% of
the crashes and 65% of the near crashes were
contributed to driver drowsiness and distraction,
including engagements of a secondary task and eye
glances to mirrors and blind spots (Neale, Dingus,
Klauer, Sudweeks, & Goodman, 2005). These findings
are in agreement with Evans' observation that driver
behavior (including the individual's behavior and the
behavior of other road users) is the single most
important contributing factor to traffic safety (Evans,
2003, 2004). Risky driver behavior includes but is not
restricted to tailgating, speeding, distraction, drowsiness,
impairment, erratic driving, aggressive driving, and sign
violations.
DRIVER STATE AS A CONTRIBUTING FACTOR
OF CRASHES
It is clear from the preceding discussion that driver
behavior plays a key role in traffic safety. It is often said
that we drive the same way as we live because driving
styles often reflect the driver personality and personal
habits. To the extent that personal habits and personality
are influenced by social and cultural norms and by
personal experience, driver behavior will also vary with
culture and personal experience. Individual differences
exist among different drivers, some (but not all) of which
can be attributable to driver age and gender (Evans,
2004).
Rather than investigating personal habits for a particular
driver via driver profiling and individualization (which
requires the access of driver personal data or a time-
consuming process of learning the driver behavior), we
will focus on the most commonly observed categories of
driver behavior that have demonstrated a significant
impact on traffic safety. These will be called driver state
and are listed as follow,
• Driver distraction and inattention.
• Impairment due to alcohol and drug intake.
• Drowsiness and fatigue
Driver distraction (or inattention) is defined as diverting a
driver's attention to non-driving (secondary) tasks away
from the driving task to the extent that the driving
performance is significantly degraded. Drivers may
initiate an intended distracting activity such as manually
dialing a phone number (endogenous control), or the
driver's attention may be automatically diverted to non-
driving events by sudden changes (e.g., flashing neon
lights) in the environment (exogenous control). In either
case, driver performance tends to suffer. A distracted
driver tends to respond to evolving conflicts (e.g., the
deceleration of a forward vehicle and the incursion of a
bicycle into the driving lane) significantly slower than
does an attentive driver. The slower reaction time (RT)
to evolving conflicts appears to be a major cause of
crashes. In addition, a distracted driver has the tendency
to drift out of the lane and lose control of the vehicle,
which increases the likelihood of leaving the road and
colliding with trees or poles.
Depending on the attention resource that is involved,
driver distraction has typically been classified into visual
distraction, auditory distraction, cognitive distraction, and
manual (psychomotor) distraction (Ranney, Mazze,
Garrott, & Goodman, 2000). Visual distraction is
operationally defined as eyes looking away from the
forward road. Auditory distraction is the diversion of
auditory resource away from driving, for example,
listening to music. Cognitive distraction is the diversion
of cognitive and decision making resource away from
the driving task. Performing a mental arithmetic task and
thinking about work-related problems while driving will
constitute as cognitive distraction. Manual
(psychomotor) distraction is the diversion of
psychomotor resources away from driving, for example,
taking hands off the steering wheel.
Different types of distraction are overlapping and
interactive rather than isolated. For example, visual and
manual distraction are often coupled because drivers
usually need visual guidance in manual tasks (e.g.,
reading button labels before button presses). Similarly,
auditory and cognitive distraction are often coupled
because processing auditory messages requires
thoughts and decision making capabilities. Although
visual and cognitive distraction are often studied
separately, they are frequently coupled in real life
because even processing a simple visual object (e.g., an
icon or a label) requires a certain level of thinking. The
psychological research reveals that humans typically
think about objects that they look at (Rizzolatti, Riggio, &
Sheliga, 1994), despite the fact that laboratory
investigations have found instances of looking at one
location but thinking about another object, looking but
without cognition (Stark & Ellis, 1981), looked but did not
see or change blindness (Rensink, O'Regan, & Clark,
1997). Therefore, the distraction labels in the
classification system reflect the most prevalent type of
attention that is under investigation.
Alcohol is a depressant that affects many functions of
the central nervous system. It has been demonstrated
that consuming even a small amount of alcohol can
impair tracking, steering, coordination, reaction time, and
information processing (Dalrymple-Alford, Kerr, & Jones,
3. 2003; De Waard, 1996). Alcohol consumption may also
exacerbate driver drowsiness.
Whereas driver distraction involves a high level of
workload while performing non-driving tasks in addition
to the driving task, driver drowsiness typically stems
from a low level of workload and activities. Drivers may
become bored when driving on a long stretch of straight
highway with a dry pavement and monotonous
environment. Drivers may become tired and drowsy after
a long day at the office, after a restless night, or after
driving continuously for a long duration. Drowsy drivers
may lose control of the vehicle and roll over into ditches.
DRIVER STATE MONITORING IN REAL TIME:
PRELIMINARY RESULTS
To prevent crashes, it is critical to be able to assess the
driver state in real time as it occurs. The real time
assessment of driver state will be useful in delivering
feedback and warnings to drivers to re-orient their
attention to the driving task. It can also be fed into other
vehicle safety systems to enhance safety.
In order to be installed in vehicles, driver state monitors
must operate automatically without the driver's
intervention. Drivers should not be asked to calibrate the
system. In order to be accepted by everyday drivers, it
should be non-intrusive and not make physical contact
with the driver. Electrodes placed on the driver's scalp
monitoring EEG, wrist or chest bands measuring heart
rate and blood pressure, hamlets measuring head and
eye movements are unlikely to be accepted by drivers.
In order to be implemented in real vehicles, driver state
monitors must be made robust and conform to
automotive-grade requirements.
Satisfying all these requirements is a significant
challenge. Considerable progress has been made,
however, in the past few years. One approach is to use
vehicle sensor and driving performance metrics to infer
driver state. The premise is that driver impairment and
distraction will be manifested in terms of changes in
driving performance (e.g., standard deviation of lane
position or SDLP, steering error) that can be assessed
by vehicle sensors already in place. This approach is
indirect but reasonable because driving performance is
an important factor of traffic safety and an important
indication of driver state (Green, Cullinane, Zylstra, &
Smith, 2004; Nakayama, Futami, Nakamura, & Boer,
1999).
A more direct approach is to measure physiological and
behavioral variables that are direct manifestations of
driver distraction, drowsiness, and impairment. Rather
than studying indications or symptoms of driver
distraction or impairment, this approach investigates
these driver states themselves. There are many
potential technologies, but automatic head and eye
tracking systems seem most promising. Several eye
tracking systems have been used in research and
evaluation. For example, the Facelab system from
Seeing Machines, Inc. (www.seeingmachines.com) has
been used in human factors evaluation (Victor,
Blomberg, & Zelinsky, 2001; Zhang, Smith, & Witt, in
press), the Driver Fatigue Monitor from Attention
Technologies, Inc. (http://www.attentiontechnology.com)
has been used to detect driver drowsiness and fatigue
(Grace & Steward, 2001), and the Driver State Monitor
from the Delphi Corporation has been developed to
assess driver distraction and drowsiness (Edenborough,
et al., 2004).
The direct assessment of driver distraction in real time is
a major focus of the Safety Vehicles using adaptive
Interface Technology (SAVE-IT) program that is led by
the Delphi Corporation and sponsored by NHTSA and
the Volpe Center (Witt, Zhang, & Smith, 2004), and the
Adaptive Integrated Driver-Vehicle Interface Project
(AIDE) in Europe (Engstrom, 2004).
EXPERIMENTAL RESULTS
Several experiments have been performed to determine
the diagnostic measures of visual distraction using head
and eye movements that are detected by an automatic
eye tracking system. In one simulator experiment
(Zhang, Smith, & Witt, in press), subjects were asked to
read unrelated words on a display that is located at the
center console (occupying the typical radio area), on the
top of the dashboard, or on the left side of the simulator
room. Subjects were asked to read aloud 6-15 words
every 13 seconds. Subjects followed a lead vehicle that
braked gently for 5 seconds at random points, which
required subjects to release the accelerator pedal and
depress the brake pedal within a short time window to
avoid a collision. Subjects' responses to the lead vehicle
braking event were measured in terms of the
accelerator-release reaction time (ART) and brake
reaction time (BRT). Driving performance such as SDLP
and lane departures was also measured.
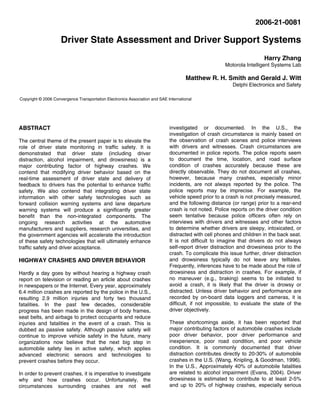
Figure 1 depicts the total eyes-off-road glance duration
within a time window (e.g., 60 seconds), accelerator
release reaction time, and SDLP across different
distraction conditions. As the total glance duration
increases, the accelerator release reaction time to lead
vehicle braking events is lengthened, and SDLP is
increased. The similar increase in these measures is
quantified in terms of high correlations among them. The
Pearson correlation coefficient is 0.60 between the total
eyes-off-road time and accelerator-release reaction time,
and 0.73 between the total eyes-off-road time and SDLP
(Zhang, Smith, & Witt, in press). These findings
substantiated the claim that the total eyes-off-road time
within a short time window is a diagnostic measure of
visual distraction that has a direct impact on driving
performance.
4. Eye movement patterns also vary with cognitive
distraction. Recarte and Nunes (2000) discovered that
when subjects engaged in a mental task (e.g.,
answering questions that required image generation and
rotation), standard deviations of horizontal and vertical
eye fixations were smaller than the baseline condition.
Cognitively distracted subjects do not tend to scan the
visual environment, a phenomenon sometimes called
"cognitive tunneling". Lee, Reyes, Smyser, Liang, and
Thornburg (2004) have found that the variability of
saccade distance, the number of fixations, and the
fixation duration change when subjects are cognitively
distracted.
Figure 1. Normalized acceleration release reaction time (denoted by +) or SDLP (denoted by X) as a function of
normalized total eyes-off-road glance time. Actual reaction time values are divided by the maximum
reaction time value among all conditions to generate normalized values. Normalized SDLP and
eyes-off-road time are obtained in a similar fashion.
Eye tracking systems have also showed promises in
detecting driver drowsiness and alcohol impairment.
Seeing Machines' Facelab system, Attention
Technologies' Driver Fatigue Monitor, and Delphi's
Driver State Monitor are capable of detecting slow eyelid
closures that are characteristic of driver drowsiness
(Edenborough, et al., 2004; Grace & Steward, 2001; von
Jan, Karnahl, Seifert, Hilgenstock, & Zobel, 2005;
www.seeingmachines.com).
When human subjects are asked to keep their head in
the forward direction and move their eyes to look at a
light at a peripheral location (e.g., 400
of lateral
eccentricity), a slight drift of the eye toward the
centerline occurs. For a sober subject, this drift is
corrected by smooth pursuit eye movements. At a high
level of blood-alcohol concentration (e.g., BAC>0.08%),
the smooth pursuit eye movements are impaired, and
the correction is achieved by jerky saccades. The jerky
saccades are called horizontal gaze nystagmus. The
nystagmus is as large as a few degrees and may be
detectable by eye tracking systems. For sober subjects,
the nystagmus does not occur within 450
of lateral
eccentricity. For intoxicated subjects, the nystagmus
occurs with a lateral eccentricity of less than 450
and the
magnitude of the nystagmus increases with the BAC
level (Anderson, Schweitz, & Snyder, 1983; Tharp,
Burns, & Moskowitz, 1981).
DRIVER BEHAVIOR MODIFICATION
In parallel with the development of driver state
monitoring technologies, research has been conducted
to investigate how the driver state information can be
applied to modify driver behavior and enhance traffic
safety. Figure 2 illustrates a general framework of
impairment and distraction mitigation. This line of
research has been referred to as "adaptive automation"
(Zhang, Smith, & Witt, in press) or "workload
management" (Green, 2004), which is an important
aspect of driver support systems.
Figure 2 illustrates the philosophy of impairment
mitigation. When driver drowsiness is detected, a
0.5
0.6
0.7
0.8
0.9
1
1.1
0.2 0.3 0.4 0.5 0.6 0.7 0.8 0.9 1 1.1
0.5
0.6
0.7
0.8
0.9
1
1.1
Normalized Total Eyes-Off-Road Time
NormalizedReactionTime
NormalizedSDLP
0.5
0.6
0.7
0.8
0.9
1
1.1
0.2 0.3 0.4 0.5 0.6 0.7 0.8 0.9 1 1.1
0.5
0.6
0.7
0.8
0.9
1
1.1
Normalized Total Eyes-Off-Road Time
NormalizedReactionTime
NormalizedSDLP
5. combination of visual, auditory, haptic, and olfactory
warnings should be delivered to the driver. The visual,
auditory, and haptic warnings should be able to capture
drivers' attention and make the drivers aware of their
condition. Drivers are requested to take a break or a
short nap (e.g., a 15-minute nap). Short naps have been
shown to extremely effective in restoring driver alertness
(Driskell, & Mullen, 2005; Trucking Research Institute,
Applied Science Group Inc., Institute of Circadian
Physiology, Liberty Mutual Research Center, & Stern,
1999). As reviewed by Driskell and Mullen (2005), short
naps are very effective in improving both performance
and subjective feeling of drowsiness. Olfactory stimuli
such as peppermint or citrus-scented air in the vehicle
cabin have a great potential of restoring driver alertness
(Ho & Spence, 2005). Blue lights are also shown to
increase driver alertness (Brainard, G. C., Hanifin, J., P.,
Greeson, J. M., Byrne, B., Glickman, G., Gerner, E., &
Rollag, M. D., 2001; Lockley, Evans, Scheer, Brainard,
Czeisler, & Aaschbach, 2006).
Figure 2. Attention allocation to driving and non-driving tasks. The open bars represent attention allocated to the driving
task, the gray bars represent attention allocated to the non-driving task, and the dashed bar represents attention deficit
attributable to driver impairment or drowsiness. The vertical lines represent the demand imposed by the driving task.
Figure 2 also illustrates the philosophy of distraction
mitigation. When the level of distraction exceeds a
threshold, a distraction feedback should be delivered to
drivers. The feedback may be visual, auditory, or haptic.
The feedback must be acceptable to drivers. Figure 3
shows a method of indicating to the driver that the level
of distraction has exceeded a threshold. When the
orange bezel is turned on, drivers are advised to reduce
eye glances at the display and increase eye glances at
the forward road.
Figure 3. When a driver looks at the display excessively, the orange bezel is turned on to advise the driver to glance less
at the display and more at the forward road.
Attentive driving
“Routine” driving
Distracted driving
Impaired driving
Low Driving
Demand
High Driving
Demand
Moderate Driving
Demand
Attention
allocated to
non-driving
tasks
Attention
allocated to
driving tasks
Attentive driving
“Routine” driving
Distracted driving
Impaired driving
Low Driving
Demand
High Driving
Demand
Moderate Driving
Demand
Attention
allocated to
non-driving
tasks
Attention
allocated to
driving tasks
6. As part of the SAVE-IT research, Lee, Reyes, Smyser,
Liang, and Thornburg (2004) presented an orange bezel
on the display for a secondary task when the visual
distraction level exceeded a specified threshold. The
orange bezel indicated to the subjects that they looked
at the IVIS device excessively and they are advised to
look at the forward road more frequently. With this
advising strategy, subjects indeed looked at the in-
vehicle display less frequently. Furthermore, subjects
found the advising strategy both useful and satisfying.
Consequently, subjects complied with the strategy by
looking at the in-vehicle display less often.
In order to match task demands with drivers' capabilities,
demands for both driving and non-driving tasks should
be assessed. The distraction potential of non-driving
tasks should be assessed. For example, the distraction
potential is high for manually dialing a 10-digit phone
number and low for pressing a preset button to change
radio stations. The driving task demand should be
determined from traffic, road, and weather conditions.
For example, driving task demand is high under heavy
traffic and poor weather condition, and low under light
traffic and good weather and road conditions. Non-
driving tasks of low distraction potential may be safely
performed under most driving conditions, but non-driving
tasks of high distraction potential should be advised not
to be performed under a high-demand driving condition.
One method of conveying the advisories is to change
the color of button labels to amber from a neutral color.
As shown in Figure 4, button labels for the number keys,
"Clear" key, "Clear All" key, and "Send/End" key are
changed to amber from white to indicate that the manual
dialing task should not be engaged under a high-
demand driving condition. In order to make the system
acceptable to drivers, drivers should be allowed to dial
manually if they insist on doing so. Disallowing manual
dialing completely without drivers' permission will be
annoying and frustrating. Drivers may also take
additional time to fight the system to make a call, which
will lead to additional distraction. To enhance system
effectiveness, it is imperative that the system advise and
support the driver but do not take control of the driver.
Figure 4. The color of the labels for the number keys, "Clear" key, "Clear All" key, and "Send/End" key is changed to
amber from white to indicate to the driver that the actions represented by these buttons should not be performed under a
high-demand driving condition.
The adaptive automation approach holds great promises
to modify the driver behavior so that drivers are less
likely to be distracted, drowsy, or otherwise impaired and
more likely to be alert and attentive. Because driver
behavior is the single most important contributing factor
of traffic safety (Evans, 2003, 2004), this approach has
the potential to prevent many crashes and near misses.
The relation between the driver state and crashes is not
a direct one-to-one mapping. Driver state is only one
contributing factor of crashes, although it is an important
factor. A distracted driver does not crash all the time
because for a crash to occur, other factors would have
to occur. For example, a distracted driver cannot crash
into other vehicles if these vehicles do not exist, and a
drowsy driver will not die even if he or she leaves the
road with a wide shoulder and flat medium beyond the
shoulder. In other words, driver distraction, drowsiness,
and impairment do not always lead to crashes. Because
crashes are rare and driver distraction and impairment
do not always produce a crash, many drivers believe
that driver distraction and impairment do not pose a
significant risk to safety. One challenge is that it is
difficult to demonstrate its impact on traffic safety in
studies with a limited number of subjects and a short
timeframe. To truly assess the impact, technologies
should be implemented in instrumented vehicles and
before-after comparisons should be made from real life
data.
7. Perhaps principles of behavior modification proposed by
B. F. Skinner are good guides for molding driving
behaviors and habits (Skinner, 1969). Skinner has
shown that reinforcement and incentive are far more
effective than punishments in molding human behaviors.
Driving safely is obviously an incentive, but it may not be
sufficient for many drivers. The driver state monitor can
provide positive feedback and pleasant messages to
reinforce positive behaviors. Perhaps the insurance
industry can provide a discount on premiums based on
driver behavior, and the government can provide tax
benefits for employing safety technologies to facilitate
the behavior modification process.
ENHANCING CRASH AVOIDANCE SYSTEMS
WITH DRIVER STATE MONITORING
Because a considerable number of crashes are rear-end
crashes, forward collision warning (FCW) systems have
been developed to warn the drivers when the host
vehicle approaches an evolving threat in the forward
path. Similarly, lane departure warning (LDW) systems
have been developed to warn the drivers when the host
vehicle leaves the road to prevent single-vehicle road
departure crashes. If the FCW and LDW systems warn
the driver when and only when a true threat is present at
the time that the driver truly needs it, these systems
could significantly reduce automobile crashes. However,
it is not easy to determine when and how to warn the
driver without driver state information.
In typical FCW and LDW systems, the onset of warnings
is determined by a threat assessment algorithm with an
assumed reaction time window within which drivers are
assumed to respond. As indicated above, a major factor
for reaction time is driver state. Without knowing the
driver state, the reaction time may be overestimated or
underestimated. If drivers' reaction time is over-
estimated, warnings will be delivered too soon, which
will lead to a high level of nuisance alerts. If drivers'
reaction time is under-estimated, on the other hand,
warnings will be delivered too late, which will not provide
the necessary safety margin and render warnings
ineffective. Therefore, driver state information should be
fused with other driver support systems to enhance
safety benefits, minimize nuisance alerts, and optimize
driver acceptance. Driver state information is especially
important because the analysis of crash data has
revealed that a major contributing factor for rear-end and
single-vehicle road departure crashes is driver
distraction, drowsiness, and impairment (Campbell,
Smith, & Najm, 2002; Neale, Dingus, Klauer, Sudweeks,
& Goodman, 2005).
The FCW and LDW systems can be made adaptive
using the driver state information. Smith and Zhang
(2004) performed a simulator experiment to compare
three different adaptation methods with a non-adaptive
baseline condition. The following adaptation methods
were studied.
• The “Suppress” Method: Suppress imminent alerts
(including the audio component) when the driver is not
engaged in a distraction task;
• The “Auditory” Method: Modify the warning delivery
method, for example, using voice messages such as
“vehicle braking”, “drifting left”, and “drifting right” instead
of a warning tone;
• The “Timing” Method: Change the timing of the
alerts, for example, delivering earlier alerts for distracted
drivers and later alerts for non-distracted drivers. In
Smith and Zhang (2004), the predicted alerted reaction
time that was used in the FCW algorithm was 3 seconds
for the distracted condition and 1 second for the non-
distracted condition. Figure 5 illustrates that when a
driver is distracted, earlier FCW warnings are delivered
to the driver to provide the driver the extra time to brake
or slow down the host vehicle.
8. Figure 5. A quad-display illustrating adaptive FCW warnings. The top left quad depicts that the host vehicle is
approaching a close vehicle in the forward path. The top right quad displays a face image of a distracted driver and the
bottom left quad illustrates the detection of driver distraction and the logic of increasing the brake reaction time estimate
for the distracted driver. The bottom right quad shows a side-by-side comparison between a nominal FCW system and an
adaptive FCW system. In a nominal FCW system, a nominal reaction time value is used as an input parameter in the
threat assessment that produces a cautionary warning (indicated by a small yellow icon). In an adaptive FCW system, a
larger reaction time value is used as an input parameter in the threat assessment that produces an imminent warning
(indicated by a large red icon). The main effect of the adaptation is an earlier warning for distracted drivers.
Figure 6. Accelerator release reaction time as a function
of distraction and adaptation method.
Figure 6 presents the accelerator release reaction time
results for four adaptation conditions. For the non-
adaptive baseline condition, reaction time was longer for
the distracted condition than for the non-distracted
condition. Using the “suppress” and “auditory”
adaptation methods, reaction times were also longer for
the distracted condition. When the “timing” method was
used, however, the reaction times were faster for the
distracted condition than for the non-distracted condition.
The reversal of reaction time can be partly explained by
the timing adaptation over-compensating for the
influence of distraction. Nonetheless, the reaction time
results demonstrate that driver responses to lead vehicle
braking events can be shortened significantly by
delivering earlier alerts to distracted drivers. Subjects
indicated that they trusted the timing method and the
timing adaptation was not annoying.
A modification of warning onset has been announced by
original equipment manufacturers such as Toyota
(http://www.toyota.co.jp/en/news/05/0906.html).
Similarly, driver state information can be used to
enhance the LDW systems. Human factors research has
shown that if a driver is not distracted, drowsy, or
impaired, unintended lane and road departures do not
occur (Zhang, Smith, & Witt, in press). Therefore, LDW
warnings are not necessary for attentive and alert
drivers. Figure 7 illustrates that when a driver is
distracted, nominal LDW warnings will be delivered, but
when a driver is attentive, no LDW warnings will be
delivered. This concept has been shown to reduce driver
annoyance and enhance driver acceptance in the SAVE-
IT program (Smith & Zhang, 2004).
0.0
0.2
0.4
0.6
0.8
1.0
1.2
1.4
1.6
1.8
2.0
Non-adaptive Timing Suppress Auditory
Method of Adaptation
AcceleratorReleaseTime(s)
0.0
0.2
0.4
0.6
0.8
1.0
1.2
1.4
1.6
1.8
2.0
Non-adaptive Timing Suppress Auditory
Method of Adaptation
Non-adaptive Timing Suppress Auditory
Method of Adaptation
AcceleratorReleaseTime(s)
0.0
0.2
0.4
0.6
0.8
1.0
1.2
1.4
1.6
1.8
2.0
Non-adaptive Timing Suppress Auditory
Method of Adaptation
Non-adaptive Timing Suppress Auditory
Method of Adaptation
AcceleratorReleaseTime(s)
0.0
0.2
0.4
0.6
0.8
1.0
1.2
1.4
1.6
1.8
2.0
Non-adaptive Timing Suppress Auditory
Method of Adaptation
Non-adaptive Timing Suppress Auditory
Method of Adaptation
AcceleratorReleaseTime(s)
Distracted
Non-Distracted
0.0
0.2
0.4
0.6
0.8
1.0
1.2
1.4
1.6
1.8
2.0
Non-adaptive Timing Suppress Auditory
Method of Adaptation
Non-adaptive Timing Suppress Auditory
Method of Adaptation
AcceleratorReleaseTime(s)
0.0
0.2
0.4
0.6
0.8
1.0
1.2
1.4
1.6
1.8
2.0
Non-adaptive Timing Suppress Auditory
Method of Adaptation
Non-adaptive Timing Suppress Auditory
Method of Adaptation
AcceleratorReleaseTime(s)
0.0
0.2
0.4
0.6
0.8
1.0
1.2
1.4
1.6
1.8
2.0
Non-adaptive Timing Suppress Auditory
Method of Adaptation
Non-adaptive Timing Suppress Auditory
Method of Adaptation
AcceleratorReleaseTime(s)
0.0
0.2
0.4
0.6
0.8
1.0
1.2
1.4
1.6
1.8
2.0
Non-adaptive Timing Suppress Auditory
Method of Adaptation
Non-adaptive Timing Suppress Auditory
Method of Adaptation
AcceleratorReleaseTime(s)
Distracted
Non-Distracted
9. Figure 7. Two quad-displays illustrate an adaptive LDW system, the left side for a distracted driver, and the right side for
an attentive driver. Within each side, the top left quad illustrates a road departure (left side) or a lane deviation (right side),
the top right quad shows a face image of a distracted driver (left side) or an attentive driver (right side), the bottom left
quad indicates the detection of the driver state (driver distraction on the left side, and no distraction on the right side), and
the bottom right quad shows the visual warnings to drivers. On the left side, the driver is distracted, which leads to a road
departure. Therefore, a LDW warning is delivered for the both nominal and adaptive LDW systems. On the right side, the
driver is attentive, and the lane departure is intentional. Therefore, no LDW warning is delivered in an adaptive LDW
system.
EVALUATION
Driver support systems should be evaluated to
determine whether they will enhance traffic safety,
minimize nuisance alerts, and optimize driver
acceptance. Traffic safety can be measured with
performance metrics including the following:
• Accelerator-release or brake reaction time to a
decelerating vehicle in the forward path;
• Reduction of crashes, crash velocity, near crashes
or close calls;
• Steering correction after an unintended lane or road
departure;
• Reduction of unintended lane or road departures;
• Reduction of lane position variability (e.g., SDLP);
• Reduction of steering errors;
• Reduction of distraction (e.g., eyes-off-road time),
drowsiness (e.g., eye closures), and impairment;
• Increase of event detection (e.g., detecting bicycle
incursions and traffic light changes).
It is important that driver support systems truly assist the
driver and not cause additional distraction or lengthen
reaction times. A careful design of human-machine
interface (HMI) is imperative. Drivers do not respond to
warnings reflexively and they will usually assess the
environment before deciding on a response (DOT HS
809 886). Warnings are used to get a driver's attention,
but processing of warnings also takes time. It is
important to make warnings simple and intuitive to
reduce the time required for the comprehension of
warnings. We should not use poorly designed distraction
warnings that confuse drivers and introduce additional
distractions. In addition, FCW or LDW warnings may be
suppressed when the driver is attentive.
Nuisance alerts and driver acceptance are related.
Driver acceptance will be low if many nuisance alerts
occur, and acceptance will be high if very few nuisance
alerts occur. One type of nuisance alerts is false alarms,
which are often caused by sensor failures (e.g.,
detecting objects that do not exist). Another type of
nuisance alerts occurs because warnings are issued too
early or warnings are unnecessary (e.g., alerts for
roadside clutter) or too intense (e.g., using loud audio
when visual icons suffice). Again, HMI features must be
carefully designed to minimize nuisance alerts.
Frequently, a mix of visual, auditory, and haptic
warnings (e.g., seat vibration) should be used to achieve
minimal annoyance and optimum acceptance. Haptic
warnings can be very effective because they can
communicate urgency to drivers without a high level of
annoyance that is often associated with auditory
warnings.
The level of nuisance alerts and driver acceptance can
be assessed subjectively with a rating scale. After some
experience with the system, subjects are asked to rate
the system in terms of annoyance, warning timing (too
early or too late), perceived usefulness, trust, and overall
acceptance.
To maximize warning effectiveness, functions of driver
support systems should match drivers' mental models.
10. Because fully autonomous driving is unlikely in the near
future, driver support systems should leave the driver in
control and assist the driver by providing timely alerts
and gentle reminders. Drivers will resist a system that
generates what is perceived as criticisms or nagging. In
addition, confidentiality must be maintained. Driver state
information should not be made available for the public
to be scrutinized. Drivers will resist a system that is
perceived as spying on the drivers.
The evaluation of safety benefits and driver acceptance
can be conducted in driving simulators, test tracks, and
the field. For safety evaluation, human subjects are
typically required to be exposed to a real or simulated
threat (e.g., a decelerating vehicle in the forward path).
Because of ethical and liability concerns, it is not
possible to expose human subjects to real threats that
are known to occur. Human responses to severe events
can be observed in driving simulators and potential
safety benefits can be inferred. Because testing
conditions and driver expectations can be tightly
controlled and human subjects are not exposed to
undue risk, driving simulators are ideal for evaluating
potential safety benefits. Safety benefits may be
evaluated in a natural environment in a field operational
test (FOT). Even in a large-scale FOT, however, safety
benefits may not be adequately assessed (DOT HS 809
886).
For the evaluation of nuisance alerts and driver
acceptance, a field test is ideal because the real world
provides a natural and rich environment for producing
both true alerts and a realistic level of false alarms and
nuisance alerts, which are critical to acquire a valid
assessment. It is difficult, if not impossible, to simulate
the rich and complex environment in driving simulators.
In order to acquire truly valid assessment, human
subjects should be allowed to drive instrumented
vehicles extensively to get over the novelty effect.
OBSTACLES
Despite the promise of driver support systems in crash
avoidance, major obstacles exist for a widespread
adoption of these systems. One is the phenomenon of
over-confidence. Most drivers believe that they are
better than average drivers (Evans, 2004). Of course,
this is mathematically impossible. Many drivers hold the
belief that driver support systems are not necessary or
useful for themselves, even though they believed that
these systems should help other drivers in crash
avoidance (DOT HS 809 886).
Another obstacle is that safety itself may not be
sufficient for many drivers to modify their behavior and
deploy driver support systems. Because on average a
crash occurs once every 10 years for a typical driver,
crash avoidance is not on a driver's mind continuously.
However, highway crashes produce a large economic
cost, personal pain and suffering, other stakeholders,
including the government, automotive industry, and
insurance industry, should take actions to expedite the
adoption of driver support systems. For example, the
government can pass tax laws that favor crash
avoidance technologies and products, the vehicle
manufacturers can install more safety products in their
vehicle lineups, and the insurance companies can
provide premium discounts to vehicle owners with safety
products.
Another obstacle is the argument that I know when I am
tired and I will stop driving when I am really sleepy. If
this is true, there would be not need for a drowsy driver
monitoring and mitigation system. However, this is false
because if it were true, there would be few drowsiness-
related crashes. In fact, we do not always know when
we are sleepy and we do not always stop driving even
when we know we are tired. A related argument is that I
have to drive even when I am sleepy because I have to
go somewhere or get home after a long day at office.
This sounds like a reasonable argument, but it is risky
because saving a few minutes of time is not worth
risking one's life or property. Research has shown that
taking a 15-minute nap can increase alertness
significantly.
Finally, more resources should be allocated to develop
and evaluate effective and acceptable driver support
systems. More research is needed to develop optimum
HMI features that truly assist the driver. In this regard,
data-driven design is critical.
CONCLUSION
A large portion of highway crashes are attributable to
poor driver state including driver distraction, drowsiness,
and impairment. We have reached a point that the driver
state can be assessed in real time and non-intrusively
from driving performance and automatic eye tracking
systems. Feedback about driver state can be provided
so that driver behavior can be modified. Distraction
feedback can reduce the eye glances away from the
forward road and increase the eye glances to the
forward road. Drowsiness feedback can be delivered to
drivers so that they can take a break before unfortunate
events occur. Driver state information can also be fused
with forward collision warning systems and lane
departure warning systems to enhance safety benefits
and driver acceptance and minimize nuisance alerts.
With these driver support systems, we should see a drop
in highway crashes in the near future.
11. REFERENCES
Anderson, T. E., Schweitz, R. M., & Snyder, M. B.
(1983). Field Evaluation of a Behavioral Test Battery for
DWI (Driving While Intoxicated), DOT-HS-806-475. NTIS
PB84121169.
Automotive Collision Avoidance System Field
Operational Test (ACAS FOT): Final Program Report.
DOT HS 809 886.
Brainard, G. C., Hanifin, J., P., Greeson, J. M., Byrne,
B., Glickman, G., Gerner, E., & Rollag, M. D. (2001).
Action spectrum for melatonn regulation in humans:
Evidence for a novel circadian photoreceptor. Journal of
Neuroscience, 21(16), 6405-6412.
Campbell, B. N., Smith, J. D., & Najm, W. G. (2002).
Examination of crash contributing factors using national
crash databases. DOT-VNTSC-NHTSA-02-07.
Dalrymple-Alford, J. C., Kerr, A., & Jones, R. (2003).
The effects of alcohol on driving-related sensorimotor
performance across four times of day. Journal of Studies
on Alcohol, 64, 93-97.
De Waard (1996). The measurement of drivers’ mental
workload. http://home.zonnet.nl/waard2/mwl.htm.
Driskell, J. E., & Mullen, B. (2005). The efficacy of naps
as a fatigue countermeasures: A meta-analytic
integration. Human Factors, 47, 360-377.
Edenborough, N., Hammoud, R., Harbach, A., Ingold,
A., Kisacanin, B., Malawey, P., Newman, T.,
Scharenbroch, G., Skiver, S., Smith, M., Wilhelm, A.,
Witt, G., Yoder, E., & Zhang, H. (2004). Drowsy driver
monitor from Delphi. Demonstration at IEEE CVPR
2004, Washington, DC.
Engstrom, J. (2004). The EU's Adaptive Integrated
Driver-Vehicle Interface Project (AIDE). Presentation at
"Adaptive Driver Assistance Workshop on International
Research Perspectives", Washington, D.C., May 13-14,
2004.
http://www.volpe.dot.gov/opsad/saveit/workshop.html
Evans, L. (2003). A new traffic safety vision for the
United States. American Journal of Public Health, 9,
1384-1386.
Evans, L. (2004). Traffic safety. Science Serving
Society. Bloomfield Hills, MI.
Grace, R., & Steward, S. (2001). Drowsy driver monitor
and warning system. Proceedings of the First
International Driving Symposium on Human Factors in
Driver Assessment, Training and Vehicle Design (pp.
64-69), Snowmass Village, Aspen, CO. August 14-17,
2001.
Green, P., Cullinane, B., Zylstra, B., & Smith, D. (2004).
SAfety VEhicles using adaptive Interface Technology
(Task 3A): Typical Values for Driving Performance with
Emphasis on the Standard Deviation of Lane Position: A
Summary of the Literature.
http://www.volpe.dot.gov/opsad/saveit/docs/dec04/litrev_
3a.pdf.
Ho, C., & Spence, C. (2005). Olfactory facilitation of
dual-task performance. Neuroscience Letters, 389, 35-
40
Horne, J. A. & Reyner, L. A. (1995). Sleep-related
vehicle accidents. British Medical Journal, 310, 565-567.
Lee, J., Reyes, M., Smyser, T., Liang, Y., & Thornburg,
K. (2004). SAfety VEhicles using adaptive Interface
Technology (Task 5). Final Report: Phase 1.
http://www.volpe.dot.gov/opsad/saveit/docs/dec04/finalr
ep_5b.pdf.
Lockley, S. W., Evans, E. E., Scheer, F. A. J. L.,
Brainard, G. C., Czeisler, C. A., & Aaschbach, D. (2006).
Short-wavelength sensitivity for the direct effects of light
on alertness, vigilance, and the waking
electroencephalogram in humans. Sleep, 29, 161-168.
Nakayama, O., Futami, T., Nakamura, T., & Boer, E. R.
(1999). Development of a steering entropy method for
evaluating driver workload. SAE 1999-01-0892.
Warrendale, PA: Society of Automotive Engineers.
Neale, V. L., Dingus, T. A., Klauer, S. G., Sudweeks, J.
Goodman, M. (2005). An overview of the 100-car
naturalistic study and findings. The 19th International
Technical Conference on the Enhanced Safety of
Vehicles (Paper # 05-0400). DOT HS 809 825. June
2005: Washington, DC.
Ranney, T. A., Mazze, E., Garrott, R., & Goodman, M. J.
(2000): NHTSA driver distraction research: Past,
present, and future. Paper presented at the Public
Meeting on Driver Distraction sponsored by NHTSA,
July 2000. Available from http://www-
nrd.nhtsa.dot.gov/departments/nrd-13/driver-
distraction/PDF/233.PDF.
Recarte, M. A., & Nunes, L. M. (2000): Effects of verbal
and spatial – imagery tasks on eye fixations while
driving. Journal of Experimental Psychology: Applied. 6,
31-43.
Rensink, R. A., O'Regan, J. K., & Clark, J. J. (1997). To
see or not to see: The need for attention to perceive
changes in scenes. Psychological Science, 5, 368-373.
12. Rizzolatti, G., Riggio, L., & Sheliga, B. M. (1994). Space
and selective attention (pp. 231-265), In C. Umilta, & M.
Moscovitch (Eds), Attention and Performance, XV.
Cambridge, MA: MIT Press.
Skinner, B. F. (1969). Contingencies of reinforcement.
New York: Appleton-Century-Crofts.
Smith, M., & Zhang, H. (2004). SAfety VEhicles using
adaptive Interface Technology (Task 9): Safety warning
countermeasures. Available at
http://www.volpe.dot.gov/opsad/saveit/docs.html
Stark L., & Ellis, S. R. (1981). Scanpaths revisited:
Cognitive models direct active looking (pp. 193-226). In
D. F. Fisher, R. A. Monty, & J. W. Senders (Eds.), Eye
movements: Cognition and visual perception. Erlbaum,
NJ.
Tharp, V., Burns, M., & Moskowitz, H. (1981).
Development and field test of psychological tests for
DWI arrest. DOT-HS-8-01970. NTIS PB81-203721.
Trucking Research Institute, Applied Science Group Inc.,
Institute of Circadian Physiology, Liberty Mutual
Research Center, & Stern, J. (1999). Eye-activity
measures of fatigue and napping as a fatigue
countermeasure. FHWA-MCRT-99-010.
von Jan, T., Karnahl, T., Seifert, K., Hilgenstock, J., &
Zobel, R. (2005). Don't sleep and drive – VW's fatigue
detection technology. Proceedings of the 19th
International Technical Conference on the Enhanced
Safety of Vehicles. Washington, DC. June 2005. DOT
HS 809 825
Wang, J. S., Knipling, R. R., & Goodman, M J. (1996).
The role of driver inattention in crashes: New statistics
from the 1995 crashworthiness data system. The 40th
Annual Proceedings of the Association for the
Advancement of Automotive Medicine, October 7-9,
1996. Vancouver, British Columbia.
Witt, G. J., Zhang, H., & Smith, M. (2004). SAfety
Vehicle(s) using adaptive Interface Technology (SAVE-
IT); Phase I Progress. Presentation at "Adaptive Driver
Assistance Workshop on International Research
Perspectives", Washington, D.C., May 13-14, 2004.
http://www.volpe.dot.gov/opsad/saveit/workshop.html
Zhang, H., Smith, M. R. H., & Witt, G. J. (in press).
Identification of real-time diagnostic measures of visual
distraction with an automatic eye tracking system.
Human Factors.
ACKNOWLEGEMENT
The research presented herein was sponsored by and
performed at Delphi Electronics & Safety.
CONTACT
Address correspondence to Harry Zhang, Ph.D.,
Motorola Intelligent Systems Lab, 2900 South Diablo
Way, Tempe, AZ 85282. Email:
harryzhang@motorola.com.