1. Name:____________________________________________Date:_____________Period:______________
Graphing Lab Data:
Goal: collect data from a lab setting and communicate your results by creating a scatter plot.
Materials:
o Piece of string
o Ruler (cm)
o Pen/cil
o Lab sheet
Procedures:
o Using the string measure the diameter and the circumference of at least 10 different round objects in
the room.
Diameter is the distance from one side of the round object, straight through, to the other side of
the round object.
Circumference is the circular distance around the object.
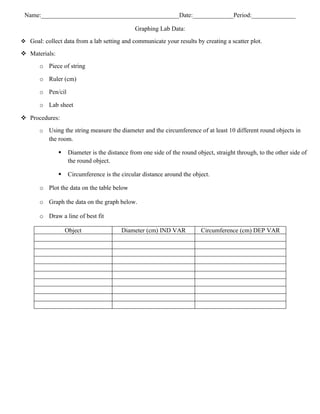
o Plot the data on the table below
o Graph the data on the graph below.
o Draw a line of best fit
Object Diameter (cm) IND VAR Circumference (cm) DEP VAR
2. Follow up questions:
1. According to your measurements, graphs, and predictions do you see any relationships between diameter and
circumference of a round object? If so what are they?________________________________________________
____________________________________________________________________________________________
_____________________________________________________________________________________
2. Predictions:
a. What is the diameter of an object with a circumference of 24 cm? _________.
b. What is the circumference of an object with a diameter of 6 cm? __________.
c. What is the circumference of an object with a radius of 2 cm? __________.