
Recommended
More Related Content
Recently uploaded
Recently uploaded (20)
Featured
Featured (20)
ملخص مشروع six sigma..مهندس عادل حجازى
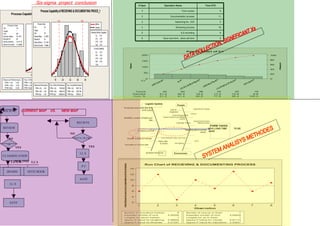
- 1. .Six-sigma project conclusion # Oper Operation Name Time STD Process Capability of RECIEVING & DOCUMENTING PROCE_1 1 Form review 5 Process Capability of RECIEVING & DOCUMENTING PROCESS 2 Documentation process 11 LSL USL 3 Searching for JCN 5 LSL USL Process Data Within Process Data Within LSL 19 LSL 20 Overall 4 Renewing process 18 Overall Target * Target * USL 66 USL 45 Potential (Within) Potential (Within) Capability Capability 5 ILS recording 9 Sample Mean 33.875 Sample Mean 31.5833 Cp 0.63 Cp 0.51 Sample N 24 Sample N 24 CPL 0.40 CPL 0.47 6 .Save new form , store old form 5 StDev (Within) 12.4113 CPU 0.86 CPU 0.55 StDev (Within) 8.17145 StDev (Ov erall) 13.2088 Cpk 0.40 Cpk 0.47 StDev (Overall) 7.25884 Ov erall Capability Ov erall Capability Pp 0.59 Pp 0.57 Pare to Chart of C1 PPL 0.38 PPU 0.81 PPL 0.53 200 100 Ppk 0.38 PPU 0.62 80 Cpm * Ppk 0.53 150 Pr e t ecn Cpm * o t Cn 60 u 100 40 50 20 10 20 30 40 50 60 0 0 Observ ed Perf ormance Exp. Within Perf ormance 16 24 Exp. Ov erall Perf ormance 32 40 48 C1 E S G G N G IV IL IN IN IO N PPM < LSL 0.00 PPM < LSL 115361.21 PPM < LSL 130053.31 E NT W AT VI PPM > USL Observ ed Perf ormance Exp. Within Performance Exp. Overall Performance EC E E IC SA PPM > USL 0.00 4821.75 PPM > USL 7506.15 R M EN SI F CU R PPM Total 0.00 PPM Total 120182.96 0.00 PPMPPM < LSL 137559.46 PPM < LSL 55271.62 PPM < LSL Total 78162.88 O LS D C PPM > USL 0.00 PPM > USL 50305.76 PPM > USL 32277.89 Count 42 40 38 34 25 19 PPM Total 0.00 PPM Total 128468.64 PPM Total 87549.51 Percent 21.2 20.2 19.2 17.2 12.6 9.6 Cum % 21.2 41.4 60.6 77.8 90.4 100.0 Logistic System People Wrong data stored about that form Organizational Changes Lack of RECIEVE CURRENT MAP VS. NEW MAP in the system Experienc e Turnover Unclear - Responsibilities Support personnel have different Reliability ( number of failures per priorities (day Support personnel have RECIEVE Inadequate Training different priorities FORM TAKES REVIEW TOO LONG TIME TO BE Increasing workload Renewing data in several places SAVE NO NO DATA IS OK Multiple variables to evaluate UNCOMFORTABLE SITTING Many data noise to review bad lighting ok Incomplete or incorrect data YES YES “ .I.L.S WORKIN PROCESS Environmen CLASSIFICATION t T.C.T.O INSP T.C.I .SCH. Run Chart of RECIEVING & DOCUMENT ING PROCESS R C V G D C M N IN P O E S .P.C E IE IN & O U E T G R C S 14 .NOTE BOOK .BOARD .NOTE BOOK 12 SAVE 10 .I.L.S 8 6 4 SAVE 2 1 2 3 4 5 6 7 8 Obse rvation Num ber of runs about m edi an: 8 Num ber of runs up or down: 7 Expected num ber of runs: 5.00000 Expected num ber of runs: 5.00000 Longest run about m edi an: 1 Longest run up or down: 1 Approx P-Val ue for Cl usteri ng: 0.98903 Approx P-Val ue for T rends: 0.97173 Approx P-Val ue for M i xtures: 0.01097 Approx P-Val ue for Osci l l ati on: 0.02827