5. Text(0.5, 1.0, 'All Time Medals of top 10 countries')
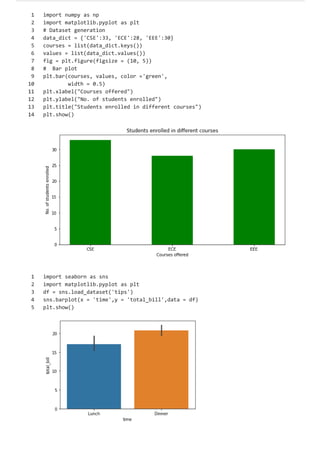
1
2
3
indpie = df[df['Country']=='United States']['Medal'].value_counts()
indpie.plot(kind='bar',figsize=(10,8))
6. <matplotlib.axes._subplots.AxesSubplot at 0x7fb62e63ccd0>
/usr/local/lib/python3.7/dist-packages/seaborn/_decorators.py:43: FutureWarning:
Pass the following variable as a keyword arg: x. From version 0.12, the only valid p
Text(0, 0.5, 'No. of Athlete')
1
2
3
4
5
plt.figure(figsize=(10, 5))
sns.countplot(df['Year'])
plt.title('Total Athletes contribution in summer olympics over time')
plt.xlabel('Years')
plt.ylabel('No. of Athlete')
1
3
4
5
2
6
athlete_order = df['Athlete'].value_counts().head(10).index
sns.countplot(data=df, y='Athlete', order=athlete_order)
plt.title('Top 10 Athletes with the most awarded Medals')
plt.xlabel('No. of awrded medals')
plt.figure(figsize=(9, 5))
plt.ylabel('Athlete Name');
7. Text(0, 0.5, 'No. of Medals')
1
2
3
4
5
6
7
plt.figure(figsize=(15, 5))
highest_sport = df['Sport'].value_counts().index
sns.countplot(data=df, x='Sport', order=highest_sport)
plt.xticks(rotation=75)
plt.title('Sports with most awarded Medals')
plt.xlabel('Sport')
plt.ylabel('No. of Medals')
1
2
3
sns.countplot(x='Year',hue='Medal',data=df)
sns.set(rc={'figure.figsize':(10,10)})
plt.title("Type of medals won over the years")
8. Text(0.5, 1.0, 'Type of medals won over the years')
<matplotlib.axes._subplots.AxesSubplot at 0x7fb62e50efd0>
1 sns.countplot(x="Medal", hue="Gender", data=df)
1
2
3
4
5
6
7
gender_group = df.groupby(['Year', 'Gender']).size().unstack()
gender_group.apply(lambda x:x/x.sum(), axis=1).plot(kind='barh', stacked=True, legend
plt.legend(['Men', 'Women'], bbox_to_anchor=(1.0, 0.7))
plt.xlabel('Men / Women ratio')
9. Text(0.5, 0, 'Men / Women ratio')
1
2
3
4
5
sns.countplot(y='Discipline',hue='Gender',data=df)
sns.set(rc={'figure.figsize':(10,10)})
plt.xticks(rotation=90)
plt.title('Medals by Gender in each Discipline')
plt.legend(loc=1) # 1 is code for 'upper right'3
10. check 0s completed at 11:52 PM
<matplotlib.legend.Legend at 0x7fb62e19afd0>
<seaborn.axisgrid.FacetGrid at 0x7fb62dfd3210>
1 sns.catplot(x="Medal", y="Year", hue="Gender",kind="box", data=df)

![1950 1960 1970
0
5M
10M
15M
20M
25M
30M
35M
pop
1
2
3
4
import plotly.express as px
data_canada = px.data.gapminder().query("country == 'Canada'")
fig = px.bar(data_canada, x='year', y='pop')
fig.show()
1
2
3
4
5
6
7
8
9
10
11
12
13
14
15
16
17
18
19
import pandas as pd
plotdata = pd.DataFrame({
"2018":[57,67,77,83],
"2019":[68,73,80,79],
"2020":[73,78,80,85]},
index=["Django", "Gafur", "Tommy", "Ronnie"])
plotdata.plot(kind="bar",figsize=(15, 8))
plt.title("FIFA ratings")
plt.xlabel("Footballer")
plt.ylabel("Ratings")](data:image/gif;base64,R0lGODlhAQABAIAAAAAAAP///yH5BAEAAAAALAAAAAABAAEAAAIBRAA7)