
Recommended
Recommended
More Related Content
What's hot
What's hot (20)
Similar to Congestive heart failure (chf) mortality rate 2009
Similar to Congestive heart failure (chf) mortality rate 2009 (20)
Recently uploaded
Recently uploaded (20)
Congestive heart failure (chf) mortality rate 2009
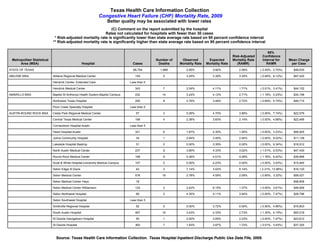
- 1. Source: Texas Health Care Information Collection. Texas Hospital Inpatient Discharge Public Use Data File, 2009.Source: Texas Health Care Information Collection. Texas Hospital Inpatient Discharge Public Use Data File, 2009. Texas Health Care Information Collection Congestive Heart Failure (CHF) Mortality Rate, 2009 Better quality may be associated with lower rates (C) Comment on the report submitted by the hospital Rates not calculated for hospitals with fewer than 30 cases * Risk-adjusted mortality rate is significantly lower than state average rate based on 95 percent confidence interval ** Risk-adjusted mortality rate is significantly higher than state average rate based on 95 percent confidence interval Metropolitan Statistical Area (MSA) Hospital Cases Number of Deaths Observed Mortality Rate Expected Mortality Rate Risk-Adjusted Mortality Rate (RAMR) 95% Confidence Interval for RAMR Mean Charge per Case STATE OF TEXAS 66,754 1,969 2.95% 3.94% 2.58% ( 2.45%, 2.70%) $48,535 ABILENE MSA Abilene Regional Medical Center 154 5 3.25% 3.39% 3.30% ( 0.48%, 6.12%) $97,420 Hendrick Center- Extended Care Less than 5 Hendrick Medical Center 343 7 2.04% 4.11% 1.71% ( 0.01%, 3.41%) $44,152 AMARILLO MSA Baptist St Anthonys Health System-Baptist Campus 432 14 3.24% 4.12% 2.71% ( 1.18%, 4.23%) $34,198 Northwest Texas Hospital 290 8 2.76% 3.49% 2.72% ( 0.69%, 4.75%) $49,710 Plum Creek Specialty Hospital Less than 5 AUSTIN-ROUND ROCK MSA Cedar Park Regional Medical Center 57 3 5.26% 4.70% 3.86% ( 0.00%, 7.74%) $22,579 Central Texas Medical Center 168 4 2.38% 3.83% 2.14% ( 0.00%, 4.68%) $22,466 Cornerstone Hospital-Austin Less than 5 Heart Hospital-Austin 321 6 1.87% 4.30% 1.50% ( 0.00%, 3.23%) $56,925 Johns Community Hospital 34 1 2.94% 3.45% 2.94% ( 0.00%, 9.02%) $11,139 Lakeside Hospital Bastrop 31 0 0.00% 3.39% 0.00% ( 0.00%, 6.34%) $16,912 North Austin Medical Center 237 9 3.80% 4.33% 3.02% ( 1.01%, 5.03%) $47,430 Round Rock Medical Center 168 9 5.36% 4.51% 4.09% ( 1.76%, 6.42%) $38,666 Scott & White Hospital-University Medical Campus 107 0 0.00% 4.23% 0.00% ( 0.00%, 3.03%) $15,945 Seton Edgar B Davis 42 3 7.14% 3.02% 8.14% ( 2.31%, 13.98%) $16,120 Seton Medical Center 576 16 2.78% 4.59% 2.09% ( 0.85%, 3.32%) $58,027 Seton Medical Center Hays 18 $48,608 Seton Medical Center Williamson 124 3 2.42% 6.10% 1.37% ( 0.00%, 3.61%) $48,006 Seton Northwest Hospital 69 3 4.35% 4.11% 3.64% ( 0.00%, 7.47%) $28,796 Seton Southwest Hospital Less than 5 Smithville Regional Hospital 52 0 0.00% 3.72% 0.00% ( 0.00%, 4.66%) $16,603 South Austin Hospital 467 16 3.43% 4.33% 2.73% ( 1.30%, 4.15%) $55,018 St Davids Georgetown Hospital 50 1 2.00% 3.09% 2.23% ( 0.00%, 7.47%) $23,612 St Davids Hospital 362 7 1.93% 3.87% 1.72% ( 0.01%, 3.43%) $37,325
- 2. Source: Texas Health Care Information Collection. Texas Hospital Inpatient Discharge Public Use Data File, 2009. Texas Health Care Information Collection Congestive Heart Failure (CHF) Mortality Rate, 2009 Better quality may be associated with lower rates (C) Comment on the report submitted by the hospital Rates not calculated for hospitals with fewer than 30 cases * Risk-adjusted mortality rate is significantly lower than state average rate based on 95 percent confidence interval ** Risk-adjusted mortality rate is significantly higher than state average rate based on 95 percent confidence interval Metropolitan Statistical Area (MSA) Hospital Cases Number of Deaths Observed Mortality Rate Expected Mortality Rate Risk-Adjusted Mortality Rate (RAMR) 95% Confidence Interval for RAMR Mean Charge per Case Texas NeuroRehab Center-Rehab 5 $68,399 University Medical Center-Brackenridge 231 4 1.73% 2.63% 2.27% ( 0.00%, 4.93%) $26,568 Warm Springs Specialty Hospital-Luling 10 $48,825 Westlake Medical Center 16 $19,424 BEAUMONT-PORT ARTHUR MSA Baptist Hospitals of Southeast Texas 534 11 2.06% 3.11% 2.28% ( 0.69%, 3.88%) $33,670 CHRISTUS Hospital 472 13 2.75% 3.81% 2.49% ( 0.96%, 4.01%) $40,312 CHRISTUS Hospital-St Mary 232 11 4.74% 3.57% 4.58% ( 2.32%, 6.84%) $37,668 Dubuis Hospital-Beaumont Less than 5 Harbor Hospital-Southeast Texas Less than 5 Kate Dishman Rehab Hospital 6 $30,066 Medical Center-Southeast Texas 216 11 5.09% 3.53% 4.97%** ( 2.64%, 7.31%) $32,818 Memorial Hermann Baptist Orange Hospital 79 4 5.06% 2.94% 5.94% ( 1.65%, 10.22%) $28,840 Promise Specialty Hospital-Southeast Texas 6 $62,310 Renaissance Hospital 11 $36,136 Renaissance Hospital-Groves 27 $38,079 BROWNSVILLE-HARLINGEN MSA Brownsville Doctors Hospital 8 $41,314 Harlingen Medical Center 189 3 1.59% 4.31% 1.27% ( 0.00%, 3.53%) $26,293 Solara Hospital Harlingen 7 $67,411 Solara Hospital-Brownsville Campus 16 $165,931 Valley Baptist Medical Center 605 15 2.48% 4.42% 1.93% ( 0.69%, 3.18%) $32,130 Valley Baptist Medical Center-Brownsville 314 11 3.50% 3.87% 3.12% ( 1.26%, 4.97%) $79,968 Valley Regional Medical Center 179 6 3.35% 4.21% 2.75% ( 0.39%, 5.10%) $59,175 COLLEGE STATION-BRYAN MSA Burleson St Joseph Health Center-Caldwell (C) 14 $13,686 College Station Medical Center 142 7 4.93% 3.53% 4.82% ( 1.91%, 7.72%) $51,959
- 3. Source: Texas Health Care Information Collection. Texas Hospital Inpatient Discharge Public Use Data File, 2009. Texas Health Care Information Collection Congestive Heart Failure (CHF) Mortality Rate, 2009 Better quality may be associated with lower rates (C) Comment on the report submitted by the hospital Rates not calculated for hospitals with fewer than 30 cases * Risk-adjusted mortality rate is significantly lower than state average rate based on 95 percent confidence interval ** Risk-adjusted mortality rate is significantly higher than state average rate based on 95 percent confidence interval Metropolitan Statistical Area (MSA) Hospital Cases Number of Deaths Observed Mortality Rate Expected Mortality Rate Risk-Adjusted Mortality Rate (RAMR) 95% Confidence Interval for RAMR Mean Charge per Case Physicians Centre Less than 5 St Joseph Regional Health Center (C) 596 19 3.19% 3.28% 3.35% ( 1.88%, 4.82%) $44,659 CORPUS CHRISTI MSA CHRISTUS Spohn Hospital Corpus Christi 221 6 2.71% 2.68% 3.50% ( 0.81%, 6.18%) $42,206 CHRISTUS Spohn Hospital Corpus Christi-Shoreline 907 17 1.87% 3.41% 1.89% ( 0.73%, 3.06%) $37,993 CHRISTUS Spohn Hospital Corpus Christi-South 112 1 0.89% 4.04% 0.76% ( 0.00%, 3.79%) $33,640 Corpus Christi Medical Center-Bay Area 46 1 2.17% 4.39% 1.71% ( 0.00%, 6.27%) $32,893 Corpus Christi Medical Center-Doctors Regional 262 5 1.91% 3.31% 1.99% ( 0.00%, 4.20%) $58,631 Corpus Christi Medical Center-Heart Hospital 157 9 5.73% 4.78% 4.13% ( 1.80%, 6.46%) $43,508 Corpus Christi Specialty Hospital Less than 5 Kindred Hospital-Corpus Christi 14 $71,755 North Bay Hospital 80 1 1.25% 2.89% 1.49% ( 0.00%, 5.79%) $13,378 DALLAS-FORT WORTH-ARLINGTON MSA Arlington Memorial Hospital 533 6 1.13% 4.41% 0.88%* ( 0.00%, 2.21%) $36,278 Atrium Medical Center-Corinth 8 $55,802 Baylor All Saints Medical Center-Fort Worth 366 3 0.82% 4.29% 0.66%* ( 0.00%, 2.29%) $30,285 Baylor Heart & Vascular Center 198 1 0.51% 1.73% 1.01% ( 0.00%, 4.56%) $44,046 Baylor Medical Center at Carrollton (C) 114 4 3.51% 3.50% 3.45% ( 0.22%, 6.69%) $47,985 Baylor Medical Center-Frisco Less than 5 Baylor Medical Center-Garland 428 12 2.80% 3.70% 2.61% ( 0.99%, 4.24%) $24,642 Baylor Medical Center-Irving 289 4 1.38% 3.35% 1.42% ( 0.00%, 3.50%) $28,080 Baylor Medical Center-Southwest Fort Worth 57 2 3.51% 4.44% 2.73% ( 0.00%, 6.77%) $21,989 Baylor Medical Center-Waxahachie 124 4 3.23% 4.21% 2.64% ( 0.00%, 5.46%) $16,008 Baylor Regional Medical Center-Grapevine 259 5 1.93% 4.80% 1.39% ( 0.00%, 3.20%) $28,619 Baylor Regional Medical Center-Plano 125 5 4.00% 5.05% 2.73% ( 0.18%, 5.27%) $26,659 Baylor Specialty Hospital 11 $55,012 Baylor University Medical Center 919 48 5.22% 4.57% 3.94%** ( 2.95%, 4.92%) $35,441
- 4. Source: Texas Health Care Information Collection. Texas Hospital Inpatient Discharge Public Use Data File, 2009. Texas Health Care Information Collection Congestive Heart Failure (CHF) Mortality Rate, 2009 Better quality may be associated with lower rates (C) Comment on the report submitted by the hospital Rates not calculated for hospitals with fewer than 30 cases * Risk-adjusted mortality rate is significantly lower than state average rate based on 95 percent confidence interval ** Risk-adjusted mortality rate is significantly higher than state average rate based on 95 percent confidence interval Metropolitan Statistical Area (MSA) Hospital Cases Number of Deaths Observed Mortality Rate Expected Mortality Rate Risk-Adjusted Mortality Rate (RAMR) 95% Confidence Interval for RAMR Mean Charge per Case Centennial Medical Center 119 2 1.68% 3.67% 1.58% ( 0.00%, 4.64%) $49,532 Childrens Medical Center-Dallas Less than 5 Dallas LTAC Less than 5 Dallas Regional Medical Center 414 9 2.17% 2.92% 2.57% ( 0.69%, 4.44%) $73,755 Denton Regional Medical Center 266 9 3.38% 3.75% 3.11% ( 1.05%, 5.17%) $40,119 Doctors Hospital 56 2 3.57% 1.77% 6.94% ( 0.25%, 13.63%) $15,465 Doctors Hospital-White Rock Lake 368 16 4.35% 3.50% 4.28% ( 2.48%, 6.08%) $50,489 Ennis Regional Medical Center 114 2 1.75% 3.72% 1.62% ( 0.00%, 4.76%) $20,371 Ethicus Hospital DFW 7 $180,845 Harris Methodist HEB 371 6 1.62% 4.33% 1.29% ( 0.00%, 2.89%) $35,484 Harris Methodist Northwest 110 2 1.82% 4.25% 1.47% ( 0.00%, 4.42%) $16,806 Harris Methodist-Southwest 307 8 2.61% 4.16% 2.16% ( 0.35%, 3.97%) $28,079 Heart Hospital Baylor Plano 207 2 0.97% 3.28% 1.02% ( 0.00%, 3.49%) $43,157 Huguley Memorial Medical Center 412 9 2.18% 3.79% 1.99% ( 0.35%, 3.62%) $37,156 Hunt Regional Medical Center Greenville 260 10 3.85% 3.96% 3.35% ( 1.34%, 5.37%) $14,380 Hunt Regional Medical Center-Commerce 11 $10,429 Integra Hospital Plano Less than 5 John Peter Smith Hospital 409 5 1.22% 2.21% 1.90% ( 0.00%, 4.09%) $35,262 Kindred Hospital-Dallas 9 $157,244 Kindred Hospital-Fort Worth 14 $92,708 Kindred Hospital-Mansfield 13 $66,275 Kindred Hospital-Tarrant County-Arlington 18 $87,445 Kindred Hospital-Tarrant County-Fort Worth 17 $102,810 Kindred Hospital-White Rock 7 $118,879 Lake Pointe Medical Center 152 5 3.29% 3.43% 3.31% ( 0.47%, 6.14%) $27,060 Las Colinas Medical Center 74 0 0.00% 4.05% 0.00% ( 0.00%, 3.71%) $37,889
- 5. Source: Texas Health Care Information Collection. Texas Hospital Inpatient Discharge Public Use Data File, 2009. Texas Health Care Information Collection Congestive Heart Failure (CHF) Mortality Rate, 2009 Better quality may be associated with lower rates (C) Comment on the report submitted by the hospital Rates not calculated for hospitals with fewer than 30 cases * Risk-adjusted mortality rate is significantly lower than state average rate based on 95 percent confidence interval ** Risk-adjusted mortality rate is significantly higher than state average rate based on 95 percent confidence interval Metropolitan Statistical Area (MSA) Hospital Cases Number of Deaths Observed Mortality Rate Expected Mortality Rate Risk-Adjusted Mortality Rate (RAMR) 95% Confidence Interval for RAMR Mean Charge per Case LifeCare Hospital-Dallas 10 $117,213 LifeCare Hospital-Fort Worth 11 $71,099 LifeCare Hospital-Plano Less than 5 Medical Center-Arlington 328 12 3.66% 3.97% 3.17% ( 1.39%, 4.96%) $51,915 Medical Center-Lewisville 222 8 3.60% 3.48% 3.57% ( 1.24%, 5.91%) $34,722 Medical Center-McKinney 332 9 2.71% 4.73% 1.98% ( 0.35%, 3.60%) $38,076 Medical Center-Plano 272 10 3.68% 4.45% 2.85% ( 1.00%, 4.70%) $44,859 Medical City Dallas Hospital 493 12 2.43% 3.47% 2.42% ( 0.86%, 3.98%) $97,282 Mesquite Specialty Hospital Less than 5 Methodist Charlton Medical Center 521 7 1.34% 3.74% 1.24% ( 0.00%, 2.70%) $25,244 Methodist Dallas Medical Center 439 16 3.64% 4.57% 2.75% ( 1.32%, 4.18%) $34,043 Methodist Mansfield Medical Center 162 4 2.47% 4.31% 1.97% ( 0.00%, 4.41%) $29,141 Methodist Richardson Medical Center 117 2 1.71% 4.41% 1.34% ( 0.00%, 4.18%) $26,719 North Hills Hospital 296 8 2.70% 4.80% 1.94% ( 0.24%, 3.64%) $39,748 Parkland Memorial Hospital 709 12 1.69% 2.38% 2.45% ( 0.85%, 4.04%) $32,309 Plaza Medical Center-Fort Worth 326 7 2.15% 3.70% 2.00% ( 0.14%, 3.87%) $43,937 Presbyterian Hospital-Denton 191 8 4.19% 3.33% 4.33% ( 1.75%, 6.91%) $23,670 Presbyterian Hospital-Kaufman 175 13 7.43% 3.78% 6.77%** ( 4.25%, 9.29%) $16,624 Presbyterian Hospital-Plano 225 5 2.22% 4.43% 1.73% ( 0.00%, 3.77%) $38,066 Presbyterian Hospital-Rockwall 91 4 4.40% 2.85% 5.32% ( 1.24%, 9.39%) $18,362 Regency Hospital - Fort Worth Less than 5 Regency Hospital North Dallas Less than 5 Rehab Hospital-Denton Less than 5 Renaissance Hospital Dallas 21 $35,184 Renaissance Hospital Terrell 153 5 3.27% 3.31% 3.40% ( 0.51%, 6.29%) $20,688 Select Specialty Hospital-Dallas Less than 5
- 6. Source: Texas Health Care Information Collection. Texas Hospital Inpatient Discharge Public Use Data File, 2009. Texas Health Care Information Collection Congestive Heart Failure (CHF) Mortality Rate, 2009 Better quality may be associated with lower rates (C) Comment on the report submitted by the hospital Rates not calculated for hospitals with fewer than 30 cases * Risk-adjusted mortality rate is significantly lower than state average rate based on 95 percent confidence interval ** Risk-adjusted mortality rate is significantly higher than state average rate based on 95 percent confidence interval Metropolitan Statistical Area (MSA) Hospital Cases Number of Deaths Observed Mortality Rate Expected Mortality Rate Risk-Adjusted Mortality Rate (RAMR) 95% Confidence Interval for RAMR Mean Charge per Case Select Specialty Hospital-South Dallas 26 $46,260 South Hampton Community Hospital 80 1 1.25% 2.44% 1.77% ( 0.00%, 6.48%) $37,059 Texas Health Harris Methodist Hospital-Fort Worth 995 27 2.71% 3.99% 2.34% ( 1.32%, 3.36%) $33,990 Texas Health Presbyterian Hospital Allen 56 1 1.79% 3.19% 1.93% ( 0.00%, 6.77%) $24,607 Texas Health Presbyterian Hospital Dallas 574 22 3.83% 4.26% 3.10% ( 1.81%, 4.39%) $44,792 Texas Hospital for Advanced Medicine 125 3 2.40% 3.98% 2.08% ( 0.00%, 4.98%) $45,064 Texas Regional Medical Center 5 $21,074 Texas Specialty Hospital-Dallas Less than 5 USMD Hospital-Arlington Less than 5 UT Southwestern University Hospital-St Paul 576 21 3.65% 3.42% 3.67% ( 2.21%, 5.13%) $56,342 UT Southwestern University Hospital-Zale Lipshy 5 $62,828 Vibra Specialty Hospital 10 $108,431 Walls Regional Hospital 189 2 1.06% 3.65% 1.00% ( 0.00%, 3.45%) $20,934 Weatherford Regional Medical Center 163 3 1.84% 4.19% 1.51% ( 0.00%, 3.98%) $20,710 Wise Regional Health System 75 4 5.33% 2.09% 8.78%** ( 3.49%, 14.07%) $14,335 EL PASO MSA Del Sol Medical Center 377 11 2.92% 4.01% 2.51% ( 0.85%, 4.16%) $71,846 East El Paso Physicians Medical Center 55 1 1.82% 3.72% 1.69% ( 0.00%, 6.22%) $43,936 Highlands Regional Rehab Hospital Less than 5 Las Palmas Medical Center 214 9 4.21% 4.80% 3.02% ( 1.02%, 5.02%) $61,570 Mesa Hills Specialty Hospital Less than 5 Providence Memorial Hospital 260 4 1.54% 4.12% 1.29% ( 0.00%, 3.26%) $65,540 R E Thomason General Hospital 168 4 2.38% 2.60% 3.16% ( 0.01%, 6.31%) $15,371 Sierra Medical Center 311 8 2.57% 3.82% 2.32% ( 0.44%, 4.19%) $79,663 Sierra Providence East Medical Center 118 4 3.39% 2.78% 4.19% ( 0.58%, 7.81%) $94,723 Triumph Hospital El Paso Less than 5
- 7. Source: Texas Health Care Information Collection. Texas Hospital Inpatient Discharge Public Use Data File, 2009. Texas Health Care Information Collection Congestive Heart Failure (CHF) Mortality Rate, 2009 Better quality may be associated with lower rates (C) Comment on the report submitted by the hospital Rates not calculated for hospitals with fewer than 30 cases * Risk-adjusted mortality rate is significantly lower than state average rate based on 95 percent confidence interval ** Risk-adjusted mortality rate is significantly higher than state average rate based on 95 percent confidence interval Metropolitan Statistical Area (MSA) Hospital Cases Number of Deaths Observed Mortality Rate Expected Mortality Rate Risk-Adjusted Mortality Rate (RAMR) 95% Confidence Interval for RAMR Mean Charge per Case HOUSTON-SUGAR LAND-BAYTOWN MSA Acuity Hospital-Houston Less than 5 Angleton Danbury Medical Center 101 3 2.97% 3.00% 3.41% ( 0.00%, 7.15%) $14,142 Apex Hospital Katy 11 $66,074 Atrium Medical Center Less than 5 Bayshore Medical Center 315 5 1.59% 3.40% 1.61% ( 0.00%, 3.60%) $51,211 Ben Taub General Hospital 454 5 1.10% 2.11% 1.79% ( 0.00%, 3.91%) $25,958 Brazosport Regional Health System 203 1 0.49% 2.75% 0.62% ( 0.00%, 3.36%) $16,246 CHRISTUS St Catherine Hospital 261 6 2.30% 3.93% 2.01% ( 0.00%, 4.03%) $34,860 CHRISTUS St John Hospital 144 0 0.00% 4.76% 0.00%* ( 0.00%, 2.45%) $26,661 Clear Lake Regional Medical Center 524 16 3.05% 3.84% 2.74% ( 1.30%, 4.18%) $67,770 Cleveland Regional Medical Center 136 3 2.21% 3.05% 2.50% ( 0.00%, 5.71%) $64,114 Conroe Regional Medical Center 610 16 2.62% 3.54% 2.55% ( 1.16%, 3.95%) $74,383 Cornerstone Hospital Houston-Bellaire 6 $70,570 Cornerstone Hospital Houston-Clear Lake 10 $107,632 Cypress Fairbanks Medical Center 179 3 1.68% 3.93% 1.47% ( 0.00%, 3.91%) $56,105 Doctors Diagnostic Hospital 9 $10,353 Doctors Hospital-Tidwell 138 4 2.90% 2.33% 4.29% ( 0.63%, 7.95%) $33,993 East Houston Regional Medical Center 227 3 1.32% 2.52% 1.80% ( 0.00%, 4.53%) $41,549 HEALTHSOUTH Hospital-Houston 9 $45,914 Houston Northwest Medical Center 662 13 1.96% 3.35% 2.02% ( 0.65%, 3.39%) $64,238 Icon Hospital 12 $172,687 Kindred Hospital-Houston 10 $111,851 41 7 17.07% 12.28% 4.79% ( 2.03%, 7.56%) $71,356 Kindred Hospital-Pasadena 15 $80,201 Kingwood Medical Center 352 11 3.13% 3.94% 2.73% ( 1.00%, 4.46%) $62,863
- 8. Source: Texas Health Care Information Collection. Texas Hospital Inpatient Discharge Public Use Data File, 2009. Texas Health Care Information Collection Congestive Heart Failure (CHF) Mortality Rate, 2009 Better quality may be associated with lower rates (C) Comment on the report submitted by the hospital Rates not calculated for hospitals with fewer than 30 cases * Risk-adjusted mortality rate is significantly lower than state average rate based on 95 percent confidence interval ** Risk-adjusted mortality rate is significantly higher than state average rate based on 95 percent confidence interval Metropolitan Statistical Area (MSA) Hospital Cases Number of Deaths Observed Mortality Rate Expected Mortality Rate Risk-Adjusted Mortality Rate (RAMR) 95% Confidence Interval for RAMR Mean Charge per Case Liberty-Dayton Community Hospital 13 $8,858 Lyndon B Johnson General Hospital 268 4 1.49% 1.94% 2.65% ( 0.00%, 5.54%) $21,005 Mainland Medical Center 425 12 2.82% 3.93% 2.48% ( 0.90%, 4.05%) $44,523 Memorial Hermann Hospital (C) 510 14 2.75% 3.54% 2.67% ( 1.16%, 4.18%) $50,070 Memorial Hermann Katy Hospital (C) 231 2 0.87% 4.02% 0.74% ( 0.00%, 2.86%) $18,674 Memorial Hermann Memorial City Medical Center (C) 566 20 3.53% 4.19% 2.91% ( 1.59%, 4.23%) $26,539 Memorial Hermann Northeast (C) 437 10 2.29% 3.88% 2.03% ( 0.47%, 3.60%) $29,475 Memorial Hermann Northwest Hospital (C) 441 7 1.59% 3.99% 1.37% ( 0.00%, 2.91%) $24,796 Memorial Hermann Southeast Hospital (C) 477 7 1.47% 4.28% 1.18% ( 0.00%, 2.60%) $21,837 Memorial Hermann Southwest Hospital (C) 726 12 1.65% 3.66% 1.56% ( 0.31%, 2.81%) $32,127 Memorial Hermann Sugar Land (C) 103 1 0.97% 3.54% 0.94% ( 0.00%, 4.31%) $18,745 Memorial Hermann The Woodlands Hospital (C) 247 8 3.24% 5.36% 2.08% ( 0.34%, 3.82%) $35,886 Methodist Hospital-Houston 1,087 34 3.13% 4.61% 2.34% ( 1.44%, 3.24%) $104,372 Methodist Sugar Land Hospital 253 4 1.58% 4.03% 1.35% ( 0.00%, 3.36%) $48,701 Methodist Willowbrook Hospital 197 4 2.03% 3.10% 2.26% ( 0.00%, 4.89%) $58,298 Nexus Specialty Hospital Shenandoah Campus 5 $83,846 North Cypress Medical Center 255 5 1.96% 4.30% 1.57% ( 0.00%, 3.51%) $62,464 Oakbend Medical Center 162 5 3.09% 3.62% 2.94% ( 0.28%, 5.60%) $2,430,902 Park Plaza Hospital 196 4 2.04% 4.49% 1.57% ( 0.00%, 3.73%) $79,005 Patients Medical Center 93 2 2.15% 3.62% 2.05% ( 0.00%, 5.59%) $22,578 Plaza Specialty Hospital Less than 5 Renaissance Hospital Houston 14 $47,220 San Jacinto Methodist Hospital 371 10 2.70% 4.71% 1.97% ( 0.44%, 3.51%) $40,847 Select Specialty Hospital-Houston Heights 34 1 2.94% 13.74% 0.74% ( 0.00%, 3.49%) $56,965 Select Specialty Hospital-Houston Medical Center 9 $56,072 Select Specialty Hospital-Houston West 15 $74,569
- 9. Source: Texas Health Care Information Collection. Texas Hospital Inpatient Discharge Public Use Data File, 2009. Texas Health Care Information Collection Congestive Heart Failure (CHF) Mortality Rate, 2009 Better quality may be associated with lower rates (C) Comment on the report submitted by the hospital Rates not calculated for hospitals with fewer than 30 cases * Risk-adjusted mortality rate is significantly lower than state average rate based on 95 percent confidence interval ** Risk-adjusted mortality rate is significantly higher than state average rate based on 95 percent confidence interval Metropolitan Statistical Area (MSA) Hospital Cases Number of Deaths Observed Mortality Rate Expected Mortality Rate Risk-Adjusted Mortality Rate (RAMR) 95% Confidence Interval for RAMR Mean Charge per Case Solara Hospital Conroe 8 $95,567 Spring Branch Medical Center 229 4 1.75% 4.15% 1.45% ( 0.00%, 3.53%) $44,274 St Joseph Medical Center 429 20 4.66% 2.99% 5.38%** ( 3.56%, 7.20%) $46,151 St Lukes Community Medical Center-The Woodlands 214 3 1.40% 3.56% 1.36% ( 0.00%, 3.71%) $59,618 St Lukes Episcopal Hospital 1,311 47 3.59% 3.72% 3.32% ( 2.40%, 4.24%) $110,703 St Lukes Lakeside Hospital Less than 5 St Lukes Sugar Land Hospital 83 0 0.00% 3.06% 0.00% ( 0.00%, 4.04%) $41,355 Sugar Land Rehab Hospital Less than 5 Sweeny Community Hospital 21 $7,223 Texas Childrens Hospital 5 $42,120 Texas Specialty Hospital-Houston 12 $21,518 Tomball Regional Hospital 398 13 3.27% 5.31% 2.12% ( 0.73%, 3.51%) $42,916 Triumph Hospital Baytown 6 $141,243 Triumph Hospital Tomball 7 $108,148 Triumph Hospital Town & Country 20 $99,426 Triumph Hospital-Clearlake 22 $114,225 Triumph Hospital-East Houston 13 $99,664 Triumph Hospital-North Houston 24 $107,817 Triumph Hospital-Northwest 18 $105,261 Triumph Hospital-Southwest 30 7 23.33% 16.36% 4.91% ( 2.24%, 7.59%) $115,647 UT MD Anderson Cancer Center 73 5 6.85% 6.85% 3.44% ( 0.66%, 6.23%) $54,896 UT Medical Branch Hospital 243 10 4.12% 2.40% 5.92%** ( 3.21%, 8.63%) $41,655 University General Hospital 10 $24,251 West Houston Medical Center 295 9 3.05% 4.04% 2.60% ( 0.74%, 4.46%) $48,339 Winnie Community Hospital 47 2 4.26% 2.09% 7.03% ( 0.32%, 13.74%) $5,386
- 10. Source: Texas Health Care Information Collection. Texas Hospital Inpatient Discharge Public Use Data File, 2009. Texas Health Care Information Collection Congestive Heart Failure (CHF) Mortality Rate, 2009 Better quality may be associated with lower rates (C) Comment on the report submitted by the hospital Rates not calculated for hospitals with fewer than 30 cases * Risk-adjusted mortality rate is significantly lower than state average rate based on 95 percent confidence interval ** Risk-adjusted mortality rate is significantly higher than state average rate based on 95 percent confidence interval Metropolitan Statistical Area (MSA) Hospital Cases Number of Deaths Observed Mortality Rate Expected Mortality Rate Risk-Adjusted Mortality Rate (RAMR) 95% Confidence Interval for RAMR Mean Charge per Case KILLEEN-TEMPLE-FORT HOOD MSA Coryell Memorial Hospital 29 $16,381 Kings Daughters Hospital 39 1 2.56% 3.66% 2.41% ( 0.00%, 7.90%) $22,685 Metroplex Hospital 200 1 0.50% 2.59% 0.66% ( 0.00%, 3.55%) $25,880 Rollins Brooks Community Hospital 34 3 8.82% 2.41% 12.63%** ( 5.31%, 19.95%) $16,052 Scott & White Memorial Hospital 737 18 2.44% 5.52% 1.52%* ( 0.53%, 2.52%) $20,930 Scott & White Memorial Hospital-SNF Less than 5 LAREDO MSA Doctors Hospital-Laredo 232 11 4.74% 3.87% 4.22% ( 2.07%, 6.37%) $29,367 Laredo Medical Center 577 28 4.85% 3.67% 4.56%** ( 3.16%, 5.96%) $45,515 Laredo Specialty Hospital 10 $72,387 LONGVIEW MSA Allegiance Specialty Hospital-Kilgore Less than 5 East Texas Medical Center-Gilmer 79 1 1.27% 3.99% 1.09% ( 0.00%, 4.72%) $24,740 Good Shepherd Medical Center 689 12 1.74% 3.59% 1.67% ( 0.37%, 2.96%) $42,299 Henderson Memorial Hospital 109 3 2.75% 3.28% 2.89% ( 0.00%, 6.34%) $14,536 Longview Regional Medical Center 140 2 1.43% 3.50% 1.40% ( 0.00%, 4.32%) $50,166 Select Specialty Hospital-Longview 6 $49,277 LUBBOCK MSA Covenant Medical Center 562 19 3.38% 5.29% 2.20% ( 1.03%, 3.37%) $69,502 Covenant Medical Center-Lakeside 8 $80,115 Covenant Specialty Hospital Less than 5 Grace Medical Center 33 0 0.00% 3.93% 0.00% ( 0.00%, 5.71%) $23,606 Lubbock Heart Hospital 388 9 2.32% 3.65% 2.19% ( 0.47%, 3.91%) $23,506 Texas Specialty Hospital-Lubbock Less than 5 TrustPoint Hospital 9 $11,028 University Medical Center 531 15 2.82% 3.74% 2.60% ( 1.16%, 4.05%) $39,543 MCALLEN-EDINBURG-MISSIO N MSA Doctors Hospital-Renaissance 374 15 4.01% 4.90% 2.82% ( 1.32%, 4.32%) $48,541 Edinburg Regional Medical Center 291 6 2.06% 4.28% 1.66% ( 0.00%, 3.49%) $49,521
- 11. Source: Texas Health Care Information Collection. Texas Hospital Inpatient Discharge Public Use Data File, 2009. Texas Health Care Information Collection Congestive Heart Failure (CHF) Mortality Rate, 2009 Better quality may be associated with lower rates (C) Comment on the report submitted by the hospital Rates not calculated for hospitals with fewer than 30 cases * Risk-adjusted mortality rate is significantly lower than state average rate based on 95 percent confidence interval ** Risk-adjusted mortality rate is significantly higher than state average rate based on 95 percent confidence interval Metropolitan Statistical Area (MSA) Hospital Cases Number of Deaths Observed Mortality Rate Expected Mortality Rate Risk-Adjusted Mortality Rate (RAMR) 95% Confidence Interval for RAMR Mean Charge per Case Knapp Medical Center 311 9 2.89% 4.18% 2.38% ( 0.60%, 4.16%) $23,258 LifeCare Hospital-South Texas 11 $82,433 LifeCare Hospitals-South Texas - North 11 $102,185 McAllen Medical Center 822 17 2.07% 3.84% 1.86% ( 0.71%, 3.01%) $64,206 Mission Regional Medical Center 317 11 3.47% 4.69% 2.55% ( 0.89%, 4.22%) $31,448 Rio Grande Regional Hospital 535 22 4.11% 5.54% 2.56% ( 1.39%, 3.73%) $60,260 Solara Hospital-Edinburg 6 $125,015 Solara Hospital-McAllen 23 $119,151 MIDLAND MSA Midland Memorial Hospital 310 7 2.26% 4.43% 1.76% ( 0.02%, 3.49%) $20,893 Select Specialty Hospital-Midland Less than 5 ODESSA MSA Medical Center Hospital 507 17 3.35% 3.20% 3.61% ( 2.00%, 5.22%) $25,955 Odessa Regional Medical Center-6th Street 98 2 2.04% 2.82% 2.49% ( 0.00%, 6.41%) $32,009 Regency Hospital-Odessa 6 $112,406 SAN ANGELO MSA San Angelo Community Medical Center 185 5 2.70% 3.83% 2.43% ( 0.01%, 4.85%) $44,291 Shannon West Texas Memorial Hospital 274 7 2.55% 3.61% 2.44% ( 0.39%, 4.48%) $21,754 SAN ANTONIO MSA Acuity Hospital South Texas 7 $77,854 Baptist Medical Center 819 16 1.95% 3.53% 1.90% ( 0.70%, 3.11%) $35,599 CHRISTUS Santa Rosa Childrens Hospital Less than 5 CHRISTUS Santa Rosa Hospital 286 6 2.10% 3.54% 2.04% ( 0.02%, 4.07%) $33,841 CHRISTUS Santa Rosa Hospital New Braunfels 153 5 3.27% 3.37% 3.34% ( 0.50%, 6.19%) $21,505 CHRISTUS Santa Rosa Hospital-Westover Hills 18 $32,882 CHRISTUS Santa Rosa Medical Center 180 1 0.56% 3.85% 0.50% ( 0.00%, 2.95%) $47,994 COMPASS Hospital San Antonio Less than 5 Connally Memorial Medical Center 64 2 3.13% 4.07% 2.65% ( 0.00%, 6.65%) $12,539 Guadalupe Regional Medical Center 147 3 2.04% 2.66% 2.64% ( 0.00%, 5.96%) $18,649 Kindred Hospital-San Antonio 7 $99,222
- 12. Source: Texas Health Care Information Collection. Texas Hospital Inpatient Discharge Public Use Data File, 2009. Texas Health Care Information Collection Congestive Heart Failure (CHF) Mortality Rate, 2009 Better quality may be associated with lower rates (C) Comment on the report submitted by the hospital Rates not calculated for hospitals with fewer than 30 cases * Risk-adjusted mortality rate is significantly lower than state average rate based on 95 percent confidence interval ** Risk-adjusted mortality rate is significantly higher than state average rate based on 95 percent confidence interval Metropolitan Statistical Area (MSA) Hospital Cases Number of Deaths Observed Mortality Rate Expected Mortality Rate Risk-Adjusted Mortality Rate (RAMR) 95% Confidence Interval for RAMR Mean Charge per Case LifeCare Hospital-San Antonio Less than 5 Methodist Hospital-San Antonio 778 22 2.83% 4.75% 2.05% ( 1.00%, 3.10%) $58,937 Methodist Specialty & Transplant Hospital 103 0 0.00% 4.81% 0.00% ( 0.00%, 2.86%) $44,062 Methodist Stone Oak Hospital 96 1 1.04% 3.95% 0.91% ( 0.00%, 4.20%) $40,033 Metropolitan Methodist Hospital 416 16 3.85% 4.79% 2.77% ( 1.33%, 4.20%) $52,817 Nix Health Care System 102 1 0.98% 3.92% 0.86% ( 0.00%, 4.09%) $48,684 North Central Baptist Hospital 236 7 2.97% 4.74% 2.16% ( 0.24%, 4.08%) $36,143 Northeast Baptist Hospital 448 14 3.13% 4.52% 2.38% ( 0.96%, 3.80%) $42,068 Northeast Methodist Hospital 313 5 1.60% 4.35% 1.27% ( 0.00%, 3.01%) $45,442 Select Specialty Hospital-San Antonio 19 $60,028 South Texas Regional Medical Center 106 2 1.89% 3.27% 1.99% ( 0.00%, 5.46%) $27,884 Southeast Baptist Hospital 279 7 2.51% 3.70% 2.34% ( 0.32%, 4.36%) $31,231 Southwest General Hospital 288 4 1.39% 3.81% 1.26% ( 0.00%, 3.21%) $34,935 St Lukes Baptist Hospital 271 10 3.69% 3.90% 3.26% ( 1.26%, 5.25%) $37,188 Texsan Heart Hospital 270 3 1.11% 3.81% 1.01% ( 0.00%, 2.98%) $60,151 University Hospital 349 7 2.01% 1.89% 3.65% ( 1.08%, 6.22%) $31,991 SHERMAN-DENISON MSA Carrus Specialty Hospital Less than 5 Texoma Medical Center 212 9 4.25% 3.28% 4.47% ( 2.00%, 6.94%) $26,304 Wilson N Jones Medical Center 245 14 5.71% 4.94% 3.99% ( 2.15%, 5.83%) $23,268 TEXARKANA MSA CHRISTUS St Michael Health System 688 21 3.05% 4.00% 2.63% ( 1.40%, 3.86%) $26,911 Dubuis Hospital-Texarkana-Wadley Less than 5 Wadley Regional Medical Center 216 10 4.63% 2.79% 5.71%** ( 3.05%, 8.38%) $24,699 TYLER MSA East Texas Medical Center 592 15 2.53% 4.35% 2.01% ( 0.75%, 3.27%) $65,010 East Texas Medical Center Specialty Hospital Less than 5 Mother Frances Hospital 648 20 3.09% 5.16% 2.06% ( 0.96%, 3.16%) $45,665 Tyler Continue Care Hospital-Mother Frances 19 $82,896
- 13. Source: Texas Health Care Information Collection. Texas Hospital Inpatient Discharge Public Use Data File, 2009. Texas Health Care Information Collection Congestive Heart Failure (CHF) Mortality Rate, 2009 Better quality may be associated with lower rates (C) Comment on the report submitted by the hospital Rates not calculated for hospitals with fewer than 30 cases * Risk-adjusted mortality rate is significantly lower than state average rate based on 95 percent confidence interval ** Risk-adjusted mortality rate is significantly higher than state average rate based on 95 percent confidence interval Metropolitan Statistical Area (MSA) Hospital Cases Number of Deaths Observed Mortality Rate Expected Mortality Rate Risk-Adjusted Mortality Rate (RAMR) 95% Confidence Interval for RAMR Mean Charge per Case UT Health Center-Tyler 163 4 2.45% 3.51% 2.41% ( 0.00%, 5.13%) $16,771 VICTORIA MSA Citizens Medical Center 409 13 3.18% 3.50% 3.13% ( 1.42%, 4.84%) $23,633 DeTar Hospital-Navarro 292 7 2.40% 3.12% 2.65% ( 0.49%, 4.81%) $38,253 Triumph Hospital Victoria 10 $92,342 Warm Springs Specialty Hospital-Victoria 20 $60,262 WACO MSA Hillcrest Baptist Medical Center 199 6 3.02% 4.01% 2.59% ( 0.31%, 4.87%) $32,047 Providence Health Center 610 25 4.10% 4.07% 3.47% ( 2.18%, 4.75%) $27,367 WICHITA FALLS MSA Electra Memorial Hospital 11 $13,282 Kell West Regional Hospital 13 $9,071 Texas Specialty Hospital-Wichita Falls 5 $30,842 United Regional Health Care System-8th St Campus 549 14 2.55% 4.64% 1.90% ( 0.63%, 3.16%) $34,877 NON-METROPOLITAN Ballinger Memorial Hospital District 5 $5,549 Big Bend Regional Medical Center 46 2 4.35% 2.61% 5.74% ( 0.00%, 11.72%) $19,873 Brownwood Regional Medical Center 121 5 4.13% 3.84% 3.71% ( 0.70%, 6.72%) $29,838 CHRISTUS Jasper Memorial Hospital 52 3 5.77% 2.35% 8.45% ( 2.48%, 14.42%) $15,963 CHRISTUS Spohn Hospital Alice 179 4 2.23% 3.21% 2.40% ( 0.00%, 5.12%) $32,735 CHRISTUS Spohn Hospital-Beeville 97 2 2.06% 3.55% 2.00% ( 0.00%, 5.50%) $27,949 CHRISTUS Spohn Hospital-Kleberg 235 8 3.40% 2.59% 4.53% ( 1.86%, 7.20%) $28,528 Central Texas Hospital Less than 5 Childress Regional Medical Center 8 $7,148 Collingsworth General Hospital 17 $6,945 Comanche County Medical Center 46 1 2.17% 4.94% 1.52% ( 0.00%, 5.79%) $12,833 Community General Hospital Dilley Texas 22 $5,171 Covenant Hospital-Levelland 40 5 12.50% 4.16% 10.36%** ( 5.33%, 15.38%) $7,795 Covenant Hospital-Plainview 54 2 3.70% 2.92% 4.37% ( 0.00%, 9.58%) $14,978 East Texas Medical Center-Athens 266 4 1.50% 2.86% 1.81% ( 0.00%, 4.18%) $35,969
- 14. Source: Texas Health Care Information Collection. Texas Hospital Inpatient Discharge Public Use Data File, 2009. Texas Health Care Information Collection Congestive Heart Failure (CHF) Mortality Rate, 2009 Better quality may be associated with lower rates (C) Comment on the report submitted by the hospital Rates not calculated for hospitals with fewer than 30 cases * Risk-adjusted mortality rate is significantly lower than state average rate based on 95 percent confidence interval ** Risk-adjusted mortality rate is significantly higher than state average rate based on 95 percent confidence interval Metropolitan Statistical Area (MSA) Hospital Cases Number of Deaths Observed Mortality Rate Expected Mortality Rate Risk-Adjusted Mortality Rate (RAMR) 95% Confidence Interval for RAMR Mean Charge per Case East Texas Medical Center-Carthage 67 4 5.97% 3.90% 5.27% ( 1.28%, 9.27%) $25,669 East Texas Medical Center-Clarksville 84 3 3.57% 1.81% 6.82% ( 1.40%, 12.24%) $29,235 East Texas Medical Center-Crockett 139 2 1.44% 1.96% 2.54% ( 0.00%, 6.57%) $19,861 East Texas Medical Center-Fairfield 78 3 3.85% 3.97% 3.34% ( 0.00%, 7.02%) $25,090 East Texas Medical Center-Jacksonville 103 3 2.91% 3.92% 2.56% ( 0.00%, 5.78%) $46,534 East Texas Medical Center-Mount Vernon 20 $17,101 East Texas Medical Center-Pittsburg 111 0 0.00% 3.09% 0.00% ( 0.00%, 3.50%) $24,796 East Texas Medical Center-Quitman 65 4 6.15% 2.39% 8.89%** ( 3.56%, 14.21%) $21,004 East Texas Medical Center-Trinity 33 0 0.00% 3.10% 0.00% ( 0.00%, 6.40%) $25,097 El Campo Memorial Hospital 58 2 3.45% 3.60% 3.30% ( 0.00%, 7.79%) $8,810 Fort Duncan Regional Medical Center 181 6 3.31% 4.86% 2.35% ( 0.19%, 4.52%) $32,529 Golden Plains Community Hospital 22 $12,658 Good Shepherd Medical Center-Linden 27 $9,964 Good Shepherd Medical Center-Marshall 189 3 1.59% 4.51% 1.21% ( 0.00%, 3.40%) $26,556 Grimes St Joseph Health Center (C) 32 1 3.13% 2.55% 4.23% ( 0.00%, 11.57%) $19,877 Gulf Coast Medical Center 88 1 1.14% 3.09% 1.27% ( 0.00%, 5.24%) $25,261 Harris Methodist-Erath County 104 5 4.81% 3.69% 4.49% ( 1.19%, 7.79%) $17,075 Hill Country Memorial Hospital 76 4 5.26% 4.63% 3.92% ( 0.48%, 7.35%) $11,616 Hill Regional Hospital 86 1 1.16% 2.60% 1.54% ( 0.00%, 5.92%) $19,121 Huntsville Memorial Hospital 99 5 5.05% 4.39% 3.96% ( 0.89%, 7.04%) $25,956 Kimble Hospital 9 $5,402 Lake Granbury Medical Center 106 2 1.89% 3.19% 2.04% ( 0.00%, 5.58%) $32,473 Lake Whitney Medical Center Less than 5 Lillian M Hudspeth Memorial Hospital Less than 5 Madison St Joseph Health Center (C) 26 $16,848 Matagorda General Hospital 76 1 1.32% 4.10% 1.11% ( 0.00%, 4.75%) $18,333
- 15. Source: Texas Health Care Information Collection. Texas Hospital Inpatient Discharge Public Use Data File, 2009. Texas Health Care Information Collection Congestive Heart Failure (CHF) Mortality Rate, 2009 Better quality may be associated with lower rates (C) Comment on the report submitted by the hospital Rates not calculated for hospitals with fewer than 30 cases * Risk-adjusted mortality rate is significantly lower than state average rate based on 95 percent confidence interval ** Risk-adjusted mortality rate is significantly higher than state average rate based on 95 percent confidence interval Metropolitan Statistical Area (MSA) Hospital Cases Number of Deaths Observed Mortality Rate Expected Mortality Rate Risk-Adjusted Mortality Rate (RAMR) 95% Confidence Interval for RAMR Mean Charge per Case Memorial Hospital 48 2 4.17% 2.49% 5.78% ( 0.00%, 11.82%) $16,014 Memorial Medical Center East Texas 305 16 5.25% 4.13% 4.38% ( 2.56%, 6.19%) $51,038 Memorial Medical Center-Livingston 175 4 2.29% 3.29% 2.39% ( 0.00%, 5.11%) $48,843 Memorial Medical Center-San Augustine 15 $18,983 Mitchell County Hospital 32 1 3.13% 2.43% 4.43% ( 0.00%, 11.93%) $8,863 Mother Frances Hospital-Jacksonville 41 0 0.00% 2.41% 0.00% ( 0.00%, 6.55%) $21,752 Nacogdoches Medical Center 115 6 5.22% 2.61% 6.88%** ( 3.11%, 10.65%) $51,796 Nacogdoches Memorial Hospital 299 8 2.68% 2.34% 3.94% ( 1.47%, 6.41%) $31,239 Navarro Regional Hospital 174 5 2.87% 3.36% 2.94% ( 0.26%, 5.63%) $24,741 North Texas Medical Center 89 2 2.25% 4.45% 1.74% ( 0.00%, 4.94%) $14,514 Palestine Regional Medical Center 108 7 6.48% 3.27% 6.83%** ( 3.38%, 10.28%) $17,834 Palo Pinto General Hospital 66 0 0.00% 2.83% 0.00% ( 0.00%, 4.77%) $12,327 Pampa Regional Medical Center 78 1 1.28% 2.86% 1.54% ( 0.00%, 5.94%) $20,896 Paris Regional Medical Center South Campus 194 13 6.70% 3.59% 6.44%** ( 4.00%, 8.88%) $34,255 Parkview Regional Hospital 135 3 2.22% 2.42% 3.16% ( 0.00%, 6.80%) $20,900 Peterson Regional Medical Center 123 5 4.07% 2.46% 5.69% ( 1.90%, 9.49%) $14,233 Presbyterian Hospital-Winnsboro 21 $12,035 Red River Regional Hospital 84 4 4.76% 5.12% 3.20% ( 0.13%, 6.28%) $24,022 Richards Memorial Hospital 37 0 0.00% 3.65% 0.00% ( 0.00%, 5.60%) $20,127 Sabine County Hospital 23 $5,847 Scenic Mountain Medical Center 104 10 9.62% 3.16% 10.47%** ( 6.87%, 14.07%) $29,432 Seton Highland Lakes 61 3 4.92% 3.67% 4.61% ( 0.29%, 8.94%) $16,854 Shelby Regional Medical Center 25 $11,790 Starr County Memorial Hospital 49 0 0.00% 2.21% 0.00% ( 0.00%, 6.30%) $8,081 Triumph Hospital Amarillo Less than 5 Uvalde Memorial Hospital 104 2 1.92% 2.66% 2.49% ( 0.00%, 6.43%) $15,245
- 16. Source: Texas Health Care Information Collection. Texas Hospital Inpatient Discharge Public Use Data File, 2009. Texas Health Care Information Collection Congestive Heart Failure (CHF) Mortality Rate, 2009 Better quality may be associated with lower rates (C) Comment on the report submitted by the hospital Rates not calculated for hospitals with fewer than 30 cases * Risk-adjusted mortality rate is significantly lower than state average rate based on 95 percent confidence interval ** Risk-adjusted mortality rate is significantly higher than state average rate based on 95 percent confidence interval Metropolitan Statistical Area (MSA) Hospital Cases Number of Deaths Observed Mortality Rate Expected Mortality Rate Risk-Adjusted Mortality Rate (RAMR) 95% Confidence Interval for RAMR Mean Charge per Case Val Verde Regional Medical Center 97 5 5.15% 3.50% 5.07% ( 1.56%, 8.59%) $17,900 Winkler County Memorial Hospital 6 $7,446 Woodland Heights Medical Center 180 7 3.89% 4.23% 3.17% ( 0.86%, 5.47%) $55,036 Yoakum Community Hospital 79 7 8.86% 3.43% 8.91%** ( 4.94%, 12.87%) $13,362