
Recommended
Recommended
More Related Content
Similar to Solucion salina en diarrea aguda infecciosa
Similar to Solucion salina en diarrea aguda infecciosa (20)
More from franklinaranda
More from franklinaranda (20)
Recently uploaded
Recently uploaded (20)
Solucion salina en diarrea aguda infecciosa
- 1. Downloaded from adc.bmj.com on 19 May 2009 Isotonic is better than hypotonic saline for intravenous rehydration of children with gastroenteritis: a prospective randomised study K A Neville, C F Verge, A R Rosenberg, M W O’Meara and J L Walker Arch. Dis. Child. 2006;91;226-232; originally published online 13 Dec 2005; doi:10.1136/adc.2005.084103 Updated information and services can be found at: http://adc.bmj.com/cgi/content/full/91/3/226 These include: References This article cites 23 articles, 12 of which can be accessed free at: http://adc.bmj.com/cgi/content/full/91/3/226#BIBL 12 online articles that cite this article can be accessed at: http://adc.bmj.com/cgi/content/full/91/3/226#otherarticles Rapid responses 4 rapid responses have been posted to this article, which you can access for free at: http://adc.bmj.com/cgi/content/full/91/3/226#responses You can respond to this article at: http://adc.bmj.com/cgi/eletter-submit/91/3/226 Email alerting Receive free email alerts when new articles cite this article - sign up in the box at the service top right corner of the article Topic collections Articles on similar topics can be found in the following collections Infection (gastroenterology) (90 articles) Foodborne infections (44 articles) Metabolic disorders (2792 articles) Notes To order reprints of this article go to: http://journals.bmj.com/cgi/reprintform To subscribe to Archives of Disease in Childhood go to: http://journals.bmj.com/subscriptions/
- 2. Downloaded from adc.bmj.com on 19 May 2009 226 ORIGINAL ARTICLE Isotonic is better than hypotonic saline for intravenous rehydration of children with gastroenteritis: a prospective randomised study K A Neville, C F Verge, A R Rosenberg, M W O’Meara, J L Walker ............................................................................................................................... Arch Dis Child 2006;91:226–232. doi: 10.1136/adc.2005.084103 Aims: To determine whether the risk of hyponatraemia in children with gastroenteritis receiving intravenous (IV) fluids is decreased by the use of 0.9% saline. Methods: A prospective randomised study was carried out in a tertiary paediatric hospital. A total of 102 children with gastroenteritis were randomised to receive either 0.9% saline + 2.5% dextrose (NS) or 0.45% saline + 2.5% dextrose (N/2) at a rate determined by their treating physician according to hospital See end of article for authors’ affiliations guidelines and clinical judgement. Plasma electrolytes, osmolality, and plasma glucose were measured ....................... before (T0) and 4 hours after (T4) starting IV fluids, and subsequently if clinically indicated. Electrolytes and Correspondence to: osmolality were measured in urine samples. Results were analysed according to whether children were Dr K Neville, Department hyponatraemic (plasma sodium ,135 mmol/l) or normonatraemic at T0. of Endocrinology, Sydney Results: At T0, mean (SD) plasma sodium was 135 (3.3) mmol/l (range 124–142), with 37/102 (36%) Children’s Hospital, High hyponatraemic. At T4, mean plasma sodium in children receiving N/2 remained unchanged in those St Randwick, NSW 2031, Australia; kristen.neville@ initially hyponatraemic (n = 16), but fell 2.3 (2.2) mmol/l in the normonatraemic group. In contrast, among sesiahs.health.nsw.gov.au children receiving NS, mean plasma sodium was 2.4 (2.0) mmol/l higher in those hyponatraemic at baseline (n = 21) and unchanged in the initially normonatraemic children. In 16 children who were still Accepted receiving IV fluids at 24 hours, 3/8 receiving N/2 were hyponatraemic compared with 0/8 receiving NS. 29 November 2005 Published Online First No child became hypernatraemic. 13 December 2005 Conclusions: In gastroenteritis treated with intravenous fluids, normal saline is preferable to hypotonic ....................... saline because it protects against hyponatraemia without causing hypernatraemia. R ecent publications1–3 have highlighted the potential for METHODS life threatening hyponatraemia associated with the use The study was conducted at Sydney Children’s Hospital of intravenous hypotonic saline in hospitalised children, between the months of August and October 2002, corre- including children with gastroenteritis.2 4 Although most sponding to the annual peak incidence of rotavirus infec- guidelines recommend low osmolarity oral rehydration tion.14 Children aged between 6 months and 14 years with a solutions for rehydration of children with mild to moderate presumptive diagnosis of gastroenteritis were eligible for dehydration secondary to non-cholera gastroenteritis,5–7 enrolment in the study only after a decision to treat with intravenous fluids are frequently used when oral rehydration intravenous (IV) fluids had been made by their treating is not tolerated, particularly in developed countries.8–10 There physician, independent of the study (fig 1). The reasons is no consensus however on the most appropriate electrolyte recorded for this decision were the combination of dehydra- composition of intravenous (IV) fluids, with recommenda- tion and either continued vomiting or inadequate intake of tions ranging from 0.45% to 0.9% saline solutions.5–7 11 oral fluids in the emergency department. Children were Previously, we have documented antidiuretic hormone excluded from the study if they had a known abnormality of (ADH) activity inappropriate for the plasma sodium and ADH secretion, nephrogenic diabetes insipidus, pituitary or osmolality in children receiving intravenous fluids for mild to hypothalamic disease, renal disease, acute or chronic lung moderate dehydration associated with gastroenteritis.12 disease, or were receiving drugs known to stimulate ADH While this could cause dilutional hyponatraemia irrespective secretion. The study protocol was approved by the South of the saline content of the fluid, the use of a fluid with a Eastern Area Research Ethics Committee and informed higher tonicity presenting less electrolyte free water should consent was obtained from a parent/guardian of all children. reduce this risk.1 13 At enrolment, children were prospectively randomised to To explore this, we studied the changes in blood and urine receive either 0.45% saline + 2.5% dextrose (N/2) or 0.9% biochemistry in children with a presumptive diagnosis of saline + 2.5% dextrose (NS) by sequential selection of an gastroenteritis in whom a decision to treat with IV fluids had opaque sealed envelope containing the fluid choice. The been made by their treating physician. Apart from randomi- treating physician was told which fluid had been selected. sation to either normal or half normal saline, other aspects of The rate of infusion was not randomised, but was determined management, including fluid rate, were determined by the by the treating physician according to one of two clinical treating physician based on hospital guidelines and clinical protocols in use in the emergency department: the ‘‘rapid judgement. As we found previously that the biochemical replacement protocol’’ (RRP; 10 ml/kg/h for 4 hours), or the response to IV fluids differed according to the plasma sodium ‘‘slow replacement protocol’’ (SRP; maintenance fluids15 + at presentation,12 we analysed the results according to whether children were hyponatraemic or normonatraemic Abbreviations: ADH, antidiuretic hormone; IV, intravenous; RRP, rapid at presentation. replacement protocol; SRP, slow replacement protocol www.archdischild.com
- 3. Downloaded from adc.bmj.com on 19 May 2009 Intravenous fluids and gastroenteritis 227 children, in only 43 of whom was it passed between 21 and 852 children with presumed diagnosis of +2 hours of T0, consistent with this being a dehydrated gastroenteritis August to October 2002 population. In 36/43 children a subsequent urine specimen (U2nd) was obtained between 3 and 12 hours (median 4.8 hours) after T0, allowing analysis of the change in 262 eligible children electrolytes and osmolality. (Decision to treat with IV fluids made by The short term response of plasma and urinary electrolytes treating physician prior to enrolment in study) and osmolality to treatment was analysed according to whether the children were hyponatraemic (plasma sodium ,135 mmol/l) or normonatraemic at T0. A change in plasma 124/124 children approached and agreed sodium of >2 mmol/l was considered to be biochemically to participate† significant as this exceeds the coefficient of variation (CV) of the assay for the laboratory reference range of 135– 145 mmol/l (CV 1.3–1.5%). 62 randomised to 62 randomised to To gauge the prevalence of hypo- or hypernatraemia during 0.45% saline (N/2) 0.9% saline (NS) prolonged fluid administration, plasma and urinary data in 42/102 children (22 N/2) whose IV fluids were continued for .4 hours were analysed in each child. Variable data on each child were available (between 8 and 31 hours after T0) 51 in analysis 51 in analysis depending on the duration of IV infusion. 11 excluded (5 male) 11 excluded (4 male) 10 – no T4 blood sample 10 – no T4 blood sample Statistical analysis 1 – incorrect diagnosis 1 – fluid type changed in All statistical analyses were performed using the Statistical (renal impairment) error <4 hours Package for Social Sciences (SPSS Inc., Chicago, IL, version 11.0 for Windows). Results were expressed as either mean Figure 1 Flow diagram of patient selection. *Corresponding to the (SD) or median (range) unless otherwise indicated. Means annual peak incidence of rotavirus infection. ÀA registered nurse was between groups were compared by independent t tests and employed 40 hours per week (including weekends and after hours) to paired variables by paired sample t tests. Medians were facilitate the correct administration of the study protocol in a busy emergency department. Enrolment was carried out only during her shifts. compared by the Mann-Whitney U test and changes over time were compared by the Wilcoxon signed rank test. Categorical data were analysed using cross tabulation and the x2 test or Fisher’s exact test if two cells had expected counts estimated dehydration as a percentage of body weight less than 5. Statistical significance was defined as a p value replaced over 24 hours). Blood samples were collected before less than 0.05. (T0) and 4 hours after (T4) the start of IV fluids, with the T4 measurement corresponding to completion of the RRP. The study protocol permitted the treating physician to change the RESULTS fluid type after the first 4 hours of infusion. However this Baseline clinical and biochemical characteristics was done in two patients only: one child was changed from The mean (SD) plasma sodium concentration at T0 in the 102 NS to N/2 at 5 hours because the plasma sodium concentra- children was 135 (3.3) mmol/l (range 124–142). Thirty seven tion had increased from 130 to 135 mmol/l; and one was of the children (36%) were hyponatraemic at T0, four of changed from N/2 to NS at 10 hours because the plasma whom had a plasma sodium concentration less than sodium concentration remained below 135 mmol/l. 130 mmol/l. The median length of illness prior to presenta- Details of the illness prior to presentation were recorded. tion was longer in the hyponatraemic children (2 days, range The admission weight, length (in children under 2 years), or ,24 hours to 5 days) compared with the normonatraemic height and body mass index (BMI; weight/height2) were children (1 day, range ,24 hours to 7 days; p , 0.01) and expressed as standard deviation scores (SDS)16 17 to allow the mean BMI SDS was lower (20.7 (1.2) v 20.1 (1.1); comparison across ages. The degree of dehydration at p , 0.01). Comparing the children who were hyponatraemic presentation was estimated using standard clinical mea- versus those who were normonatraemic at T0, there were no sures.18 Stools for culture and rotavirus antigen testing were differences in age (mean 2.8 (1.3) years v 2.9 (2.0) years; obtained in 35/102 children, 30 of which were positive for p = 0.72), sex (51% v 46% male; p = 0.61), percent dehydra- rotavirus antigen. There were no differences in the historical, tion (median 5% (range 3–7) v 5% (range 3–7); p = 0.27), clinical, or biochemical characteristics at presentation or the rotavirus positivity (12/13 v 18/22 tested; p = 0.74), or the fluid rate received, comparing the 51 children who received type (43% v 53% N/2; p = 0.30) or rate (78% v 75% RRP; N/2 with the 51 who received NS (table 1) as would be p = 0.73) of intravenous fluids subsequently received. expected from the randomisation. The first urine was passed a median of 2.3 hours (range The blood samples were analysed for the concentrations of 21.0 to 13.5) after starting intravenous fluids. In the 76/102 sodium, potassium, bicarbonate, urea, and creatinine using in whom this was collected, the median urinary sodium ion selective electrodes, glucose using an oxygen rate method, concentration was higher in samples containing ‘‘moderate’’ and osmolality using freezing point depression. Urine sample or ‘‘large’’ ketones (57/76; 58 mmol/l, range ,10–209) collection via urine bag in incontinent children and clean compared with those that were negative for ketones or had catch specimens in toilet trained children was attempted for only trace or small amounts (19/76; 20 mmol/l, range ,10– the determination of sodium and potassium concentrations, 109; p , 0.01). tonicity (urinary sodium plus potassium concentration), and In the 43 children for whom a urine sample was passed osmolality. In addition, ketonuria was assessed by and obtained within 2 hours of T0, the median urinary Ketodiastix (Bayer Clinitest 50, Bridgend, South Wales, osmolality was 971 mOsm/kg (range 315–1290 mOsm/kg), UK) in the first urine specimen passed; the results were median urinary sodium concentration was 58 mmol/l (range recorded as either absent, trace, small, moderate, or large. A ,10–209 mmol/l), and median urinary potassium 71 mmol/l sample of the first urine passed was collected in 76/102 (range 13–232). The median urinary tonicity (urinary www.archdischild.com
- 4. Downloaded from adc.bmj.com on 19 May 2009 228 Neville, Verge, Rosenberg, et al Table 1 Baseline clinical and biochemical characteristics of the children randomly assigned to receive either 0.45% saline (N/2) or 0.9% saline (NS) N/2 NS n = 51 n = 51 M/F 30/21 23/28 Age, years* 3.1 (2.0) 2.7 (1.5) % dehydratedÀ 5 (3–7) 5 (3–7) Height SDS*` 0.4 (1.1) 0.5 (1.3) Weight SDS*` 0.0 (1.1) 0.1 (0.9) BMI SDS*` 20.4 (1.2) 20.3 (1.2) Duration of illness priorÀ 1 day (,24h–7d) 2 days (,24h–5d) Presenting symptoms, n (%) Vomiting illness only 18 (35%) 11 (22%) Diarrhoea only 1 (2%) 1 (2%) Vomiting and diarrhoea 32 (63%) 39 (77%) Fluid rate initiated RRP 40/51 38/51 SRP 11/51 13/51 Plasma biochemistry* Sodium, mmol/l 136 (2.8) 135 (3.6) Potassium, mmol/l 4.0 (0.5) 4.0 (0.5) Bicarbonate, mmol/l 17.9 (2.9) 17.8 (3.0) Urea, mmol/l 5.1 (1.9) 5.6 (1.9) Creatinine, mmol/l 46.6 (12.2) 45.9 (10.4) Glucose, mmol/l1 4.3 (1.1) 4.4 (1.1) Osmolality, mOsm/kg 281 (7) 281 (8) Hyponatraemia (plasma Na ,135 mmol/l) at T0, n (%) 16/51 (31%) 23/51 (41%) Urine biochemistryÀô n = 23 n = 20 Sodium, mmol/l 58 (,10–204) 63 (,10–209) Potassium, mmol/l 71 (13–171) 70 (19–232) Tonicity (sodium + potassium), mmol/l 161 (19–285) 153 (26–300) Osmolality, mOsm/kg 973 (315–1290) 1004 (574–1200) SDS, standard deviation score. Results are expressed as either *mean (SD) or Àmedian (range). As expected from randomisation, there were no significant differences between the groups. The rate of IV fluids received conformed to either the rapid replacement protocol (RRP) or slow replacement protocol (SRP) at the discretion of the treating physician. `The admission weight, length (in children under 2 years), or height and body mass index (BMI; weight/height2) were expressed as standard deviation scores (SDS) to allow comparison across ages. 1Four children aged between 0.9 and 3.7 years had blood glucose concentrations at T0 of between 2.0 and 2.6 mmol/l. The hypoglycaemia responded to the 2.5% dextrose content of each study fluid and subsequent investigations excluded a second pathology. ôAnalysis of urine samples collected in 43 of 49 children who passed urine between 21 and +2 hours of starting IV fluids. concentrations of sodium + potassium) was 161 mmol/l Effect of IV fluid type on plasma sodium at T 4 (range 19–300), approximately that of normal saline The plasma sodium response to N/2 versus NS differed (154 mmol/l). The urinary sodium, tonicity, and osmolality depending on whether the children were hyponatraemic or were similar in the NS (20/43) and N/2 (23/43) groups normonatraemic initially. (table 1) and were independent of whether children were After 4 hours rehydration with N/2, the mean plasma hyponatraemic (16/43) or normonatraemic (27/43) at base- sodium had not changed in the hyponatraemic children line (hyponatraemic versus normonatraemic children: med- (p = 0.32) but had decreased significantly in the initially ian urinary sodium 52 (range ,10 to 204) v 70 (range ,10 to normonatraemic group (p , 0.001; table 2, fig 2). In the 209), p = 0.39; median urinary tonicity 131 mmol/l (range 19 normonatraemic group, plasma sodium decreased by to 285) v 163 mmol/l (range 22 to 300), p = 0.1; median >2 mmol/l in 51% (18/35) compared with 13% (2/16) in urinary osmolality 935 (range 315 to 1290) v 1036 (range 356 the hyponatraemic group (p , 0.001; table 2). In 20% of the to 1239), p = 0.35). The median urinary potassium however initially normonatraemic children (7/35), the fall was was lower in the hyponatraemic children (68 (range 13–91) v >5 mmol/l. The maximum decrease was 6 mmol/l in two 89 (range 16–232), p = 0.03). children treated with N/2 by RRP. The maximum increase in plasma sodium over 4 hours was 3 mmol/l in a child treated Effect of IV fluid infusion rate on change in plasma with N/2 by SRP. sodium In contrast, after 4 hours rehydration with NS, there was a The infusion rate (RRP versus SRP) was not a determinant of mean increase in plasma sodium of 2.4 (1.5) mmol/l in the change in plasma sodium in either treatment arm. children who were initially hyponatraemic (p , 0.001) In the NS group, those treated with the RRP (38/51) had a compared with no significant change in the normonatraemic median change in sodium of +1 mmol/l (range 27 to 6) group (p = 0.08; table 2, fig 2). Thirteen per cent (4/30) of the versus SRP +2 mmol/l (range 21 to 8) (p = 0.08). In children normonatraemic group and none of the hyponatraemic group receiving N/2 the median change in plasma sodium in those experienced a decrease in plasma sodium of >2 mmol/l who received RRP (40/51) was 21 mmol/l (range 26 to +2) (table 2). The maximum decrease in plasma sodium versus 21 (range 25 to +3) in those treated according to the concentration was 7 mmol/l (140 to 133 mmol/l) in a SRP (p = 0.92, Mann-Whitney U test). normonatraemic child, in whom fluids were discontinued www.archdischild.com
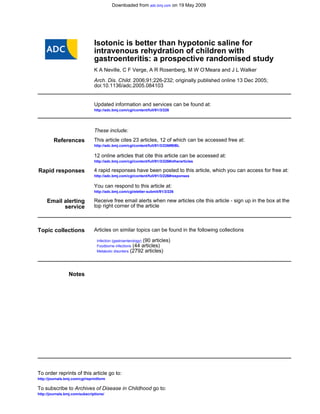
- 5. Downloaded from adc.bmj.com on 19 May 2009 Intravenous fluids and gastroenteritis 229 Table 2 Mean (SD) plasma sodium and osmolality at baseline (T0) and after 4 hours of intravenous rehydration (T4) in the initially hyponatraemic (plasma sodium ,135 mmol/l) versus normonatraemic (plasma sodium 135–145 mmol/l) children who received either 0.45% saline + 2.5% dextrose (N/2) or 0.9% saline + 2.5% dextrose (NS) N/2 (n = 51) NS (n = 51) Hyponatraemic Normonatraemic Hyponatraemic Normonatraemic (n = 16) (n = 35) p value (n = 21) (n = 30) p value T0 sodium (mmol/l) 132 (1.5) 137 (1.7) 132 (2.4) 137 (2.2) T4 sodium (mmol/l) 133 (1.8) 135 (1.8)* ,0.001 134 (2.1)* 138 (2.9) ,0.001 Change in sodium (mmol/l) +0.4 (1.7) 22.3 (2.2) ,0.001 +2.4 (2.0)À +0.8 (2.4)` 0.02 Sodium decreased > 2 mmol/l from 0–4 hours 13% (2/16) 51% (18/35) ,0.01 0% (0/21) 13% (4/30) 0.13 T0 osmolality (mOsm/kg) 277 (6.3) 283 (7.2) 0.005 277 (6.9) 284 (6.9) 0.001 T4 osmolality (mOsm/kg) 276 (4.4) 278*(5.0) 0.21 279 (4.3) 283 (6.7) 0.01 *p,0.001, T4 versus T0. Àp = 0.003, hyponatraemic children NS versus N/2. `p,0.001, normonatraemic children NS versus N/2. at completion of the RRP; it was associated with an secretion following volume expansion. In contrast, the inappropriately high urinary sodium concentration in concen- urinary concentration of sodium in the second sample varied trated urine at 6 hours (urinary sodium 76 mmol/l, potassium according to the initial plasma sodium concentration and the 94 mmol/l, tonicity 170 mmol/l, osmolality 885 mOsm/kg). The fluid received. The urinary concentration of sodium decreased maximum increase in plasma sodium over 4 hours was in the hyponatraemic children treated with NS and tended to 8 mmol/l, from 124 to 132 mmol/l in a child treated with NS do so in those receiving N/2 (table 3), whereas it increased in by SRP. Plasma osmolality changes in all groups were consistent the normonatraemic children receiving NS and did not with changes in plasma sodium (Table 2). change in those receiving N/2 (table 3). In keeping with the changes in concentration of sodium Response of urinary sodium, tonicity, and osmolality and potassium, the median urinary tonicity of the second to IV fluids urine sample had decreased significantly in the hyponatrae- To assess the response of urinary electrolytes and osmolality mic children (table 3) to less than that of half normal saline. to IV fluids, only the 36 children with a baseline (Ubase) and In the normonatraemic children, the median urinary tonicity subsequent (U2nd) urine sample were analysed (table 3). decreased, but remained above that of half normal saline in Apart from being slightly older than the rest of the study the N/2 group and remained approximately that of normal group (median 3.8 years (range 1.1–11.9) v 2.0 years (range saline in the NS group. 0.8–7.5); p , 0.001), the 36 children’s clinical and biochem- Median urine osmolality decreased in both treatment ical data (T0 and T4) were comparable with the group as a groups irrespective of the initial plasma sodium (table 3). whole. Nineteen received NS and 17/36 received N/2. Eight children in each group were hyponatraemic at T0. Biochemical changes during more prolonged fluid Irrespective of the fluid received or the plasma sodium at administration T0, urinary potassium concentration decreased (table 3), Forty two children (22 N/2 and 20 NS) received IV fluids for which would be consistent with a decrease in aldosterone more than 4 hours. These comprised all 24/102 children who A All children B Hyponatraemic at T0 C Normonatraemic at T0 145 145 145 p < 0.001 p < 0.001 p < 0.001 p < 0.001 140 140 140 Plasma sodium (mmol/l) 135 135 135 130 130 130 125 125 125 120 120 120 N/2 (51) NS (51) N/2 (16) NS (21) N/2 (35) NS (30) Figure 2 Box plots showing the plasma sodium concentration at baseline (T0; shaded) and after 4 hours (T4; white) infusion of either N/2 or NS in (A) all children and those who were either (B) hyponatraemic or (C) normonatraemic prior to starting IV fluids. Box plots show the mean (solid horizontal line), median (dashed horizontal line), interquartile range (box limits), and minimum and maximum (whiskers), except that extreme outliers (greater than 1.5 box lengths from the edge of the box) are shown as individual data points. In the N/2 group, mean plasma sodium concentration did not change in the initially hyponatraemic children and decreased in the initially normonatraemic children. In the NS group however, mean plasma sodium increased in the hyponatraemic children and did not change in the normonatraemic children. No child became hypernatraemic. *Paired t test T4 v T0. www.archdischild.com
- 6. Downloaded from adc.bmj.com on 19 May 2009 230 Neville, Verge, Rosenberg, et al were treated according to the SRP (table 1) plus 18/78 (11 N/ Table 3 Response of urinary sodium, potassium, tonicity (Na + K), and osmolality to either N/2 or NS, according to whether the children were hyponatraemic or normonatraemic at T0 in 2, 7 NS) who completed the RRP but continued IV fluids p value 0.003 0.006 according to the SRP because of continued vomiting or poor 0.01 0.63 the 36 children in whom a baseline urine sample (Ubase) was collected within 2 hours of T0, and a second sample (U2nd) was collected a median of 4.8 hours (range 3–12) after T0 oral fluid intake. Plasma biochemistry at T4 was similar to (317–1177) that of the group as a whole (data not shown). Plasma (19–294) (46–322) sodium concentrations were available at 24 hours in 16 (3–94) children (8 N/2) who continued to receive at least half of their maintenance requirement of fluid15 intravenously, at U2nd 39 125 165 881 which time no child receiving NS had a plasma sodium ,135 mmol/l (range 135–142 mmol/l) compared with 3/8 of (707–1200) the N/2 group (range 131–140 mmol/l). The maximum (17–209) (42–232) (59–300) NS (n = 11) increase in plasma sodium over 24 hours was 12 mmol/l to 136 mmol/l in a child receiving NS. To gauge the potential for clinically significant dilutional 107 183 79 1076 Ubase hyponatraemia among the 42 children who received pro- longed IV fluids, each individual’s longitudinal biochemical p value data were studied. Five of the 22 treated with N/2 but none 0.008 0.008 0.008 0.44 treated with NS (N/2 v NS: p = 0.03, Fisher’s exact test) had persistent significant hyponatraemia (sodium (131 mmol/l) or falls in plasma sodium >4 mmol/l to below 135 mmol/l (284–1139) (10–123) (67–170) associated with an inappropriately high urinary sodium (10–74) content (range 30–140 mmol/l) and urine osmolality higher than plasma osmolality (range 462–1058 mOsm/kg), suggest- U2nd 104 668 59 47 ing that they were at risk of dilutional hyponatraemia. The Normonatraemic at T0 plasma and urinary abnormalities were documented to (856–1239) persist for a median of 19 hours (range 8–27). (146–213) (16–124) (57–171) As no child who received prolonged NS developed this N/2 (n = 9) problem, we analysed data from the 22 children who received N/2 for more than 4 hours to identify potential clinical or 80 105 1036 178 Ubase biochemical predictors that could allow early detection of those at risk. Comparing the five children who developed significant dilutional hyponatraemia with the remaining p value 0.02 0.04 0.02 0.02 17/22, no clinical or biochemical parameters emerged that would allow early identification of those at risk, except for continuation of IV fluids beyond 4 hours after completion of (339–1059) (,10–75) the RRP (completion of RRP: 5/5 affected v 6/17 unaffected; (14–140) (6–65) p = 0.04). Apart from a slightly higher median urea (6.8 mmol/l (range 5.3–9.1) v 5.1 mmol/l (range 1.2–8.7); U2nd 24 16 40 768 p = 0.02) suggestive of more severe dehydration, there were no differences in their median age (p = 0.09), BMI SDS (p = 0.24), estimated degree of dehydration (p = 0.54), (574–1072) (,10–109) length of illness prior to presentation (p = 0.49), baseline (26–175) (19–88) plasma sodium (p = 0.82), bicarbonate (p = 0.09), or creati- NS (n = 8) nine (p = 0.14). Three of the five children had stool cultures Ubase 38 58 106 935 performed, all of whom were positive for rotavirus. The p values refer to the comparison by Kruskall Wallis test of U2nd with Ubase. DISCUSSION p value 0.09 0.02 0.02 0.02 Recently, the basis for the use of intravenous hypotonic saline solutions in sick children has been questioned and it has been (110–944) suggested that the use of isotonic saline solutions might (,10–82) (11–109) decrease the frequency of iatrogenic hyponatraemia.1 2 13 In (4–38) this prospective, randomised study we have shown that when U2nd children with gastroenteritis are treated with intravenous 506 23 23 45 fluids, hyponatraemia is less likely to develop or persist if an Hyponatraemic at T0 isotonic rather than hypotonic saline solution is used. Osmolality (mOsm/kg) 976 (332–1290) 72 (,10–204) Results are expressed as median (range). The baseline clinical and biochemical characteristics of the 151 (19–285) 70 (12–91) 102 children in our current report were similar to those in our N/2 (n = 8) previous study.12 Hyponatraemia was common at presenta- Ubase tion (36%). This has been attributed to the sodium content of diarrhoeal losses19 20 and low salt intake;19 but the inappro- priately high urinary sodium content we again documented at presentation may also contribute. The relationship we Tonicity (mmol/l) observed between the sodium concentration in the first urine Na (mmol/l) sample passed and the degree of ketonuria suggests that the K (mmol/l) excretion of ketones as sodium salts may have contributed to the relatively high urinary sodium concentrations, consistent with reported association between natriuresis and starva- tion.19 21 www.archdischild.com
- 7. Downloaded from adc.bmj.com on 19 May 2009 Intravenous fluids and gastroenteritis 231 What is already known on this topic What this study adds N Hyponatraemia in hospitalised children, including N Biochemical evidence shows that in children with those with gastroenteritis, is common and can be gastroenteritis, hypotonic saline solutions exacerbate associated with cerebral oedema and death the tendency to develop dilutional hyponatraemia N Hypotonic saline solutions are frequently used in while isotonic saline solutions are protective children and have been suggested to contribute to the N Urinary biochemistry suggests that isotonic solutions development of hyponatraemia are safe because hyponatraemic children retain sodium and normonatraemic children excrete it appropriately Non-osmotic ADH activity is thought to underlie the development of hospital acquired dilutional hyponatraemia by preventing the excretion of electrolyte free water during 4 hours, whereas plasma sodium increased in the hypo- fluid administration.3 22 Gerigk and colleagues23 documented natraemic children who received NS, a fluid roughly isotonic raised ADH levels independent of osmolality in children with with respect to their initial urinary tonicity. The normona- a variety of common acute childhood illnesses and we have traemic children on the other hand, did not conserve sodium. reported that osmotically inappropriate ADH activity is Although urinary potassium excretion decreased in these common and persistent in children with gastroenteritis.12 children, the median urinary concentration of sodium was Consistent with this, the biochemical response to N/2 was unchanged in the N/2 group and increased in the NS group. The normonatraemic children treated with N/2 therefore almost identical in this and our previous study12 in which all continued to excrete urine that was hypertonic relative to the of the children received N/2. In both studies, the mean infused fluid. This would explain the accompanying decrease plasma sodium concentrations of children who were initially in plasma sodium concentration. Those given NS continued normonatraemic decreased, and those of children who were to excrete urine isotonic with respect to the infused fluid and hyponatraemic did not improve in response to N/2. Half the maintained their plasma sodium concentration unchanged. normonatraemic children and 13% of the hyponatraemic The basis of the greater renal avidity for sodium in the children treated with N/2 experienced a decrease in plasma hyponatraemic compared with the normonatraemic children sodium >2 mmol/l, and after 24 hours, 3 of 8 children largely is unclear. A similar phenomenon has been described in rats dependent on IV fluids were hyponatraemic. In contrast, the infused simultaneously with normal saline and ADH, in use of isotonic saline over 4 hours resulted in maintenance of whom those fed a salt poor diet prior to the infusion were plasma sodium in those initially normonatraemic and an better able to retain sodium and maintain their plasma increase in those initially hyponatraemic. None developed sodium than those whose dietary content of salt had been hypernatraemia. After 24 hours, all 8/51 children still normal.27 The median duration of illness was longer in the receiving normal saline were normonatraemic. Five of the hyponatraemic children and therefore, in addition to more 22 (23%) who received prolonged half-normal saline dis- prolonged sodium losses in diarrhoeal stools19 and urine,12 played biochemistry suggestive of dilutional hyponatraemia, their dietary intake of sodium is likely to have been lower compared with none of the 20 treated with normal saline. than for those children who were normonatraemic at These findings suggest that in children with gastroenteritis, presentation. Relatively chronic sodium depletion therefore the use of hypotonic fluids exacerbates the tendency to may have promoted the development of renal adaptive develop hyponatraemia whereas the use of isotonic saline is responses, resulting in more rapid reversal of the natriuresis protective. evident at presentation. Differential suppression of aldoster- The urinary biochemistry may provide some basis for one activity in the normonatraemic versus hyponatraemic understanding the decreased risk of hyponatraemia in children during fluid therapy might have contributed if the children given isotonic saline and is reassuring with respect hyponatraemic children were more dehydrated at baseline; to the risk of hypernatraemia. As seen in our previous study,12 however there were no clinical or biochemical data to support despite mild to moderate dehydration and irrespective of the this. Furthermore, the similar decrease in urinary potassium plasma sodium concentration, the median urinary sodium in the hyponatraemic and normonatraemic children and concentration at presentation approximated that of half- significant decrease in urinary sodium concentration in the normal saline and the urinary tonicity approximated that of hyponatraemic children treated with NS but not N/2 suggests normal saline. Urinary tonicity is a better reflection of free that mechanisms other than aldosterone were acting. water clearance than urinary osmolality24 because an We conclude that when intravenous fluids are deemed important component of osmolality is urea, which readily necessary in children with gastroenteritis, isotonic saline crosses cell membranes and therefore does not influence solutions with appropriate glucose content should be used. water movement. Administration of a fluid of lower tonicity The question arises however as to whether this recommenda- than that of the urine being passed is predicted to result in a tion should be restricted to gastroenteritis. Non-osmotic decrease in plasma sodium concentration because of the stimulants of ADH secretion (such as nausea and vomiting, retention of free water implicit in the excretion of urine with pain, and metabolic stress)28 are common and likely to be a higher tonicity. After several hours of IV fluids, the urinary active in a variety of clinical situations for which intravenous potassium decreased in all children in our study and the fluids are used. The protective effect of normal saline against median urinary sodium concentrations of the hyponatraemic the development of hyponatraemia and the ability of the children in both treatment groups had decreased to levels normonatraemic children to increase urinary sodium excre- consistent with maximal renal conservation of sodium tion suggest that broadening the use of isotonic fluids with (approximately 20 mmol/l;25 26 table 3); thus the urinary appropriate glucose content should be considered. tonicity of the hyponatraemic children had decreased to less than the tonicity of N/2. As a result, the plasma sodium ACKNOWLEDGEMENTS concentrations of the hyponatraemic children receiving We thank Ms Kate Lyle (RN), the study coordinator, without whose hypotonic saline were maintained (but not improved) over hard work and dedication the study would not have been possible. www.archdischild.com