Process Optimization Sales Deck

This Slideshare presentation is a partial preview of the full business document. To view and download the full document, please go here: http://flevy.com/browse/flevypro/process-optimization-sales-deck-1853 DOCUMENT DESCRIPTION This document includes a set of slides on Process Optimization. Note these slides are not related to Lean Six Sigma or Operational Excellence. These slides were originally developed to be included in sales decks for a management consulting firm. ABOUT FLEVYPRO FlevyPro is a subscription service for on-demand business frameworks and analysis tools. FlevyPro subscribers receive access to an exclusive library of curated business documents—business framework primers, presentation templates, Lean Six Sigma tools, and more—among other exclusive benefits.

Recommended
More Related Content
Viewers also liked
Viewers also liked (13)
More from Flevy.com Best Practices
More from Flevy.com Best Practices (20)
Recently uploaded
Recently uploaded (20)
Process Optimization Sales Deck
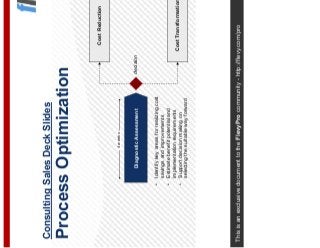
- 1. This is an exclusive document to the FlevyPro community - http://flevy.com/pro Consulting Sales Deck Slides Process Optimization • Identify key areas for realizing cost savings and improvements • Estimate benefit potential and implementation requirements • Support decision making on selecting the suitable way forward decision 4 weeks Cost Transformation Cost Reduction Diagnostic Assessment
- 2. 2This document is an exclusive document available to FlevyPro members - http://flevy.com/pro This document includes a set of slides on Process Optimization Presentation Overview This document includes a set of slides on Process Optimization. Note these slides are not related to Lean Six Sigma or Operational Excellence. These slides were originally developed to be included in sales decks for a management consulting firm. The top left title of each slide indicates the functional intent of each slide (indicated by the off-slide red arrow). Please use and modify to your needs. Some information may be out of date and will need to be updated accordingly. The content on this slide has been partially hidden. FlevyPro members can download the full document here: http://flevy.com/browse/flevypro/process-optimization-sales-deck-1853
- 3. 3This document is an exclusive document available to FlevyPro members - http://flevy.com/pro Over the last 18 months, prices for both the industry and consumers have risen dramatically—no decrease expected any time soon Business Need & Value Proposition Slide Source: Bureau of Labor Statistics, Producer Price Index-Commodities, not seasonally adjusted, Jan 07-Jun08 Electric power, 12% Iron and steel, 51% Rice, 64% Corn, 90% Wheat, 96% Natural gas, 97% Gasoline, 106.00% Petroleum, 149% Industrial chemicals, 36% 0% 20% 40% 60% 80% 100% 120% 140% 160% 180% Changes in Producer Prices (Jan 07 – Jun 08) = Direct impact on businesses = Direct impact on consumers The content on this slide has been partially hidden. FlevyPro members can download the full document here: http://flevy.com/browse/flevypro/process-optimization-sales-deck-1853
- 4. 4This document is an exclusive document available to FlevyPro members - http://flevy.com/pro Besides these exploding prices, the present overall economic climate is not looking favorable Business Need & Value Proposition Slide Macro Economic Issue Evidence Consumers overtaken by pessimism • Inflation has risen to 15.9% for energy and 5.1% for food • Home prices are declining while unemployment has increased to 5.5% • Consumer confidence hits 16-year low Economic outlook indicates recession • Real GDP growth slowing down: • Negative GDP growth reported for Q4 2007 by BEA • CEO confidence indices record low5 Weak US Dollar • Dollar has weakened 16% against Euro and 11% against Yen during January 2007 – June 2008 Stock markets falling • S&P 500 down 16% in June 2008 since October 2007 peak • NASDAQ down 13% in June 2008 since October 2007 peak Implications • Companies need to undertake specific tactics to survive and win in the downturn economy • Increase of import prices • Export opportunities becoming more lucrative • Investors expecting lower rates of return across industries • Companies challenged to meet investors’ expectations • Consumers are losing purchasing power and reducing spending • New revenue streams are increasingly difficult to acquire Credit crunch resulting in capital challenge • Lending standards are getting tighter and decreasing liquidity: • Institutional loan issuance in Q2/08 down 61% from the previous year • IPO activity in Q1/08 down 60% from the previous quarter • Higher cost of capital limits profitable investment opportunities • Capital shortage makes it harder to finance CAPEX In these circumstances outsourcing can create efficiencies and significant cost savings. The content on this slide has been partially hidden. FlevyPro members can download the full document here: http://flevy.com/browse/flevypro/process-optimization-sales-deck-1853
- 5. 5This document is an exclusive document available to FlevyPro members - http://flevy.com/pro Though pressure on corporate profitability is coming from many different directions, costs are still the most directly controllable by any firm Business Need & Value Proposition Slide Profits Cost challenge Increasing material prices Overhead costs Capital . challenge High cost of capital Availability of capital Revenue challenge Declining or stagnating revenues • Firms have direct control over their procurement and cost structure • Efficiency and effectiveness improvements through new operating models provide sustainable mid-to-long term benefits • Cost of debt and the availability of capital are defined by the markets – a firm has limited or no influence • Strong balance sheet provides shelter, but changes to the capital structure are not carried out overnight • In downturn economy, capturing of new revenue streams is challenging and has risky payoff • Requires increased SG&A and/or R&D spending The capital challenge during downturn is largely beyond control of the firm Possibility for strategic changes and significantly impact the bottom line Limited and risky possibilities for bottom- line improvement Firm’s span of control: Firm’s span of control: Firm’s span of control: The content on this slide has been partially hidden. FlevyPro members can download the full document here: http://flevy.com/browse/flevypro/process-optimization-sales-deck-1853
- 6. 6This document is an exclusive document available to FlevyPro members - http://flevy.com/pro Business Need & Value Proposition Slide Throughout the organization, there are opportunities to achieve cost savings by improving various business processes Procurement Information Technology Finance and Accounting Human Resources Operations Marketing / Sales Logistics Service Product Development PrimaryactivitiesSupportactivities • There opportunities for process improvement across all the primary and support activities: – Impact mainly Selling, General & Administrative costs (SG&A) and Cost of Goods Sold (COGS) • Operational and transactional in nature Value Chain Process Improvement Opportunities Specific cost management opportunities have been defined and categorized by the Value Chain framework in the following slides. The content on this slide has been partially hidden. FlevyPro members can download the full document here: http://flevy.com/browse/flevypro/process-optimization-sales-deck-1853
- 7. 7This document is an exclusive document available to FlevyPro members - http://flevy.com/pro Optimum finance and accounting costs structure can be attained with operational excellence and right process sourcing strategies Finance and Accounting Example • Global sourcing strategies (SSC, outsourcing, off-shore locations) to achieve optimum cost structure in service delivery: – Over 90% of world class finance organizations use shared services for AP, T&E, Credit and Technology Portfolio1 Global process sourcing Operational efficiency • Process streamlining and harmonization: – Often supported by service consolidation and continuous improvement • Simplification of the infrastructure: – Fewer bank accounts, legal entities, business reports Best performing companies have 51% lower overall finance costs than median companies1 IT support • Imaging and workflow management, electronic transaction handling, decision support and decision automation, self service • Streamlining systems and information flow: – Especially for global companies with many local operations and systems Management insight through cost management systems • Cost measurement with reliable and up-to- date cost info and insight • Cost management through informed decision making: – Product mix and pricing, CRM, supplier selection, product design, cost reduction initiatives, make or buy decisionsSource: (1) The Hackett Group, 2008 Potential More focus on value adding business analytics and risk management Business Need & Value Proposition Slide – Finance and Accounting The content on this slide has been partially hidden. FlevyPro members can download the full document here: http://flevy.com/browse/flevypro/process-optimization-sales-deck-1853
- 8. 8This document is an exclusive document available to FlevyPro members - http://flevy.com/pro HR The HR function provides cost management opportunities with process optimization and HR service portfolio alignment Process & organization optimization • Outsourcing and/or Shared Services help to provide low cost transactional services • Standardized processes decrease cycle times and HR headcount need • Low complexity organization reduces coordination effort and costs • Improved recruiting process (shorten cycle, “choose better”) saves attrition related costs HR Shared Services with automated processes present over 20% cost reductions potential¹ HR services portfolio re- alignment • Prioritization of HR service portfolio allows to focus budget on services that are key to business success • Workforce analytics to identify ‘must have’, ‘should have’ and ‘nice to have’ HR services Source: (1) The Hackett Group, 2007 – based on survey of 125 companies Example Automation of transactional processes (eHR) • eHR services enable self-service and minimize HR workload • Common infrastructure as a platform for coherent processes, applications, environment and data development Potential Business Need & Value Proposition Slide – Human Resources The content on this slide has been partially hidden. FlevyPro members can download the full document here: http://flevy.com/browse/flevypro/process-optimization-sales-deck-1853
- 9. 9This document is an exclusive document available to FlevyPro members - http://flevy.com/pro Our experience tells there is 10-30% opportunity for IT cost reduction without compromising IT efficiency, effectiveness or IT agility IT Example • Streamlining the IT organization • Headcount reductions where reasonable IT Governance & Organization IT Project Portfolio Management 10-20% Personnel and transaction costs IT Operations & Services IT Performance Management IT Infrastructure and Architecture IT Sourcing & Partner Management • Lower IT budget through stronger focus on value-adding projects • IT project portfolio management to prioritize, align and control projects • Assessment of the IT service portfolio and making “Make or Buy” decisions • Downsize support organization through service harmonization • Reduction of fixed assets by using sell and lease back options, analysis of IT value and cost drivers, SLA-based controlling • Raise standardization level of applications, infrastructure and data landscape to improve IT efficiency • Improved bundling of procurement orders for hardware, software and IT services • Audit and re-negotiation of existing contracts with suppliers and service providers 15-25% Personnel and development costs 15-35% Personnel and operating costs 10-20% various costs 10-20% Operating and maintenance costs 5-15% HW, SW and operating costs Potential Business Need & Value Proposition Slide – IT The content on this slide has been partially hidden. FlevyPro members can download the full document here: http://flevy.com/browse/flevypro/process-optimization-sales-deck-1853
- 10. 10This document is an exclusive document available to FlevyPro members - http://flevy.com/pro Procurement Sourcing and Procurement Programs are among the top 5 programs for achieving major savings and improving the organization cost structure • Review and modify procurement channels to reduce operating costs • Manage product and service demand through effective procurement approval processes • Reduce time required in procure – to – pay process cycle Procure-to-pay processes Strategic sourcing • Extend strategic sourcing to complex indirect sourcing categories / increase spend under management control • Review existing contracts to identify cost savings opportunities • Restructure supply base to take advantage of exchange rates • Improve Source-to-Contract processes Reduced spending by 5% - 25% Compliance • Reduce contract leakage and maverick purchasing • Compliance and exception reporting process - providing insight to "on" vs. "off" contract purchases • Define preferred suppliers for top spend categories Supply Chain Risk Management • Review and optimize supply chain costs (supply chain cost analysis) • Define supplier risk exposure and develop risk management strategy Reduced cost by 5% - 10% Reduced cost by 3% - 8% Reduced cost by 5% - 20% Example Potential Business Need & Value Proposition Slide – Procurement The content on this slide has been partially hidden. FlevyPro members can download the full document here: http://flevy.com/browse/flevypro/process-optimization-sales-deck-1853
- 11. 11This document is an exclusive document available to FlevyPro members - http://flevy.com/pro R&D is among the first areas to experience retrenchment during downturn, however, there are also opportunities to improve R&D efficiency Product Development Example • Portfolio level decision making at control gates to optimize R&D pipeline value, risk level and resource use: – Customer insight, technology insight and business case driven process • Integrated decision making with lifecycle updates and refreshments Portfolio management Operational efficiency • Gate approval model to justify investment decision for the next phase: – Separating innovation and conceptualizing, detailed product definition, product creation, and technology development • Shortening of development cycles and time to market Reduced time-to- market, increased R&D resource efficiency and effectiveness. Technology leverage • Product Lifecycle Management, Product Data Management, Electronic data capture • End-to-end product architecture and information management Modularity and common platforms • Reducing redundancy and accelerating development with modular product design and use of common platforms • Supported by product architecture management and information transparency Potential Business Need & Value Proposition Slide – Product Development The content on this slide has been partially hidden. FlevyPro members can download the full document here: http://flevy.com/browse/flevypro/process-optimization-sales-deck-1853
- 12. 12This document is an exclusive document available to FlevyPro members - http://flevy.com/pro Logistics & Fulfillment On average, logistics costs represent 9.7% of a company’s revenue, making logistics an important area of focus for cost improvement1 Examples • Holistically align costs and service levels of the distribution network with commercial objectives • Relocate sourcing and DC locations based on “new economy” fuel price trends • Select the right transportation mode, routing, and carrier based on cost and service criteria • Consolidate shipments and leverage backhaul and continuous move opportunities • Ensure the freight payment process audits for correct accessorial and fuel surcharges; auto-pay carriers to reduce payment approval overhead • Institute a core carrier program to optimize transportation spend by carrier by lane • Scorecard vendors and carriers to drive compliance with both routing guides and delivery performance metrics • Improve the efficiency of receiving, put-away, order selection, and other labor-intensive warehouse activities • Ensure optimized warehouse product slotting for space and labor efficiency • Replace costly safety stock inventory with information about in-transit inventory • Leverage the capabilities, assets, and lower cost profile of third-party logistics providers Distribution Network Optimization Reduce total logistics costs by 10% - 18% Transportation Management Warehouse Management Logistics Outsourcing Reduce transportation costs by 7% - 20% Reduce variable warehouse costs by 10% - 25% Reduce inventory by 5% - 15% Supply Chain Event Management Source: (1) 2007 Logistics Cost and Service survey for CSCMP published by Establish, Inc. / Herbert W. David & Co Potential Business Need & Value Proposition Slide – Logistics The content on this slide has been partially hidden. FlevyPro members can download the full document here: http://flevy.com/browse/flevypro/process-optimization-sales-deck-1853
- 13. 13This document is an exclusive document available to FlevyPro members - http://flevy.com/pro In addition to marketing budget and headcount cuts, there are other opportunities for better managing your marketing and sales spending Sales & Marketing Example • Target, up-sell and cross-sell to High Value Customers (HVC) • Exit unprofitable customers • Service level differentiation Customer segmentation and value planning Optimized spend and focus, decreased service costs, helps build loyalty Loyalty and customer satisfaction programs • Retention programs for HVC, increase perceived switching costs • Surveys and other tools build perception of value Channel consolidation and rationalization • Sales, Service and Fulfillment channel process optimization • Vendor consolidation/rationalization • Training (decrease time to resolution) • Online tool development (decreases live channel interactions) Improve sales force effectiveness • Improve personalized sales efforts, sales automation, improve tendering process, reduce customer specific customization • Transfer sales to on-line channel, sales agents, external value chain partners Increased customer loyalty, decreased new customer acquisition costs Self service methods and live channel streamlining reduce sales costs Improved sales force efficiency, decreased direct sales costs Potential Business Need & Value Proposition Slide – Sales & Marketing The content on this slide has been partially hidden. FlevyPro members can download the full document here: http://flevy.com/browse/flevypro/process-optimization-sales-deck-1853
- 14. 14This document is an exclusive document available to FlevyPro members - http://flevy.com/pro 14 Business Need & Value Proposition Slide Process Optimization assessments will focus on the process itself, those performing the process, as well as enabling technologies People Process Employee productivity causes lag A reduction in Productivity Results in Increased Overhead, Inefficiency, and Wasted Resources Process itself causes lag in productivity Technology System does not support high level of productivity We can help the client target and determine the best level of prioritization of initiatives that will reduce costs. 2 3 1 The content on this slide has been partially hidden. FlevyPro members can download the full document here: http://flevy.com/browse/flevypro/process-optimization-sales-deck-1853
- 15. 15This document is an exclusive document available to FlevyPro members - http://flevy.com/pro 15 Business Need & Value Proposition Slide Process Optimization assessments across people and process has become a basic focus cost reduction Process Optimization: Measures the cost and financial performance of activities, resources, and cost objects Assigns resources to activities and activities to cost objects based on their use, and recognizes the casual relationships of cost drivers to activities How much do we spend? What do we do? For which products do we do it? Cost Center 1 Total Bank Expenses Product A Product B Product C Activities Product D Product E Cost Center 2 Cost Center 3 Cost Center 4 Cost Center 5 Activities ActivitiesActivities Activities Book costs to appropriate cost centers Drive cost center costs to activity based process cost pools Drive pool costs to objects Activity-Based Costing indicates the Costs of Activities and Objects Activity-BasedCostingindicatesthe Costsof ActivitiesandObjects Activities Resources Cost Objects What is usedtodo work Towhat, orfor whomis workdone (What work) is done Activities Cost Drivers Performance Measures Why? What? HowWell? Why is workdoneor what impacts an activity’scost, time, or quality (What work) is done Howwell isworkdone ActivityBasedManagement focusesonunderstanding WHYandHOWWELL ABC ABM Cost Inputs Process Costs Cost Objects Reporting Raw Material Costs Manufacturing Costs Packaging/ Distribution Costs Direct Business Center/ Marketing Costs R&D Costs Corporate Charges Customer Related Activities Package / Distribution Activities Product Related Activities Manufacturing Activities Support Activities New Product Development Activities Manufacturing Packaging/ Distribution Product Groups Product Profitability Customer Profitability Process Costs Product 1 Product 2 Product 3 Product 4 Customer 1 Customer 2 Customer 3 Sales & Mktg. R&D Pkg/Dist Mfg Customer Groups The content on this slide has been partially hidden. FlevyPro members can download the full document here: http://flevy.com/browse/flevypro/process-optimization-sales-deck-1853
- 16. 16This document is an exclusive document available to FlevyPro members - http://flevy.com/pro 16 Industry Benchmarks Cost reductions upwards of 50% can be achieved through various process optimization initiatives throughout the organization Activity Function Potential Reduction in Cost Finance Overall 51% HR Overall 20% IT Governance & Organization 10-20% Project Portfolio Management 15-25% Operations and Services 15-35% Performance Management 10-20% Infrastructure and Architecture 10-20% Sourcing and Partner Management 10-20% Procurement Strategic Sourcing 5-25% Procure-to-Pay 5-10% Compliance 3-8% Supply Chain Risk Management 5-20% Logistics and Fulfillment Transportation 7-20% Warehouse 10-25% Inventory 5-15% Highest potential function – quick hit process optimization initiativesThe content on this slide has been partially hidden. FlevyPro members can download the full document here: http://flevy.com/browse/flevypro/process-optimization-sales-deck-1853
- 17. 17This document is an exclusive document available to FlevyPro members - http://flevy.com/pro 17 An initial diagnostic assessment shows the key areas to realize cost savings and how to best leverage these going forward Approach • Identify key areas for realizing cost savings and improvements • Estimate benefit potential and implementation requirements • Support decision making on selecting the suitable way forward decision 4 weeks Cost Transformation Cost Reduction Fast cost savings Fundamental change Diagnostic Assessment Identified areas for improvement and cost savings Objectives: Outcome: The content on this slide has been partially hidden. FlevyPro members can download the full document here: http://flevy.com/browse/flevypro/process-optimization-sales-deck-1853
- 18. 18This document is an exclusive document available to FlevyPro members - http://flevy.com/pro 18 While cost reduction focuses on quickly generating savings, cost trans- formation centers around fundamental change for longer-term success Concept and design Time-boxed results delivery Concept and design Transformation planning Time-boxed results delivery Defined alternatives and opportunities Transformation planned Delivered solutions and results Design and plan for realizing the savings Savings realized Approx. 6 weeks From 1 to 3 months Approx. 10 weeks Approx. 4 weeks Up to 1-3 years, adaptable time boxes of 3-6 months Approach • Realizes cost savings with rapid restructuring and implementation: – Delivers short-to-medium term benefits • Top-down opportunity and solution identification: – Financial analysis, benchmarking, leading practices • Changes company’s cost structure and transforms the way business is run: – Emphasize on efficiency and effectiveness improvements – Delivers medium-to-long term benefits • Bottom-up opportunity and solution identification: – Workshops, interviews supported by financial analysis Cost Reduction Cost Transformation FAST COST SAVINGS FUNDAMENTAL CHANGE The content on this slide has been partially hidden. FlevyPro members can download the full document here: http://flevy.com/browse/flevypro/process-optimization-sales-deck-1853
- 19. 19This document is an exclusive document available to FlevyPro members - http://flevy.com/pro 19 The deal concept phase can be broken into 5 key stages Approach Week 0 Week 1 Week 2 Week 3 Week 4 Week 5 Week 6 Week 7 Week 8 Week 9 Final blueprint design and implementation planning Set Up, Hypothesis Generation and Focus Hypotheses-led Analysis and Diagnostics Blueprint Option Development Business Case Development/ Prioritisation Integrated Way Forward Design Top down financial analysis To-Be Model DevelopmentJoint team onboardin g Hypothesis generation Selected focus interview Focused analysis and diagnosticsSales and customer management Operations Organisation and support services Information management and systems Opportunity quantification, validation and prioritisation Review of Existing Initiatives Regular meetings with the Executive Steering Committee 1 2 3 4 5 The content on this slide has been partially hidden. FlevyPro members can download the full document here: http://flevy.com/browse/flevypro/process-optimization-sales-deck-1853
- 20. 20This document is an exclusive document available to FlevyPro members - http://flevy.com/pro Flevy (www.flevy.com) is the marketplace for premium documents. These documents can range from Business Frameworks to Financial Models to PowerPoint Templates. Flevy was founded under the principle that companies waste a lot of time and money recreating the same foundational business documents. Our vision is for Flevy to become a comprehensive knowledge base of business documents. All organizations, from startups to large enterprises, can use Flevy— whether it's to jumpstart projects, to find reference or comparison materials, or just to learn. Contact Us Please contact us with any questions you may have about our company. • General Inquiries support@flevy.com • Media/PR press@flevy.com • Billing billing@flevy.com The content on this slide has been partially hidden. FlevyPro members can download the full document here: http://flevy.com/browse/flevypro/process-optimization-sales-deck-1853
- 21. 1 Flevy (www.flevy.com) is the marketplace for premium documents. These documents can range from Business Frameworks to Financial Models to PowerPoint Templates. Flevy was founded under the principle that companies waste a lot of time and money recreating the same foundational business documents. Our vision is for Flevy to become a comprehensive knowledge base of business documents. All organizations, from startups to large enterprises, can use Flevy— whether it's to jumpstart projects, to find reference or comparison materials, or just to learn. Contact Us Please contact us with any questions you may have about our company. • General Inquiries support@flevy.com • Media/PR press@flevy.com • Billing billing@flevy.com