call girls in Nand Nagri (DELHI) 🔝 >༒9953330565🔝 genuine Escort Service 🔝✔️✔️
Ryder2QFinInfo
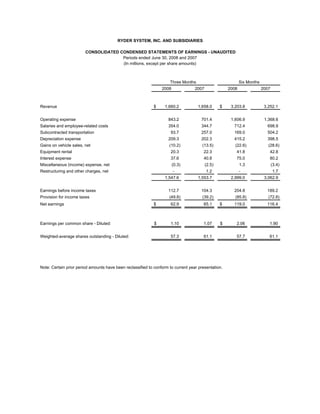
1. RYDER SYSTEM, INC. AND SUBSIDIARIES
CONSOLIDATED CONDENSED STATEMENTS OF EARNINGS - UNAUDITED
Periods ended June 30, 2008 and 2007
(In millions, except per share amounts)
Three Months Six Months
2008 2007 2008 2007
Revenue $ 1,660.2 1,658.0 $ 3,203.8 3,252.1
Operating expense 843.2 701.4 1,606.9 1,368.6
Salaries and employee-related costs 354.0 344.7 712.4 698.9
Subcontracted transportation 93.7 257.0 169.0 504.2
Depreciation expense 209.3 202.3 415.2 398.5
Gains on vehicle sales, net (10.2) (13.5) (22.6) (28.6)
Equipment rental 20.3 22.3 41.8 42.8
Interest expense 37.6 40.8 75.0 80.2
Miscellaneous (income) expense, net (0.3) (2.5) 1.3 (3.4)
Restructuring and other charges, net - 1.2 - 1.7
1,547.6 1,553.7 2,999.0 3,062.9
Earnings before income taxes 112.7 104.3 204.8 189.2
Provision for income taxes (49.8) (39.2) (85.8) (72.8)
Net earnings $ 62.9 65.1 $ 119.0 116.4
Earnings per common share - Diluted: $ 1.10 1.07 $ 2.06 1.90
Weighted-average shares outstanding - Diluted: 57.3 61.1 57.7 61.1
Note: Certain prior period amounts have been reclassified to conform to current year presentation.
2. RYDER SYSTEM, INC. AND SUBSIDIARIES
CONSOLIDATED CONDENSED BALANCE SHEETS
PRELIMINARY AND SUBJECT TO RECLASSIFICATION
(Dollars in millions)
(unaudited)
June 30, December 31,
2008 2007
Assets:
Cash and cash equivalents $ 107.4 116.5
Other current assets 1,037.9 1,105.6
Revenue earning equipment, net 4,678.7 4,501.4
Operating property and equipment, net 554.6 518.7
Other assets 689.8 612.4
$ 7,068.4 6,854.6
Liabilities and shareholders' equity:
Short-term debt / current portion of long-term debt $ 269.1 222.7
Other current liabilities 754.4 796.7
Long-term debt 2,721.1 2,553.4
Other non-current liabilities (including deferred income taxes) 1,472.9 1,394.2
Shareholders' equity 1,850.9 1,887.6
$ 7,068.4 6,854.6
SELECTED KEY RATIOS
June 30, December 31,
2008 2007
Debt to equity 162% 147%
Total obligations to equity (a) * 171% 157%
Twelve months ended June 30,
2008 2007
Return on average shareholders' equity 13.9% 14.4%
Return on average assets 3.7% 3.6%
Return on capital* 7.4% 7.6%
(a) Total obligations represent debt plus off-balance sheet equipment obligations.
* Non-GAAP financial measure; see reconciliation to closest GAAP financial measure included within this
release.
3. RYDER SYSTEM, INC. AND SUBSIDIARIES
BUSINESS SEGMENT REVENUE AND EARNINGS - UNAUDITED
Periods ended June 30, 2008 and 2007
(Dollars in millions)
Three Months Six Months
2008 2007 B(W) 2008 2007 B(W)
Revenue:
Fleet Management Solutions:
Full service lease $ 516.1 489.2 5% $ 1,020.3 965.2 6%
Contract maintenance 41.9 40.0 5% 82.5 77.2 7%
Contractual revenue 558.0 529.2 5% 1,102.8 1,042.4 6%
Contract-related maintenance 50.1 50.1 0% 101.8 102.2 (0)%
Commercial rental 146.6 145.3 1% 279.3 276.3 1%
Other 21.6 17.6 23% 40.0 35.2 13%
Fuel 425.0 295.1 44% 783.1 569.3 38%
Total Fleet Management Solutions 1,201.3 1,037.3 16% 2,307.0 2,025.4 14%
Supply Chain Solutions 440.9 584.0 (25)% 855.1 1,150.4 (26)%
Dedicated Contract Carriage 143.7 141.1 2% 280.9 279.6 0%
Eliminations (125.7) (104.4) (20)% (239.2) (203.3) (18)%
Total revenue $ 1,660.2 1,658.0 0% $ 3,203.8 3,252.1 (1)%
Operating Revenue: *
Fleet Management Solutions $ 776.3 742.2 5% $ 1,523.9 1,456.1 5%
Supply Chain Solutions 349.7 330.0 6% 691.7 652.1 6%
Dedicated Contract Carriage 141.3 138.1 2% 275.3 273.7 1%
Eliminations (51.4) (53.2) 4% (102.7) (105.6) 3%
Total operating revenue $ 1,215.9 1,157.1 5% $ 2,388.2 2,276.3 5%
Business segment earnings:
Earnings before income taxes:
Fleet Management Solutions $ 115.8 97.5 19% $ 207.2 178.3 16%
Supply Chain Solutions 6.8 15.5 (56)% 15.1 26.9 (44)%
Dedicated Contract Carriage 12.4 12.5 (1)% 23.7 22.9 4%
Eliminations (7.7) (8.0) 3% (15.1) (16.9) 10%
127.3 117.5 8% 230.9 211.2 9%
Unallocated Central Support Services (8.1) (12.0) 33% (19.7) (20.3) 3%
Earnings before restructuring and
other charges, net and income taxes 119.2 105.5 13% 211.2 190.9 11%
Restructuring and other charges, net and Brazil charges (6.5) (1.2) NA (6.5) (1.7) NA
Earnings before income taxes 112.7 104.3 8% 204.8 189.2 8%
Provision for income taxes (49.8) (39.2) (27)% (85.8) (72.8) (18)%
Net earnings $ 62.9 65.1 (3)% $ 119.0 116.4 2%
* Non-GAAP financial measure
Note: Amounts may not recalculate due to rounding.
4. RYDER SYSTEM, INC. AND SUBSIDIARIES
BUSINESS SEGMENT INFORMATION - UNAUDITED
Periods ended June 30, 2008 and 2007
(Dollars in millions)
Three Months Six Months
2008 2007 B(W) 2008 2007 B(W)
Fleet Management Solutions
Total revenue $ 1,201.3 1,037.3 16% $ 2,307.0 2,025.4 14%
Fuel revenue (425.0) (295.1) 44% (783.1) (569.3) 38%
Operating revenue * $ 776.3 742.2 5% $ 1,523.9 1,456.1 5%
Segment earnings before income taxes $ 115.8 97.5 19% $ 207.2 178.3 16%
Earnings before income taxes as % of total revenue 9.6% 9.4% 9.0% 8.8%
Earnings before income taxes as % of operating revenue * 14.9% 13.1% 13.6% 12.2%
Supply Chain Solutions
Total revenue $ 440.9 584.0 (25%) $ 855.1 1,150.4 (26%)
Subcontracted transportation (91.2) (254.0) (64%) (163.4) (498.3) (67%)
Operating revenue * $ 349.7 330.0 6% $ 691.7 652.1 6%
Segment earnings before income taxes $ 6.8 15.5 (56%) $ 15.1 26.9 (44%)
Earnings before income taxes as % of total revenue 1.5% 2.6% 1.8% 2.3%
Earnings before income taxes as % of operating revenue * 1.9% 4.7% 2.2% 4.1%
Memo: Fuel costs $ 47.2 31.3 (51%) $ 87.7 59.2 (48%)
Dedicated Contract Carriage
Total revenue $ 143.7 141.1 2% $ 280.9 279.6 0%
Subcontracted transportation (2.4) (3.0) (17%) (5.6) (5.9) (4%)
Operating revenue * $ 141.3 138.1 2% $ 275.3 273.7 1%
Segment earnings before income taxes $ 12.4 12.5 (1%) $ 23.7 22.9 4%
Earnings before income taxes as % of total revenue 8.6% 8.9% 8.4% 8.2%
Earnings before income taxes as % of operating revenue * 8.8% 9.1% 8.6% 8.4%
Memo: Fuel costs $ 36.5 26.5 (37%) $ 67.2 51.2 (31%)
* Non-GAAP financial measure
Note: Amounts may not recalculate due to rounding.
5. RYDER SYSTEM, INC. AND SUBSIDIARIES
NON-GAAP FINANCIAL MEASURE RECONCILIATIONS - PRELIMINARY AND UNAUDITED
(In millions)
OPERATING REVENUE RECONCILIATION Three months Six months
2008 2007 2008 2007
Total revenue $ 1,660.2 1,658.0 $ 3,203.8 3,252.1
Fuel services and subcontracted transportation revenue (518.7) (552.1) (952.1) (1,073.5)
Fuel eliminations 74.4 51.2 136.5 97.7
Operating revenue * $ 1,215.9 1,157.1 $ 2,388.2 2,276.3
CASH FLOW RECONCILIATION Six months ended June 30,
2008 2007
Net cash provided by operating activities $ 522.5 505.2
Proceeds from sales (primarily revenue earning equipment) 142.9 195.1
Proceeds from sale & leaseback of assets - 150.3
Collections on direct finance leases 31.9 31.8
Other, net 0.3 0.8
Total cash generated * 697.6 883.2
Capital expenditures (609.0) (885.2)
Free cash flow * $ 88.6 (2.0)
SCS REVENUE RECONCILIATION Three months ended June 30, Six months ended June 30,
2008 2007 B(W) 2008 2007 B(W)
Total SCS revenue $ 440.9 584.0 (25%) $ 855.1 1,150.4 (26%)
Customer contract modification - 179.3 (100) - 354.1 (100)
Adjusted total SCS revenue* $ 440.9 404.7 9% $ 855.1 796.3 7%
DEBT TO EQUITY RECONCILIATION June 30, December 31,
2008 % to Equity % to Equity
2007
On-balance sheet debt $ 2,990.2 162% $ 2,776.1 147%
Off-balance sheet debt - PV of minimum lease payments
and guaranteed residual values under operating leases for
vehicles (a) 168.7 178.0
Total obligations * $ 3,158.9 171% $ 2,954.1 157%
NET EARNINGS AND EPS RECONCILIATION Three Months Six Months
2008 Net Earnings 2008 EPS 2008 Net Earnings 2008 EPS
Net earnings $ 62.9 1.10 $ 119.0 2.06
Brazil charges 6.8 0.12 6.8 0.12
Net earnings excluding Brazil charges $ 69.8 1.22 $ 125.9 2.18
Note: The Brazil charges many not recalculate on an individual basis due to rounding.
RETURN ON CAPITAL RECONCILIATION Twelve months ended June 30,
2008 2007
Net earnings (12-month rolling period) $ 256.5 247.5
+ Restructuring and other charges, net and other items 8.0 -
+ Income taxes 164.5 150.9
Adjusted earnings before income taxes 429.0 398.4
+ Adjusted interest expense (b) 165.3 160.4
- Adjusted income taxes (c) (234.3) (211.7)
= Adjusted net earnings for ROC (numerator) $ 360.0 347.1
Average total debt $ 2,833.4 2,755.5
+ Average off-balance sheet debt 183.6 97.7
+ Average adjusted total shareholders' equity (d) 1,844.6 1,711.6
= Adjusted average total capital (denominator) $ 4,861.6 4,564.8
Adjusted ROC * 7.4% 7.6%
Notes:
(a) Discounted at the incremental borrowing rate at lease inception.
(b) Interest expense includes implied interest on off-balance sheet vehicle obligations.
(c) Income taxes were calculated using the effective income tax rate for the period exclusive of
benefits from tax law changes recognized in 2006.
(d) Represents shareholders' equity adjusted for accounting changes and tax
benefits in those periods.
* Non-GAAP financial measure
Certain prior period amounts have been reclassified to conform to current year presentation.