1. Financials 21
Mohawk Industries, Inc. + Subsidiaries
Table of Contents
22 Selected Financial Data
24 Management’s Discussion and Analysis of
Financial Condition and Results of Operations
33 Consolidated Statements of Earnings
34 Consolidated Balance Sheets
35 Consolidated Statements of Stockholders’
Equity and Comprehensive Income
36 Consolidated Statements of Cash Flows
37 Notes to Consolidated Financial Statements
51 Independent Auditors’ Report
51 Management’s Report
52 Stockholder Information
2. 22 Selected Financial Data
Mohawk Industries, Inc. + Subsidiaries
2002(h)
AT OR FOR THE YEARS ENDED DECEMBER 31, 2003
IN THOUSANDS, EXCEPT PER SHARE DATA
Statement of Earnings Data:
Net sales $5,005,053 4,522,336
Cost of sales 3,645,677 3,282,269
Gross profit 1,359,376 1,240,067
Selling, general and administrative expenses 817,347 718,002
Restructuring costs (a) – –
Carrying value reduction of property,
plant and equipment and other assets (b) – –
Class action legal settlement (c) – –
Compensation expense for stock option exercises (d) – –
Operating income 542,029 522,065
Interest expense (e) 55,575 68,972
Acquisition costs – World Merger (f) – –
Other (income) expense, net (1,980) 9,464
53,595 78,436
Earnings before income taxes 488,434 443,629
Income taxes 178,285 159,140
Net earnings $ 310,149 284,489
Basic earnings per share (g) $ 4.68 4.46
Weighted-average common shares outstanding (g) 66,251 63,723
Diluted earnings per share (g) $ 4.62 4.39
Weighted-average common and dilutive
potential common shares outstanding (g) 67,121 64,861
Balance Sheet Data:
Working capital $ 646,483 640,846
Total assets 4,163,575 3,596,743
Short-term note payable – –
Long-term debt (including current portion) 1,012,413 820,427
Stockholders’ equity 2,297,801 1,982,879
(a) During 1996, the Company recorded pre-tax restructuring 1997, the Company recorded a charge of $5.5 million arising
costs of $0.7 million related to certain mill closings whose from a revision in the estimated fair value of certain property,
operations have been consolidated into other Mohawk plant and equipment held for sale based on current
facilities. appraisals and other market information related to a mill
closing in 1995. During 1998, the Company recorded a
(b) During 1996, the Company recorded a charge of $3.1 million
charge of $2.9 million for the write-down of assets to be
arising from the write-down of property, plant and equipment
disposed of relating to the acquisition of World.
to be disposed of related to the closing of a manufacturing
facility in 1996 and a revision in the estimate of fair value of (c) The Company recorded a one-time charge of $7.0 million in
certain property, plant and equipment based on current 2000, reflecting the settlement of two class-action lawsuits.
market conditions related to mill closings in 1995. During
3. Selected Financial Data 23
Mohawk Industries, Inc. + Subsidiaries
2001 2000 1999 1998 1997 1996
3,445,945 3,404,034 3,211,575 2,848,810 2,521,297 2,324,486
2,613,043 2,581,185 2,434,716 2,167,523 1,961,433 1,811,780
832,902 822,849 776,859 681,287 559,864 512,706
505,745 505,734 482,062 432,191 383,523 367,251
– – – – – 700
– – – 2,900 5,500 3,060
– 7,000 – – – –
– – – – 2,600 –
327,157 310,115 294,797 246,196 168,241 141,695
29,787 38,044 32,632 31,023 36,474 39,772
– – – 17,700 – –
5,954 4,442 2,266 2,667 338 4,586
35,741 42,486 34,898 51,390 36,812 44,358
291,416 267,629 259,899 194,806 131,429 97,337
102,824 105,030 102,660 79,552 51,866 40,395
188,592 162,599 157,239 115,254 79,563 56,942
3.60 3.02 2.63 1.91 1.33 0.96
52,418 53,769 59,730 60,393 59,962 59,310
3.55 3.00 2.61 1.89 1.32 0.95
53,141 54,255 60,349 61,134 60,453 59,899
449,361 427,192 560,057 438,474 389,378 390,889
1,768,485 1,795,378 1,682,873 1,405,486 1,233,361 1,226,959
– – – – – 21,200
308,433 589,828 596,065 377,089 402,854 486,952
948,551 754,360 692,546 611,059 493,841 409,616
(d) A charge of $2.6 million was recorded in 1997 for income tax (g) The Board of Directors declared a 3-for-2 stock split on
reimbursements to be made to certain executives related to October 23, 1997, which was paid on December 4, 1997,
the exercise of stock options granted in 1988 and 1989 in to holders of record on November 4, 1997. Earnings per
connection with the Company’s 1988 leveraged buyout. share and weighted-average common share data have
been restated to reflect the split.
(e) In December 2002, the Company discontinued hedge
accounting for its interest rate swap. The impact of (h) In 2002, the Company adopted the provisions of Financial
Accounting Standards Board SFAS No. 142 “Goodwill and
discontinuing the hedge was to increase interest expense
Other Intangible Assets” which required the Company to
by approximately $10.7 million.
cease amortizing goodwill and evaluate such goodwill and
(f) The Company recorded a one-time charge of $17.7 million in
indefinite intangibles for impairment.
1998 for transaction expenses related to the World merger.
4. 24 M a n a g e m e n t ’s D i s c u s s i o n a n d A n a l y s i s o f F i n a n c i a l C o n d i t i o n a n d R e s u l t s o f O p e r a t i o n s
Mohawk Industries, Inc. + Subsidiaries
On November 10, 2003, the Company acquired
O V E RV I E W
The Company is the leading producer of floorcovering the assets and assumed certain liabilities of the
products for residential and commercial applications in commercial carpet division of Burlington Industries, Inc.,
the United States. The Company is the second largest known as Lees Carpet, from W.L. Ross & Company for
carpet and rug manufacturer, and a leading approximately $350 million in cash. The results of
manufacturer, marketer and distributor of ceramic tile operations for Lees Carpet have been included with
and natural stone, in the United States. Annual the Mohawk segment results and in the Company’s
floorcovering sales within the United States in 2002 consolidated financial statements since that date. The
were approximately $20.3 billion. The Company had primary reason for the acquisition was to expand the
annual net sales in 2003 in excess of $5.0 billion. Company’s presence in the commercial carpet market.
The primary categories of the floorcovering industry The Company has two operating segments, the
include carpet and rugs (65%), ceramic tile (12%), vinyl Mohawk segment and the Dal-Tile segment. The
and rubber (10%), hardwood (9%) and laminate (4%). Mohawk segment sells and distributes its product
Compound average growth rates in units sold (measured lines, which include broadloom carpet, rugs, pad,
in square yards) for all categories, except the vinyl and ceramic tile, hardwood, vinyl and laminate through
rubber category, for the period from 1992 through 2002 independent floor covering retailers, home centers,
have met or exceeded the growth rate for both the mass merchandisers, department stores, commercial
gross domestic product of the United States and dealers and commercial end users. The Dal-Tile
housing starts over the same period. During this period, segment product lines include ceramic tile, porcelain
the compound average growth rate was 3.6% for carpet tile and stone products sold through company-operated
and rugs, 10.3% for ceramic tile, 1.3% for vinyl and sales service centers, independent distributors and
rubber and 8.0% for hardwood. Laminate, which is a home centers.
relatively new product, experienced a compound average
growth rate of 41.5% from 1996 through 2002. Although CRITICAL ACCOUNTING POLICIES
beginning from a smaller base, the growth rates for hard The Company’s discussion and analysis of financial
floorcoverings may indicate increasing consumer condition and results of operations are based on its
preference for these products for certain applications. consolidated financial statements that were prepared in
In response to this increasing demand, the Company accordance with accounting principles generally
has increased its distribution of hard surface products, accepted in the United States of America.
including ceramic tile, vinyl, hardwood and laminate. The Company makes estimates and assumptions
The acquisition of Dal-Tile provided a unique opportunity when preparing financial statements. These estimates
to help the Company achieve its strategic goal of and assumptions affect various matters, including:
becoming one of the world’s leading floorcovering • reported amounts of assets and liabilities in the
manufacturers and distributors. Company’s Consolidated Balance Sheets at the
The Company continues to experience growth both dates of the financial statements,
internally and through acquisitions. • disclosure of contingent assets and liabilities at the
On March 20, 2002, the Company acquired all of the dates of the financial statements, and
outstanding capital stock of Dal-Tile International Inc. • reported amounts of revenues and expenses in the
(“Dal-Tile”), a leading manufacturer and distributor of Company’s Consolidated Statements of Earnings
ceramic tile in the United States, for approximately during the reporting periods. These estimates involve
$1,469 million in stock and cash. The transaction was judgments with respect to, among other things,
accounted for using the purchase method of accounting future economic factors that are difficult to predict
and, accordingly, the results of operations of Dal-Tile and are beyond management’s control. As a result,
have been included in the Company’s consolidated actual amounts could differ from these estimates.
financial statements from March 20, 2002. The primary The Securities and Exchange Commission (“SEC”)
reason for the acquisition was to expand the Company’s issued disclosure guidance for accounting policies that
presence in the ceramic tile and stone markets. management believes are most “critical.” The SEC
defines these critical accounting policies as those
that are both most important to the portrayal of a
company’s financial condition and results and require
management’s most difficult, subjective, or complex
judgment, often as a result of the need to make
estimates about the effect of matters that are inherently
uncertain and may change in subsequent periods.
5. M a n a g e m e n t ’s D i s c u s s i o n a n d A n a l y s i s o f F i n a n c i a l C o n d i t i o n a n d R e s u l t s o f O p e r a t i o n s 25
Mohawk Industries, Inc. + Subsidiaries
The Company believes the following accounting are compared against anticipated future usage, which
policies require it to use judgments and estimates in is a function of historical usage and anticipated future
preparing its consolidated financial statements and selling price, in order to evaluate obsolescence and
could represent critical accounting policies as defined excessive quantities, and expected sales below cost.
by the SEC. The Company discusses its significant Actual results could differ from assumptions used
accounting policies, including those that do not require to value obsolete, excessive inventory or inventory
management to make difficult, subjective, or complex expected to be sold below cost and additional
judgments or estimates, in Note 1 to the Consolidated reserves may be required.
Financial Statements. • Goodwill and indefinite life intangible assets are
• Accounts receivable and revenue recognition. subject to annual impairment testing. The
Revenues are recognized when goods are shipped impairment tests are based on determining the fair
and legal title passes to the customer. The Company value of the specified reporting units and indefinite
provides allowances for expected cash discounts, life intangible assets based on management
returns, claims and doubtful accounts based upon judgments and assumptions using estimated future
historical bad debt and claims experience and periodic cash flows. These judgments and assumptions
evaluation of specific customer accounts and the could materially change the value of the specified
aging of accounts receivable. If the financial condition reporting units and indefinite life intangible assets
of the Company’s customers were to deteriorate, and, therefore, could materially impact the
resulting in an impairment of their ability to make Company’s consolidated financial statements.
payments, additional allowances may be required. • Deferred tax assets and liabilities are recognized
• Inventories are stated at the lower of cost or market for the future tax consequences attributable to
(net realizable value). Cost is determined using the differences between the financial statement
last-in, first-out method (LIFO) predominantly within carrying amounts of existing assets and liabilities
the Mohawk segment, which matches current costs and their respective tax bases. Deferred tax assets
with current revenues, and the first-in, first-out and liabilities are measured using enacted tax rates
method (FIFO), which is used to value inventory expected to apply to taxable income in the years in
within the Dal-Tile segment. Inventories on hand which the temporary differences are expected to be
recovered or settled. The effect on deferred tax
assets and liabilities of a change in the tax rates is
recognized in earnings in the period that includes
the enactment date. Additionally, taxing jurisdictions
could retroactively disagree with the Company’s tax
treatment of certain items, and some historical
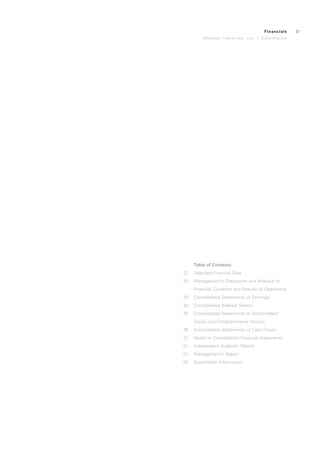
$4.62 transactions have income tax effects going forward.
$5,005
Accounting rules require these future effects to be
$4.39
evaluated using current laws, rules and regulations,
$4,522
each of which can change at any time and in an
unpredictable manner.
$3.55
$3,446
$2,000 $2.00
01 02 03 01 02 03
Net Sales Earnings Per Share
(In millions)
6. 26 M a n a g e m e n t ’s D i s c u s s i o n a n d A n a l y s i s o f F i n a n c i a l C o n d i t i o n a n d R e s u l t s o f O p e r a t i o n s
Mohawk Industries, Inc. + Subsidiaries
R E S U LT S O F O P E R AT I O N S
Following are the results of operations for the last three years:
AT OR FOR THE YEARS ENDED DECEMBER 31, 2003 2002 2001
IN THOUSANDS
Statement of Earnings Data:
Net sales $5,005,053 100.0% 4,522,336 100.0% 3,445,945 100.0%
Cost of sales 3,645,677 72.8% 3,282,269 72.6% 2,613,043 75.8%
Gross profit 1,359,376 27.2% 1,240,067 27.4% 832,902 24.2%
Selling, general and administrative expenses 817,347 16.3% 718,002 15.9% 505,745 14.7%
Operating income 542,029 10.9% 522,065 11.5% 327,157 9.5%
Interest expense 55,575 1.1% 68,972 1.5% 29,787 0.9%
Other (income) expense, net (1,980) 0.0% 9,464 0.2% 5,954 0.2%
53,595 1.1% 78,436 1.7% 35,741 1.1%
Earnings before income taxes 488,434 9.8% 443,629 9.8% 291,416 8.4%
Income taxes 178,285 3.6% 159,140 3.5% 102,824 3.0%
Net earnings $ 310,149 6.2% 284,489 6.3% 188,592 5.4%
During 2003, specifically the first half of 2003, the recorded net sales of $3,736.5 million in 2003 compared
Company and industry performance as a whole was to $3,624.2 million in 2002, representing an increase of
impacted negatively by the overall weak conditions $112.4 million or approximately 3.1%. The growth was
in the U.S. economy and cautious consumer and attributable to the Lees Carpet acquisition and internal
commercial spending. The Company believes that growth of product lines. The Dal-Tile segment recorded net
the residential replacement business is recovering sales of $1,268.5 million in 2003, reflecting an increase of
in response to improved economic conditions. The $370.4 million or 41.2%, over the $898.2 million reported
Company believes that the commercial business is also in the year ended December 31, 2002. The Dal-Tile results
beginning to show signs of improvement at certain are not included in the Company’s consolidated financial
price points and anticipates the higher end business will statements prior to the March 20, 2002 acquisition.
improve later in 2004. The Company is implementing However, when the Dal-Tile net sales for the year ended
a price increase in both the Mohawk and Dal-Tile December 31, 2003, are compared to the Dal-Tile pro
segment during the first quarter of 2004 to compensate forma net sales of $1,134.2 million for the year ended
for increased raw material prices, resulting from higher December 31, 2002 (derived by combining Dal-Tile net
oil and natural gas prices and higher import prices. sales of $236.0 million prior to the March 20, 2002
acquisition date, after reclassifications to conform to
Year Ended December 31, 2003, as Compared with Mohawk’s presentation, with reported Dal-Tile net sales
Year Ended December 31, 2002 of $898.2 million for the period ending December 31,
Net sales for the year ended December 31, 2003, were 2002), an increase of approximately 11.8% for the period
$5,005.1 million, reflecting an increase of $482.7 million, was realized. The growth was primarily attributable to
or approximately 10.7%, over the $4,522.3 million reported growth within residential products. The Company believes
in the year ended December 31, 2002. The increased net this pro forma net sales information will be useful to
sales were attributable to the acquisition of Dal-Tile and investors because it allows investors to compare the
Lees Carpet and internal growth. The Mohawk segment results of the two periods.
7. M a n a g e m e n t ’s D i s c u s s i o n a n d A n a l y s i s o f F i n a n c i a l C o n d i t i o n a n d R e s u l t s o f O p e r a t i o n s 27
Mohawk Industries, Inc. + Subsidiaries
Quarterly net sales and the percentage changes in net Interest expense for 2003 was $55.6 million compared
sales by quarter for 2003 versus 2002 were as follows to $69.0 million in 2002. The decrease in interest expense
(dollars in thousands): was attributable to lower average debt levels during 2003
when compared to 2002, offset by an increase in the
2003 2002 CHANGE
average borrowing rate due to a change in the mix of
fixed and variable rate debt in 2003 when compared to
First quarter $1,084,715 866,710 25.2%
2002. Additionally, interest expense for 2002 included
Second quarter 1,247,181 1,227,747 1.6
$10.7 million related to the write-off of an interest rate
Third quarter 1,303,166 1,224,403 6.4 swap previously accounted for as a cash flow hedge.
Fourth quarter 1,369,991 1,203,476 13.8 Income tax expense was $178.3 million, or 36.5% of
earnings before income taxes for 2003 compared to $159.1
Total year $5,005,053 4,522,336 10.7%
million, or 35.9% of earnings before income taxes for 2002.
The change in tax rate resulted from the use of fewer
Gross profit was $1,359.4 million (27.2% of net sales)
available tax credits in 2003 when compared to 2002.
for 2003 and $1,240.1 million (27.4% of net sales) for
2002. The reduction in percentage was primarily
Year Ended December 31, 2002, as Compared with Year
attributable to a change in the selling mix, increased raw
Ended December 31, 2001
material prices resulting from higher oil and natural gas
Net sales for the year ended December 31, 2002, were
prices, higher import prices and start up costs related to
$4,522.3 million, reflecting an increase of $1,076.4 million,
the new Dal-Tile manufacturing facility.
or approximately 31.2%, over the $3,445.9 million reported
Selling, general and administrative expenses for 2003
in the year ended December 31, 2001. The increased net
were $817.3 million (16.3% of net sales) compared to
sales were attributable to the Dal-Tile acquisition and
$718.0 million (15.9% of net sales) for 2002. The
internal growth of the Mohawk segment product lines. The
increased percentage was primarily attributable to the
Mohawk segment recorded net sales of $3,624.2 million in
acquisition of Dal-Tile, which has higher selling, general
2002 compared to $3,445.9 million in 2001, representing
and administrative expenses.
an increase of $178.2 million or approximately 5.2%. The
Operating income for 2003 was $542.0 million (10.9%
growth was attributable to all segment product lines. Since
of net sales) compared to $522.1 million (11.5% of net
the completion of the Dal-Tile acquisition, the Dal-Tile
sales) in 2002. Operating income attributable to the
segment recorded net sales of $898.2 million in 2002.
Mohawk segment was $364.0 million (9.7% of segment
On a pro forma combined basis, the Dal-Tile segment
net sales) in 2003 compared to $390.9 million (10.8% of
net sales were $1,134.2 million (derived by combining
segment net sales) in 2002. The percentage decrease in
Dal-Tile net sales of $236.0 million prior to the March 20,
operating income was attributable to the higher costs
2002 acquisition date, after reclassifications to conform to
associated with oil and natural gas prices and a change in
Mohawk’s presentation, with reported Dal-Tile net sales of
the selling mix. Operating income attributable to the Dal-
$898.2 million for the period ending December 31, 2002)
Tile segment was $187.2 million (14.8% of segment net
for 2002. This compares to Dal-Tile net sales of $1,036.8
sales) in 2003, compared to $139.9 million (15.6% of
million (derived from net sales prior to the March 20,
segment net sales) in 2002. The decrease in operating
2002, acquisition) for 2001, resulting in an increase of
income as a percentage of net sales is primarily
approximately 9.4% for the period. The growth was
attributable to a change in the product mix, higher import
primarily attributable to growth within residential products.
prices and start-up costs of a new manufacturing facility.
The Company believes this pro forma net sales
On a pro forma combined basis, the Dal-Tile segment
information will be useful to investors because it allows
operating income was $171.7 million (15.1% of pro forma
investors to compare the results of the two periods.
segment net sales) for 2002 (derived by combining Dal-Tile
operating income of $31.8 million prior to the March 20,
2002 acquisition, after reclassifications to conform to
Mohawk’s presentation, with reported Dal-Tile operating
income of $139.9 million for the period ended December
31, 2002). The Company believes that presentation of this
pro forma combined operating income information will be
useful to investors because it allows investors to compare
the results between the two periods.
8. 28 M a n a g e m e n t ’s D i s c u s s i o n a n d A n a l y s i s o f F i n a n c i a l C o n d i t i o n a n d R e s u l t s o f O p e r a t i o n s
Mohawk Industries, Inc. + Subsidiaries
Quarterly net sales and the percentage changes in net Interest expense for 2002 was $69.0 million compared
sales by quarter for 2002 versus 2001 were as follows to $29.8 million in 2001. The increase in interest expense
(dollars in thousands): was attributable to additional debt incurred in March 2002
to finance the acquisition of Dal-Tile, the write-off of
2002 2001 CHANGE
approximately $10.7 million relating to an interest rate
swap previously accounted for as a cash flow hedge
First quarter $ 866,710 777,339 11.5%
and an increase in the average borrowing rate due to a
Second quarter 1,227,747 864,958 41.9
change in the mix of fixed rate and variable rate debt,
Third quarter 1,224,403 907,850 34.9 when compared to 2001.
Fourth quarter 1,203,476 895,798 34.3 Income tax expense was $159.1 million, or 35.9%
of earnings before income taxes for 2002 compared to
Total year $4,522,336 3,445,945 31.2%
$102.8 million, or 35.3% of earnings before income
taxes for 2001.
Gross profit was $1,240.1 million (27.4% of net sales)
for 2002 and $832.9 million (24.2% of net sales) for 2001.
L I Q U I D I T Y A N D C A P I TA L R E S O U R C E S
Gross profit as a percentage of net sales in 2002 was
The Company’s primary capital requirements are for
favorably impacted when compared to 2001 by Dal-Tile’s
working capital, capital expenditures and acquisitions.
higher gross profit percentage and improved manufacturing
The Company’s capital needs are met primarily through a
efficiencies within the Mohawk segment.
combination of internally generated funds, bank credit
Selling, general and administrative expenses for
lines, term and senior notes, the sale of receivables and
2002 were $718.0 million (15.9% of net sales)
credit terms from suppliers.
compared to $505.7 million (14.7% of net sales) for
The level of accounts receivable increased from
2001. The increased percentage was attributable to the
$501.1 million at the beginning of 2003 to $573.5 million
Dal-Tile segment, which has higher selling, general and
at December 31, 2003. The $72.4 million increase was
administrative expenses, but also has higher gross profit
primarily attributable to the acquisition of Lees Carpet
as a percentage of net sales. The Mohawk and Dal-Tile
and internal sales growth. Inventories increased from
(including selling, general and administrative costs prior
$678.0 million at the beginning of 2003 to $832.4 million
to the acquisition of Dal-Tile) segments selling, general
at December 31, 2003, due primarily to building inventory
and administrative expenses reflected improvements
for hard surface product categories within the Mohawk
over 2001, when compared to 2002. The improvements
and Dal-Tile segments and the acquisition of Lees Carpet.
were due to better control of operating costs as net
The outstanding checks in excess of cash represent
sales increased.
trade payables checks that have not yet cleared the bank.
Operating income for 2002 was $522.1 million (11.5%
When the checks clear the bank, they are funded by the
of net sales) compared to $327.2 million (9.5% of net
revolving credit facility. This policy does not impact any
sales) in 2001. Operating income attributable to the
liquid assets on the consolidated balance sheets.
Mohawk segment was $390.9 million (10.8% of segment
Excluding acquisitions, capital expenditures totaled
net sales) in 2002 compared to $336.7 million (9.8% of
$114.6 million during 2003. The capital expenditures
segment net sales) in 2001. Operating income
made during 2003 were incurred primarily to modernize
attributable to the Dal-Tile segment was $139.9 million
and expand manufacturing facilities and equipment.
(15.6% of segment net sales) in 2002. On a pro forma
The Company’s capital projects are primarily focused on
combined basis, the Dal-Tile segment operating income
increasing capacity, improving productivity and reducing
was $171.7 million (15.1% of pro forma segment net
costs. Capital expenditures, including $1,101.8 million
sales) for 2002 (derived by combining Dal-Tile operating
for acquisitions, have totaled $1,381.2 million over the
income of $31.8 million prior to the March 20, 2002
past three years. The Company’s capital spending
acquisition, after reclassifications to conform to Mohawk’s
during 2004, excluding acquisitions, is expected to
presentation, with reported Dal-Tile operating income of
range from $140 million to $160 million, and will be
$139.9 million for the period ended December 31, 2002).
used primarily to purchase equipment to increase
This compares to Dal-Tile operating income of $154.6
production capacity and productivity.
million (14.9% of Dal-Tile net sales) for 2001. The
On September 30, 2003, the Company entered into a
Company believes that presentation of this pro forma
new revolving line of credit agreement providing up
combined operating income information will be useful
to $300 million with interest rates of either (i) LIBOR plus
to investors because it allows investors to compare the
0.4% to 1.5%, depending upon the Company’s performance
results between the two periods.
measured against certain financial ratios, or (ii) the base
9. M a n a g e m e n t ’s D i s c u s s i o n a n d A n a l y s i s o f F i n a n c i a l C o n d i t i o n a n d R e s u l t s o f O p e r a t i o n s 29
Mohawk Industries, Inc. + Subsidiaries
rate plus 0-0.6% depending upon the Company’s million of its registered 7.20% senior notes due 2012,
performance measured against certain financial ratios. Series D for an equal amount of its Series B senior notes.
The new facility replaces a $450 million facility that was Interest on each series is payable semiannually.
due to expire in January 2004. The facility is comprised of On August 4, 2003, the Company entered into an
two tranches, a $200 million tranche expiring in on-balance sheet trade accounts receivable securitization
September 2008 and a $100 million tranche expiring in agreement (“Securitization Facility”) replacing two previous
September 2004. The $100 million tranche of the facility facilities that were due to expire in October 2003. The
is renewable annually. The credit agreement contains Securitization Facility allows the Company to borrow up to
customary financial and other covenants. The Company $350 million based on available accounts receivable. The
must pay an annual facility fee ranging from .15% to Company sells, on a non-recourse revolving basis, its
.50% of the total credit commitment, depending upon accounts receivable to a special purpose entity, which in
the Company’s performance measured against specific turn obtains loan advances that are secured by the
coverage ratios, under the revolving credit line. Additionally, receivable pool from a third-party commercial paper
at December 31, 2003, the Company had credit facilities conduit sponsored by financial institutions. The
of $300 million under its revolving credit facility and $50 Securitization Facility is subject to annual renewal. At
million under various short-term uncommitted credit lines. December 31, 2003, the Company had approximately
At December 31, 2003, a total of $237.3 million was $182 million outstanding secured by approximately
unused under the combined revolving credit facility and $649.0 million of trade receivables.
uncommitted credit lines. The revolving credit facility and The Company’s Board of Directors has authorized the
uncommitted lines of credit are unsecured. repurchase of up to 15 million shares of its outstanding
In connection with the Dal-Tile acquisition during 2002, common stock. For the year ended December 31, 2003,
the Company entered into a 364-day term loan facility (the a total of approximately 593,000 shares of the Company’s
“Bridge Facility”) to finance a portion of the acquisition. common stock were purchased at an aggregate cost of
On April 2, 2002, the Company sold $300 million of its approximately $27.8 million. Since the inception of the
6.50% senior notes due 2007, Series A and $400 million program, a total of approximately 11 million shares have
of its 7.20% senior notes due 2012, Series B through been repurchased at an aggregate cost of approximately
institutional private placements and used the proceeds $293.1 million. All of these repurchases have been
to repay outstanding indebtedness of approximately financed through the Company’s operations and banking
$601 million under the Bridge Facility and approximately arrangements.
$90 million under the Company’s revolving credit facility. The Company believes that the combined total of the
On June 13, 2002, the Company exchanged $295 million of revolving credit facility, short-term uncommitted credit lines
its registered 6.50% senior notes due 2007, Series C for and the Securitization Facility of $700 million is adequate
an equal amount of its Series A senior notes and $397.8 to support its capital and working capital requirements.
The following is a summary of the Company’s future minimum payments under contractual obligations as of
December 31, 2003 (in thousands):
PAYMENTS DUE BY PERIOD
2004 2005 2006 2007 2008 THEREAFTER TOTAL
Long-term debt $248,795 9,445 6,500 300,000 – 447,673 1,012,413
Operating leases 72,857 57,202 44,517 31,183 22,602 45,363 273,724
Purchase commitments (1) 66,481 48,968 48,000 48,000 48,000 – 259,449
$388,133 115,615 99,017 379,183 70,602 493,036 1,545,586
(1) Includes commitments for natural gas and foreign currency and fiber purchases.
10. 30 M a n a g e m e n t ’s D i s c u s s i o n a n d A n a l y s i s o f F i n a n c i a l C o n d i t i o n a n d R e s u l t s o f O p e r a t i o n s
Mohawk Industries, Inc. + Subsidiaries
RECENT ACCOUNTING PRONOUNCEMENTS If any of the events described in these risks were
In January 2003, the Financial Accounting Standards to occur, it could have a material adverse effect on
Board (”FASB”) issued FASB Interpretation No. 46 the Company’s business, financial condition and results
(“FIN 46”), “Consolidation of Variable Interest Entities, of operations.
an Interpretation of ARB No. 51,” which addresses
consolidation by business enterprises of variable interest The floorcovering industry is cyclical and prolonged declines
entities (“VIEs”) either: (1) that do not have sufficient in residential or commercial construction activity could have
equity investment at risk to permit the entity to finance its a material adverse effect on the Company’s business.
activities without additional subordinated financial support, The U.S. floorcovering industry is highly dependent on
or (2) in which the equity investors lack an essential residential and commercial construction activity, including
characteristic of a controlling financial interest. In new construction as well as remodeling which are
December 2003, the FASB issued modifications to FIN 46 cyclical in nature. A prolonged decline in residential or
(“Revised Interpretations”) resulting in multiple effective commercial construction activity could have a material
dates based on the nature as well as the creation date of adverse effect on the Company’s business.
the VIE. VIEs created after January 31, 2003, but prior to The U.S. construction industry has experienced
January 1, 2004, may be accounted for either based on significant downturns in the past, which have adversely
the original interpretation or the Revised Interpretations. affected suppliers to the industry. The industry could
However, the Revised Interpretations must be applied experience similar downturns in the future, which could
no later than the first quarter of 2004. VIEs created after have a negative impact on the Company’s business.
January 1, 2004, must be accounted for under the
Revised Interpretations. Non-Special Purpose Entities The Company faces intense competition in its industry,
created prior to February 1, 2003, should be accounted for which could decrease demand for its products and could
under the revised interpretation’s provisions no later than have a material adverse effect on its profitability.
the first quarter of fiscal 2004. The Company has adopted The industry is highly competitive. The Company faces
FIN 46, which did not have, and does not expect the competition from a large number of manufacturers
Revised Interpretations to have, a material impact on and independent distributors. Some of its competitors
the Company’s consolidated financial statements. may be larger and have greater resources and access
to capital. Maintaining the Company’s competitive
I M PA C T O F I N F L AT I O N position may require substantial investments in its
Inflation affects the Company’s manufacturing costs product development efforts, manufacturing facilities,
and operating expenses. The carpet and tile industry distribution network and sales and marketing activities.
has experienced inflation in the prices of raw materials Competitive pressures may also result in decreased
and fuel-related costs. In the past, the Company has demand for its products. Any of these factors could
generally passed along these price increases to its have a material adverse effect on the Company.
customers and has been able to enhance productivity
to offset increases in costs resulting from inflation in A failure to identify suitable acquisition candidates, to
both the United States and Mexico. complete acquisitions and to integrate successfully
the acquired operations could have a material adverse
SEASONALITY effect on the Company’s business.
The Company is a calendar year-end company and its As part of its business strategy, the Company intends
results of operations for the first quarter tend to be to pursue acquisitions of complementary businesses.
the weakest. The second, third and fourth quarters Although it regularly evaluates acquisition opportunities,
typically produce higher net sales and operating it may not be able to; successfully identify suitable
income. These results are primarily due to consumer acquisition candidates; obtain sufficient financing on
residential spending patterns for floorcovering, which acceptable terms to fund acquisitions; complete
historically have decreased during the first two months acquisitions; or profitably manage acquired businesses.
of each year following the holiday season. Acquired operations may not achieve expected
performance levels and may involve a number of
C E RTA I N FA C T O R S A F F E C T I N G special risks, including among others an inability to
T H E C O M PA N Y ’ S P E R F O R M A N C E successfully integrate acquired operations and the
In addition to the other information provided in this diversion of management resources.
Annual Report, the following risk factors should be
considered when evaluating an investment in shares
of Common Stock.
11. M a n a g e m e n t ’s D i s c u s s i o n a n d A n a l y s i s o f F i n a n c i a l C o n d i t i o n a n d R e s u l t s o f O p e r a t i o n s 31
Mohawk Industries, Inc. + Subsidiaries
The Company may be unable to obtain raw materials Changes in international trade laws and in the business,
on a timely basis, which could have a material adverse political and regulatory environment in Mexico could have
effect on its business. a material adverse effect on the Company’s business.
The principal raw materials used in the Company’s The Company’s Monterrey, Mexico manufacturing facility
manufacturing operations include: nylon fiber and represents a significant portion of the Company’s total
polypropylene resin, which are used exclusively in its manufacturing capacity for ceramic tile. Accordingly, an
carpet and rug business; talc, clay, nepheline syenite event that has a material adverse impact on the Company’s
and various glazes, including frit (ground glass), zircon Mexican operations could have a material adverse effect
and stains, which are used exclusively in its ceramic on the tile operations as a whole. The business, regulatory
tile business and other materials. The Company has a and political environments in Mexico differ from those in
single source supplier for all of its nepheline syenite the United States, and the Company’s Mexican operations
requirements. An extended interruption in the supply of are exposed to legal, currency, tax, political and economic
these or other raw materials used in the Company’s risks, specific to Mexico.
business or in the supply of suitable substitute materials
would disrupt the Company’s operations, which could The Company could face increased competition as a result
have a material adverse effect on its business. of the General Agreement on Tariffs and Trade (”GATT“)
and the North American Free Trade Agreement (”NAFTA“).
The Company may be unable to pass on to its customers The Company is uncertain what effect reduced import
increases in the costs of raw materials and energy, which duties under GATT may have on its operations,
could have a material adverse effect on its profitability. although these reduced rates may stimulate additional
The prices of raw materials and natural gas vary with competition from manufacturers that export ceramic
market conditions. Although the Company generally tile to the United States.
attempts to pass on increases in the costs of raw Although NAFTA lowers the tariffs imposed on the
materials and natural gas to its customers, the Company’s Company’s ceramic tile manufactured in Mexico and sold
ability to do so is dependent upon the rate and in the United States and will eliminate such tariffs entirely
magnitude of any increase, competitive pressures and on January 1, 2008, it may also stimulate competition
market conditions for its products. There have been in in the United States and Canada from manufacturers
the past, and may be in the future, periods of time during located in Mexico.
which increases in these costs cannot be recovered.
During such periods of time, there could be a material F O RWA R D - L O O K I N G I N F O R M AT I O N
adverse effect on the Company’s profitability. Certain of the statements in this Annual Report,
particularly anticipating of future performance, business
The Company has been, and in the future may be subject prospects, growth and operating strategies, proposed
to claims and liabilities under environmental, health and acquisitions, and similar matters, and those that include
safety laws and regulations, which could be significant. the words “believes,” “anticipates,” “forecast,”
The Company’s operations are subject to various “estimates” or similar expressions constitute “forward-
environmental, health and safety laws and regulations, looking statements” within the meaning of Section 27A of
including those governing air emissions, wastewater the Securities Act of 1933, as amended and Section 21E
discharges, and the use, storage, treatment and disposal of the Securities and Exchange Act of 1934, as amended.
of hazardous materials. The applicable requirements under For those statements, Mohawk claims the protection of
these laws are subject to amendment, to the imposition the safe harbor for forward-looking statements contained
of new or additional requirements and to changing in the Private Securities Litigation Reform Act of 1995.
interpretations of agencies or courts. The Company could There can be no assurance that the forward-looking
incur material expenditures to comply with new or statements will be accurate because they are based on
existing regulations, including fines and penalties. many assumptions which involve risks and uncertainties.
The nature of the Company’s operations, including the The following important factors could cause future results
potential discovery of presently unknown environmental to differ: changes in industry conditions; competition; raw
conditions, exposes the Company to the risk of claims material prices; timing and level of capital expenditures;
under environmental, health and safety laws and integration of acquisitions; introduction of new products;
regulations. The Company could incur material costs or rationalization of operations; and other risks identified in
liabilities in connection with such claims. Mohawk’s SEC reports and public announcements.
12. 32 M a n a g e m e n t ’s D i s c u s s i o n a n d A n a l y s i s o f F i n a n c i a l C o n d i t i o n a n d R e s u l t s o f O p e r a t i o n s
Mohawk Industries, Inc. + Subsidiaries
Q U A N T I TAT I V E A N D Q U A L I TAT I V E F O R E I G N C U R R E N C Y R AT E M A N A G E M E N T
The Company enters into foreign exchange forward
DISCLOSURES ABOUT MARKET RISK
Financial exposures are managed as an integral part of contracts to hedge costs associated with its operations in
the Company’s risk management program, which seeks Mexico. The objective of these transactions is to reduce
to reduce the potentially adverse effect that the volatility volatility of exchange rates where these operations are
of the interest rate, exchange rate and natural gas located by fixing a portion of their costs in U.S. currency.
markets may have on its operating results. The Company Gains and losses are recognized in cost of goods sold in
does not regularly engage in speculative transactions, nor the same period or periods during which the hedged
does it regularly hold or issue financial instruments for transaction affects earnings. Accordingly, these
trading purposes. contracts have been designated as cash flow hedges.
The Company had forward contracts to purchase
approximately 145.3 million and 357.5 million Mexican
N AT U R A L G A S R I S K M A N A G E M E N T
The Company uses a combination of natural gas futures pesos at December 31, 2003 and 2002, respectively.
contracts and long-term supply agreements to manage The aggregate U.S. Dollar value of these contracts at
unanticipated changes in natural gas prices. The contracts December 31, 2003 and 2002 was approximately $12.7
are based on forecasted usage of natural gas measured million and $34.6 million, respectively. The contracts are
in Million British Thermal Units (“MMBTU”). marked to market in other current liabilities with the
The Company has designated the natural gas futures offset to other comprehensive income, net of applicable
contracts as cash flow hedges. The outstanding contracts income taxes. Unrealized losses at December 31, 2003
are valued at market with the offset going to other and 2002 respectively, were not significant.
comprehensive income, net of applicable income taxes
and any hedge ineffectiveness. Any gain or loss is I N T E R E S T R AT E M A N A G E M E N T
recognized in cost of goods sold in the same period or In 2002, the Company determined that its $100 million
periods during which the hedged transaction affects interest rate swap was ineffective. Consequently, the
earnings. At December 31, 2003, the Company had natural $10.7 million unrealized loss associated with the swap
gas contracts that mature from January 2004 to December was recorded as a realized loss in interest expense during
2004 with an aggregate notional amount of approximately the fourth quarter of 2002. The Company continues to
3.9 million MMBTU’s. The fair value of these contracts carry the liability on its consolidated balance sheets, and
was an asset of $3.6 million. At December 31, 2002, the the interest rate swap is marked to market at the end of
Company had natural gas contracts outstanding with a each reporting period. The change in fair value for the
notional amount of approximately 1.4 million MMBTU’s. year ended December 31, 2003, was not significant.
The fair value of these contracts was an asset of $1.9
million. The offset to these assets is recorded in other
$542
$1,359
comprehensive income, net of applicable income taxes.
$522
The Company’s natural gas long-term supply
agreements are accounted for under the normal $1,240
purchases provision within SFAS No. 133 and its
amendments. At December 31, 2003, the Company
has normal purchase commitments of approximately
3.1 million MMBTU’s for periods maturing from January
2004 through September 2005. The contracted value $327
of these commitments was approximately $13.8 million
and the fair value of these commitments was
approximately $17.0 million, at December 31, 2003. $833
At December 31, 2002, the Company had normal
purchase commitments of approximately 4.6 million
MMBTU’s. The contracted value of these commitments
was approximately $17.4 million and the fair value of
$400 $200
these commitments was approximately $19.7 million.
01 02 03 01 02 03
Gross Profit Operating Income
(In millions) (In millions)
13. Consolidated Statements of Earnings 33
Mohawk Industries, Inc. + Subsidiaries
2001
YEARS ENDED DECEMBER 31, 2003 2002
IN THOUSANDS, EXCEPT PER SHARE DATA
Net sales $5,005,053 4,522,336 3,445,945
Cost of sales 3,645,677 3,282,269 2,613,043
Gross profit 1,359,376 1,240,067 832,902
Selling, general and administrative expenses 817,347 718,002 505,745
Operating income 542,029 522,065 327,157
Other expense (income):
Interest expense 55,575 68,972 29,787
Other expense 6,252 13,455 7,780
Other income (8,232) (3,991) (1,826)
53,595 78,436 35,741
Earnings before income taxes 488,434 443,629 291,416
Income taxes 178,285 159,140 102,824
Net earnings $ 310,149 284,489 188,592
Basic earnings per share $ 4.68 4.46 3.60
Weighted-average common shares outstanding 66,251 63,723 52,418
Diluted earnings per share $ 4.62 4.39 3.55
Weighted-average common and dilutive
potential common shares outstanding 67,121 64,861 53,141
See accompanying notes to consolidated financial statements.
14. 34 Consolidated Balance Sheets
Mohawk Industries, Inc. + Subsidiaries
DECEMBER 31, 2003 2002
IN THOUSANDS, EXCEPT PER SHARE DATA
Assets
Current assets:
Receivables $ 573,500 501,129
Inventories 832,415 678,008
Prepaid expenses 43,043 37,368
Deferred income taxes 84,260 82,074
Total current assets 1,533,218 1,298,579
Property, plant and equipment, net 919,085 855,324
Goodwill 1,368,700 1,277,453
Other intangible assets 325,339 146,700
Other assets 17,233 18,687
$4,163,575 3,596,743
Liabilities and Stockholders’ Equity
Current liabilities:
Current portion of long-term debt $ 248,795 27,427
Accounts payable and accrued expenses 637,940 630,306
Total current liabilities 886,735 657,733
Deferred income taxes 183,669 145,973
Long-term debt, less current portion 763,618 793,000
Other long-term liabilities 31,752 17,158
Total liabilities 1,865,774 1,613,864
Stockholders’ equity:
Preferred stock, $.01 par value; 60 shares authorized; no shares issued – –
Common stock, $.01 par value; 150,000 shares authorized;
77,050 and 76,371 shares issued in 2003 and 2002, respectively 770 763
Additional paid-in capital 1,035,733 1,006,550
Retained earnings 1,541,761 1,231,612
Accumulated other comprehensive income 2,313 1,126
2,580,577 2,240,051
Less treasury stock at cost; 10,515 and
10,006 shares in 2003 and 2002, respectively 282,776 257,172
Total stockholders’ equity 2,297,801 1,982,879
Commitments and contingencies (Note 14)
$4,163,575 3,596,743
See accompanying notes to consolidated financial statements.
15. Consolidated Statements of Stockholders’ Equity and Comprehensive Income 35
Mohawk Industries, Inc. + Subsidiaries
ACCUMULATED
ADDITIONAL OTHER TOTAL
COMMON STOCK PAID-IN RETAINED COMPREHENSIVE TREASURY STOCKHOLDERS’
SHARES AMOUNT CAPITAL EARNINGS INCOME (LOSS) STOCK EQUITY
IN THOUSANDS
Balances at December 31, 2000 60,838 $608 183,303 758,531 – (188,082) 754,360
Stock options exercised 570 6 9,097 – – – 9,103
Purchase of treasury stock – – – – – (8,159) (8,159)
Grant to employee profit sharing plan – – – – – 2,500 2,500
Grant to executive incentive plan – – – – – 145 145
Tax benefit from exercise of stock options – – 4,847 – – – 4,847
Comprehensive Income:
Unrealized loss on hedge instruments
net of taxes – – – – (2,837) – (2,837)
Net earnings – – – 188,592 – – 188,592
Total Comprehensive Income 185,755
Balances at December 31, 2001 61,408 614 197,247 947,123 (2,837) (193,596) 948,551
Stock options exercised 2,056 20 50,165 – – – 50,185
Purchase of Dal-Tile 12,907 129 750,558 – – – 750,687
Purchase of treasury stock – – – – – (64,034) (64,034)
Grant to employee profit sharing plan – – 3,040 – – 282 3,322
Grant to executive incentive plan – – 77 – – 176 253
Tax benefit from exercise of stock options – – 5,463 – – – 5,463
Comprehensive Income:
Discontinued hedge on
interest rate swap – – – – 6,768 – 6,768
Unrealized loss on hedge instruments
net of taxes – – – – (2,805) – (2,805)
Net earnings – – – 284,489 – – 284,489
Total Comprehensive Income 288,452
Balances at December 31, 2002 76,371 763 1,006,550 1,231,612 1,126 (257,172) 1,982,879
Stock options exercised 679 7 18,283 – – – 18,290
Purchase of treasury stock – – – – – (27,839) (27,839)
Grant to employee profit sharing plan – – 2,080 – – 1,929 4,009
Grant to executive incentive plan – – 63 – – 306 369
Tax benefit from exercise of stock options – – 8,757 – – – 8,757
Comprehensive Income:
Currency translation adjustment – – – – 47 – 47
Unrealized gain on hedge instruments
net of taxes – – – – 1,140 – 1,140
Net earnings – – – 310,149 – – 310,149
Total Comprehensive Income 311,336
Balances at December 31, 2003 77,050 $770 1,035,733 1,541,761 2,313 (282,776) 2,297,801
See accompanying notes to consolidated financial statements.
16. 36 Consolidated Statements of Cash Flows
Mohawk Industries, Inc. + Subsidiaries
2001
YEARS ENDED DECEMBER 31, 2003 2002
IN THOUSANDS
Cash flows from operating activities:
Net earnings $ 310,149 284,489 188,592
Adjustments to reconcile net earnings to net cash
provided by operating activities:
Depreciation and amortization 106,615 101,942 84,167
Deferred income taxes 34,775 33,712 5,563
Tax benefit on stock options exercised 8,757 5,463 4,847
Loss on sale of property, plant and equipment 3,267 2,762 2,910
Changes in assets and liabilities,
net of effects of acquisitions:
Receivables (47,443) 34,657 (46,066)
Inventories (104,964) (15,215) 43,190
Accounts payable and accrued expenses (2,769) 105,464 48,754
Other assets and prepaid expenses (5,592) (13,111) (811)
Other liabilities 6,595 9,347 101
Net cash provided by operating activities 309,390 549,510 331,247
Cash flows from investing activities:
Additions to property, plant and equipment (114,631) (111,934) (52,913)
Acquisitions (384,121) (717,638) –
Net cash used in investing activities (498,752) (829,572) (52,913)
Cash flows from financing activities:
Net change in revolving line of credit 37,299 (29,491) (181,964)
Proceeds from issuance of senior notes – 700,000 –
Proceeds from bridge credit facility – 600,000 –
Repayment of bridge credit facility – (600,000) –
Net change in asset securitizations 182,000 (125,000) (66,104)
Payments on term loans (26,492) (32,208) (32,212)
Redemption of acquisition indebtedness – (202,564) –
Industrial revenue bonds and other, net of payments (821) (1,307) (1,115)
Change in outstanding checks in excess of cash 6,925 (15,519) 2,117
Acquisition of treasury stock (27,839) (64,034) (8,159)
Common stock transactions 18,290 50,185 9,103
Net cash provided by (used in)
financing activities 189,362 280,062 (278,334)
Net change in cash – – –
Cash, beginning of year – – –
Cash, end of year $ – – –
See accompanying notes to consolidated financial statements.
17. Notes to Consolidated Financial Statements 37
December 31, 2003, 2002, and 2001 (in thousands, except per share data)
Mohawk Industries, Inc. + Subsidiaries
NOTE 1. SUMMARY OF SIGNIFICANT ACCOUNTING POLICIES (e) Goodwill and Other Intangible Assets
In accordance with the provisions of Statement of Financial
(a) Basis of Presentation Accounting Standards (“SFAS”) No. 142, “Goodwill and
The consolidated financial statements include the Other Intagible Assets” the Company tests goodwill and
accounts of Mohawk Industries, Inc. and its subsidiaries other intangible assets with indefinite lives for impairment
(the “Company” or “Mohawk”). All significant on an annual basis (or on an interim basis if an event occurs
intercompany balances and transactions have been that might reduce the fair value of the reporting unit below
eliminated in consolidation. its carrying value). The Company conducts testing for
The preparation of financial statements in conformity impairment during the fourth quarter of its fiscal year.
with accounting principles generally accepted in the Intangible assets that do not have indefinite lives are
United States of America requires management to make amortized based on weighted average lives.
estimates and assumptions that affect the reported
amounts of assets and liabilities and disclosure of (f) Income Taxes
contingent assets and liabilities at the date of the Income taxes are accounted for under the asset and
financial statements and the reported amounts of liability method. Deferred tax assets and liabilities are
revenues and expenses during the reporting period. recognized for the future tax consequences attributable
Actual results could differ from those estimates. to differences between the financial statement carrying
amounts of existing assets and liabilities and their
(b) Accounts Receivable and Revenue Recognition respective tax bases and operating loss and tax credit
The Company is principally a broadloom carpet, rug and carry-forwards. Deferred tax assets and liabilities are
ceramic tile manufacturer and sells carpet, rugs, ceramic measured using enacted tax rates expected to apply to
tile and other floorcovering materials throughout the United taxable income in the years in which those temporary
States principally for residential and commercial use. differences are expected to be recovered or settled.
The Company grants credit to customers, most of whom The effect on deferred tax assets and liabilities of a
are retail-flooring dealers and commercial end users, change in tax rates is recognized in income in the
under credit terms that are customary in the industry. period that includes the enactment date.
Revenues are recognized when goods are shipped,
which is when the legal title passes to the customer. (g) Financial Instruments
The Company provides allowances for expected cash The Company’s financial instruments consist primarily of
discounts, returns, claims and doubtful accounts based receivables, accounts payable, accrued expenses and
upon historical bad debt and claims experience and periodic long-term debt. The carrying amount of receivables,
evaluations of specific customer accounts and the aging accounts payable and accrued expenses approximates
of the accounts receivable. their fair value because of the short-term maturity of such
instruments. Interest rates that are currently available to
(c) Inventories the Company for issuance of long-term debt with similar
Inventories are stated at the lower of cost or market terms and remaining maturities are used to estimate
(net realizable value). Cost is determined using the last-in, the fair value of the Company’s long-term debt. The
first-out (LIFO) method, which matches current costs estimated fair value of the Company’s long-term debt at
with current revenues, for substantially all inventories December 31, 2003, and 2002 was $1,095,590 and
within the Mohawk segment and the first-in, first-out $894,462, compared to a carrying amount of $1,012,413
(FIFO) method for the Dal-Tile segment inventories. and $820,427, respectively.
(d) Property, Plant and Equipment (h) Derivative Instruments
Property, plant and equipment are stated at cost, including Effective January 1, 2001, the Company adopted SFAS No.
capitalized interest. Depreciation is calculated on a 133 “Accounting for Derivative Instruments and Hedging
straight-line basis over the estimated remaining useful Activities” (“SFAS No.133”) and its amendments which
lives, which are 35 years for buildings and improvements, require the Company to recognize all derivatives on the
15 years for extrusion equipment, 10 years for tufting consolidated balance sheet at fair value. Derivatives that are
equipment, the shorter of the estimated useful life or life not hedges must be adjusted to fair value through earnings.
of the lease for leasehold improvements, five years for If the derivative is a hedge, depending on the nature of
vehicles and seven years for other equipment, and the hedge, changes in its fair value are either offset
furniture and fixtures. against the change in fair value of assets, liabilities, or firm
commitments through earnings or recognized in other