More Related Content Similar to .energyfutureholdings txufinancials1q01 Similar to .energyfutureholdings txufinancials1q01 (20) 1. TXU CORP. AND SUBSIDIARIES
FINANCIAL AND OPERATING REPORT
For the Periods Ended March 31, 2001
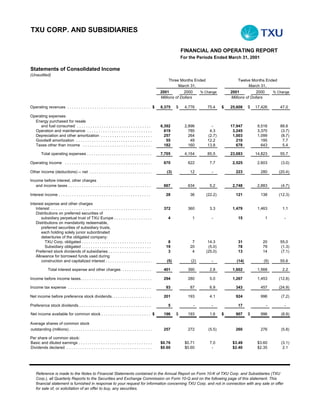
Statements of Consolidated Income
(Unaudited)
Three Months Ended Twelve Months Ended
March 31, March 31,
2001 2000 2001 2000
% Change % Change
Millions of Dollars Millions of Dollars
Operating revenues . . . . . . . . . . . . . . . . . . . . . . . . . . . . . . . . . . . . . . $ . . .8,375
. . $ 4,776 75.4 $ 25,608 $ 17,426 47.0
Operating expenses
Energy purchased for resale
and fuel consumed . . . . . . . . . . . . . . . . . . . . . . . . . . . . . . . . . . . . . 6,392 2,896 - 17,947 9,516 88.6
Operation and maintenance . . . . . . . . . . . . . . . . . . . . . . . . . . . . . . . . . . 819 ... 785 4.3 3,245 3,370 (3.7)
Depreciation and other amortization . . . . . . . . . . . . . . . . . . . . . . . . . . . 257 264 (2.7) 1,003 1,099 (8.7)
Goodwill amortization . . . . . . . . . . . . . . . . . . . . . . . . . . . . . . . . . . . . . . . . 55 .
.. 49 12.2 210 195 7.7
Taxes other than income . . . . . . . . . . . . . . . . . . . . . . . . . . . . . . . . . . . . 182 .. 160 13.8 678 643 5.4
Total operating expenses . . . . . . . . . . . . . . . . . . . . . . . . . . . . . . . . . 7,705 4,154 85.5 23,083 14,823 55.7
Operating income . . . . . . . . . . . . . . . . . . . . . . . . . . . . . . . . . . . . . . . . . . . . 670
. 622 7.7 2,525 2,603 (3.0)
Other income (deductions) -- net . . . . . . . . . . . . . . . . . . . . . . . . . . . . . . . . . . (3) 12 - 223 280 (20.4)
Income before interest, other charges
and income taxes . . . . . . . . . . . . . . . . . . . . . . . . . . . . . . . . . . . . . . . . 667 634 5.2 2,748 2,883 (4.7)
Interest income . . . . . . . . . . . . . . . . . . . . . . . . . . . . . . . . . . . . . . . . . . . . . . . . 28
. 36 (22.2) 121 138 (12.3)
Interest expense and other charges
Interest . . . . . . . . . . . . . . . . . . . . . . . . . . . . . . . . . . . . . . . . . . . . . . . . . . 372 .
... 360 3.3 1,479 1,463 1.1
Distributions on preferred securities of
subsidiary perpetual trust of TXU Europe . . . . . . . . . . . . . . . . . . . . . . . . 4. . . . . . . . . . 1 .
. . - 15 1 -
Distributions on mandatorily redeemable,
preferred securities of subsidiary trusts,
each holding solely junior subordinated
debentures of the obligated company:
TXU Corp. obligated . . . . . . . . . . . . . . . . . . . . . . . . . . . . . . . . . . . . . 8 7 14.3 31 20 55.0
Subsidiary obligated . . . . . . . . . . . . . . . . . . . . . . . . . . . . . . . . . . . . . 19 20 (5.0) 78 79 (1.3)
Preferred stock dividends of subsidiaries . . . . . . . . . . . . . . . . . . . . . . . . . . .3 . . . 4 (25.0) 13 14 (7.1)
Allowance for borrowed funds used during
construction and capitalized interest . . . . . . . . . . . . . . . . . . . . . . . . . . . .(5). . . . . . . . . (2). .
. .. - (14) (9) 55.6
Total interest expense and other charges . . . . . . . . . . . . . . . . . . .401. . . . . . . . . .
.. 390 2.8 1,602 1,568 2.2
Income before income taxes. . . . . . . . . . . . . . . . . . . . . . . . . . . . . . . . . . . . 294 280 5.0 1,267 1,453 (12.8)
Income tax expense . . . . . . . . . . . . . . . . . . . . . . . . . . . . . . . . . . . . . . . . . . . .93. . . . . . .
. 87 6.9 343 457 (24.9)
Net income before preference stock dividends. . . . . . . . . . . . . . . . . . . . . . . .201. . . . . . . . 193 . . . . . . . 4.1
.. ... 924 996 (7.2)
Preference stock dividends . . . . . . . . . . . . . . . . . . . . . . . . . . . . . . . . . . . . . . . .5 . . .
. - - 17 - -
Net income available for common stock . . . . . . . . . . . . . . . . . . . . . . .$ . . . . 196 . . . . . . . .193. . . . . . . 1.6
. ... $ .. $ 907 $ 996 (8.9)
Average shares of common stock
outstanding (millions) . . . . . . . . . . . . . . . . . . . . . . . . . . . . . . . . . . . . . . . . . . 257 272 (5.5) 260 276 (5.8)
Per share of common stock:
Basic and diluted earnings . . . . . . . . . . . . . . . . . . . . . . . . . . . . . . . . . . . . .$0.76
... $0.71 7.0 $3.49 $3.60 (3.1)
Dividends declared . . . . . . . . . . . . . . . . . . . . . . . . . . . . . . . . . . . . . . . . . .$0.60 . . . . . . .$0.60
.... - $2.40 $2.35 2.1
Reference is made to the Notes to Financial Statements contained in the Annual Report on Form 10-K of TXU Corp. and Subsidiaries (TXU
Corp.), all Quarterly Reports to the Securities and Exchange Commission on Form 10-Q and on the following page of this statement. This
financial statement is furnished in response to your request for information concerning TXU Corp. and not in connection with any sale or offer
for sale of, or solicitation of an offer to buy, any securities.
2. TXU CORP. AND SUBSIDIARIES
Condensed Statements of Consolidated Cash Flows
(Unaudited)
Twelve Months Ended
March 31,
2001 2000
Millions of Dollars
CASH FLOWS - OPERATING ACTIVITIES
Net income . . . . . . . . . . . . . . . . . . . . . . . . . . . . . . . . . . . . . . . . . . . . . . . . . . . . . . . . . . . . . . . . . .$ . . . . . . . .924
. . $ 996
Adjustments to reconcile net income to cash provided by operating activities:
Depreciation and amortization. . . . . . . . . . . . . . . . . . . . . . . . . . . . . . . . . . . . . . . . . . . . . ....... . . . . 1,410 1,461
Deferred income taxes and investment tax credits -- net . . . . . . . . . . . . . . . . . . . . . . . . . . . . . . . . . . . . . .197. . . . . . . . . . . .135. . . . . . . . . .
.. ..
Gains from the sale of assets . . . . . . . . . . . . . . . . . . . . . . . . . . . . . . . . . . . . . . . . . . . . . . . . . . . (225) (264)
Reduction of revenues for earnings in excess of earnings cap . . . . . . . . . . . . . . . . . . . . . . . . . . . . . . . . . .325 . . . ... 92
Other . . . . . . . . . . . . . . . . . . . . . . . . . . . . . . . . . . . . . . . . . . . . . . . . . . . . . . . . . . . . . . . . . . . . . . 63 11
Changes in operating assets and liabilities . . . . . . . . . . . . . . . . . . . . . . . . . . . . . . . . . . . .. .. .. . . . . . . . . (1,285) . . . . . . .
...... 24
Cash provided by operating activities . . . . . . . . . . . . . . . . . . . . . . . . . . . . . . . . . . . . . . . . . . . . . . . . . 1,409
... 2,455
CASH FLOWS - FINANCING ACTIVITIES
Issuances of securities:
Other long-term debt . . . . . . . . . . . . . . . . . . . . . . . . . . . . . . . . . . . . . . . . . . . . . . . . . . . . .. .. .. . . . . . . . .3,088 . . . . . . . . . 3,600
....
Preferred securities of subsidiary perpetual trust of TXU Europe . . . . . . . . . . . . . . . . . . . .. .. .. . . . . . . . - 150
Company obligated, mandatorily redeemable preferred securities of Company
trust, holding solely junior subordinated debentures of the Company . . . . . . . . . - 150
Preference stock . . . . . . . . . . . . . . . . . . . . . . . . . . . . . . . . . . . . . . . . . . . . . . . . . . . . . . . . .. . . 300 -
Common stock . . . . . . . . . . . . . . . . . . . . . . . . . . . . . . . . . . . . . . . . . . . . . . . . . . . . . . . . . . . . . . . . . . . . . . 6 1
Retirements/repurchases of securities:
Other long-term debt/obligations . . . . . . . . . . . . . . . . . . . . . . . . . . . . . . . . . . . . . . . . . . . .. .. .. . . . . . . . . . . . . . . . . . . . . (2,448)
(2,680)
Common stock . . . . . . . . . . . . . . . . . . . . . . . . . . . . . . . . . . . . . . . . . . . . . . . . . . . . . . . . . . . . . . . . . . . . . (182)
. (665)
Change in notes payable . . . . . . . . . . . . . . . . . . . . . . . . . . . . . . . . . . . . . . . . . . . . . . . . . . . . . . . . . . . . . . . . . .50. . .
. (746)
Cash dividends paid:
Common stock . . . . . . . . . . . . . . . . . . . . . . . . . . . . . . . . . . . . . . . . . . . . . . . . . . . . . . . . . . . . . . . . . . . . . (626)
. (658)
Preference stock . . . . . . . . . . . . . . . . . . . . . . . . . . . . . . . . . . . . . . . . . . . . . . . . . . . . . . . . .. . . (17) -
Debt premium, discount, financing and reacquisition expenses . . . . . . . . . . . . . . . . . . . . . . . .. .. .. . . . . . . . . . . (27) . . . . . . ... (82)
Cash used in financing activities . . . . . . . . . . . . . . . . . . . . . . . . . . . . . . . . . . . . . . . . . . . . . . . . . . . . . . (88). . . . . . . .
... (698)
CASH FLOWS - INVESTING ACTIVITIES
Construction expenditures . . . . . . . . . . . . . . . . . . . . . . . . . . . . . . . . . . . . . . . . . . . . . . . . . . .. .. .. . . . . . . . . (1,424). . . . . . . . . (1,624)
..... .....
Acquisitions of businesses. . . . . . . . . . . . . . . . . . . . . . . . . . . . . . . . . . . . . . . . . . . . . . . . . . . . . . . . . . . . . .(1,026). . . . . . . .
..... -
Proceeds from sale of assets . . . . . . . . . . . . . . . . . . . . . . . . . . . . . . . . . . . . . . . . . . . . . . . . . . . 591 468
Cash distribution from equity investee . . . . . . . . . . . . . . . . . . . . . . . . . . . . . . . . . . . . . . . . . . . . . . . . 599 -
Nuclear fuel . . . . . . . . . . . . . . . . . . . . . . . . . . . . . . . . . . . . . . . . . . . . . . . . . . . . . . . . . . . . . . . . . . . . . . (98) (35)
Other . . . . . . . . . . . . . . . . . . . . . . . . . . . . . . . . . . . . . . . . . . . . . . . . . . . . . . . . . . . . . . . . . . . . . . . . . . . . . . . (395) . . . . . . . . . . (434)
.... .
Cash used in investing activities . . . . . . . . . . . . . . . . . . . . . . . . . . . . . . . . . . . . . . . . . . . . . . . . . . . . . (1,753). . . . . . . . . (1,625)
.....
EFFECT OF EXCHANGE RATES ON CASH AND CASH EQUIVALENTS . . . . . . . . . . . . . . . . .. .. .. . . . . . . . . . .(33) . . . . . . . . . . . (52) . . . . . . . . . . . . . .
... ...
NET CHANGE IN CASH AND CASH EQUIVALENTS . . . . . . . . . . . . . . . . . . . . . . . . . . . . . . . . . . . . . . . . . . . (465). . . . . . . . . . . .80
.... .
CASH AND CASH EQUIVALENTS -- BEGINNING BALANCE . . . . . . . . . . . . . . . . . . . . . . . . . . . . . . . . . . . . .830 . . . . . . . . . . . 750
... ..
CASH AND CASH EQUIVALENTS -- ENDING BALANCE . . . . . . . . . . . . . . . . . . . . . . . . . . . . . . . $ . . . . . . . .365 . . . . . .$. . . . . 830 . . . .
. ... ...
3. TXU CORP. AND SUBSIDIARIES
Condensed Consolidated Balance Sheets
(Unaudited)
March 31,
2001 2000
ASSETS Millions of Dollars
Current assets. . . . . . . . . . . . . . . . . . . . . . . . . . . . . . . . . . . . . . . . . . . . . . . . . . . . . . . . . . . . . . . . . . . . . . . . . .$. . . . . . 5,048. . . . . .$ . . . . . 3,733 .
.... . ....
Investments. . . . . . . . . . . . . . . . . . . . . . . . . . . . . . . . . . . . . . . . . . . . . . . . . . . . . . . . . . . . . . . . . . . . . . . . . . . . . . . . . . . . . . . . . . . . . . . . . . 2,919. . . .
3,003 ....
Property, plant and equipment:
United States (US):
Property, plant and equipment . . . . . . . . . . . . . . . . . . . . . . . . . . . . . . . . . . . . . . . . . . . . . . . . . . . . . . . . . . . . . . . . . . . . . .
26,488 26,155
Less accumulated depreciation . . . . . . . . . . . . . . . . . . . . . . . . . . . . . . . . . . . . . . . . . . . . . . . . . . . . . . . . . . . . . . .8,920 .... 8,361
Net of accumulated depreciation . . . . . . . . . . . . . . . . . . . . . . . . . . . . . . . . . . . . . . . . . . . . . . . . . . . . . . . . . .17,568 . ..... 17,794
Construction work in progress . . . . . . . . . . . . . . . . . . . . . . . . . . . . . . . . . . . . . . . . . . . . . . . . . . . . . . . . . . . . . . . . . .528 . 350
Nuclear fuel (net of accumulated amortization) . . . . . . . . . . . . . . . . . . . . . . . . . . . . . . . . . . . . . . . . . . . . . . . . . . . . . . . . . . . . . 172 150
Held for future use . . . . . . . . . . . . . . . . . . . . . . . . . . . . . . . . . . . . . . . . . . . . . . . . . . . . . . . . . . . . . . . . . . . . . . . . . . . . 22 22
Reserve for regulatory disallowances . . . . . . . . . . . . . . . . . . . . . . . . . . . . . . . . . . . . . . . . . . . . . . . . . . . . . . . . . . . . (836) . . .... (836)
Net US property, plant and equipment . . . . . . . . . . . . . . . . . . . . . . . . . . . . . . . . . . . . . . . . . . . . . . . . . . . . . . 17,454 .... 17,480
Europe (net of accumulated depreciation) . . . . . . . . . . . . . . . . . . . . . . . . . . . . . . . . . . . . . . . . . . . . . . . . . . . . . . . . . . . . . . . . . . . . . .
4,062 4,319
Australia (net of accumulated depreciation) . . . . . . . . . . . . . . . . . . . . . . . . . . . . . . . . . . . . . . . . . . . . . . . . . . . . . . . . 1,515. . . . . . . . . . . . 1,634. . .
.... ....
Net property, plant and equipment . . . . . . . . . . . . . . . . . . . . . . . . . . . . . . . . . . . . . . . . . . . . . . . . . . . . . . . . .23,031 . . . . . . . . . . .23,433 . . . .
..... .....
Goodwill (net of accumulated amortization) . . . . . . . . . . . . . . . . . . . . . . . . . . . . . . . . . . . . . . . . . . . . . . . . . . . . . . . . . . 7,196. . . . . . . . . . . . 7,346. . . . . .
.... ....
Other assets. . . . . . . . . . . . . . . . . . . . . . . . . . . . . . . . . . . . . . . . . . . . . . . . . . . . . . . . . . . . . . . . . . . . . . . . . . . . . . . . . . 4,741. . . . .
.... 2,860
Total Assets. . . . . . . . . . . . . . . . . . . . . . . . . . . . . . . . . . . . . . . . . . . . . . . . . . . . . . . . . . . . . . . . . . . . .$ . . . . 43,019. . . . . . $
. ..... 40,291
LIABILITIES AND SHAREHOLDERS' EQUITY
Current liabilities:
Notes payable. . . . . . . . . . . . . . . . . . . . . . . . . . . . . . . . . . . . . . . . . . . . . . . . . . . . . . . . . . . . . . . . . . . . . . .$ . . . . . 3,228. . .
. .... $ 3,406
Long-term debt due currently. . . . . . . . . . . . . . . . . . . . . . . . . . . . . . . . . . . . . . . . . . . . . . . . . . . . . . . . . . . . . . . . . .3,110 . . .
.... 1,089
Other . . . . . . . . . . . . . . . . . . . . . . . . . . . . . . . . . . . . . . . . . . . . . . . . . . . . . . . . . . . . . . . . . . . . . . . . . . . 5,068 3,744
Total current liabilities. . . . . . . . . . . . . . . . . . . . . . . . . . . . . . . . . . . . . . . . . . . . . . . . . . . . . . . . . . . . . . . . . . . 11,406. . . . .
..... 8,239
Long-term debt, less amounts due currently. . . . . . . . . . . . . . . . . . . . . . . . . . . . . . . . . . . . . . . . . . . . . . . . . . . . . . . . . 14,538. . . . . . .
..... 16,302
Accumulated deferred income taxes. . . . . . . . . . . . . . . . . . . . . . . . . . . . . . . . . . . . . . . . . . . . . . . . . . . . . . . . . . . . . . 3,946 3,944
Investment tax credits. . . . . . . . . . . . . . . . . . . . . . . . . . . . . . . . . . . . . . . . . . . . . . . . . . . . . . . . . . . . . . . . . . . . . . . . . 496 518
Other deferred credits and noncurrent liabilities. . . . . . . . . . . . . . . . . . . . . . . . . . . . . . . . . . . . . . . . . . . . . . . . . . . . . . . . . . . . . . . . . .
3,283 1,653
Total liabilities. . . . . . . . . . . . . . . . . . . . . . . . . . . . . . . . . . . . . . . . . . . . . . . . . . . . . . . . . . . . . . . . . . . . . . . . . 33,669. . . . . . . .
..... 30,656
Mandatorily redeemable, preferred securities of subsidiary trusts, each holding solely junior
subordinated debentures of the obligated company:
TXU obligated. . . . . . . . . . . . . . . . . . . . . . . . . . . . . . . . . . . . . . . . . . . . . . . . . . . . . . . . . . . . . . . . . . . . . . . . . . . . . . .368 . . .
... 368
Subsidiary obligated. . . . . . . . . . . . . . . . . . . . . . . . . . . . . . . . . . . . . . . . . . . . . . . . . . . . . . . . . . . . . . . . . . . . . . . . . . 976 . . . . .
... 976
Preferred securities of subsidiary perpetual trust of TXU Europe. . . . . . . . . . . . . . . . . . . . . . . . . . . . . . . . . . . . . . . . . . . . 150 . . . . . ... 150
Preferred stock of subsidiaries:
Not subject to mandatory redemption. . . . . . . . . . . . . . . . . . . . . . . . . . . . . . . . . . . . . . . . . . . . . . . . . . . . . . . . . . . . . . .190 . . . ... 190
Subject to mandatory redemption. . . . . . . . . . . . . . . . . . . . . . . . . . . . . . . . . . . . . . . . . . . . . . . . . . . . . . . . . . . . . . . . . . 21 . . . . .. 21
Common stock repurchasable under equity forward contracts, at settlement value . . . . . . . . . . . . . . . . . . . . . . 146 -
Shareholders' equity
Preference stock. . . . . . . . . . . . . . . . . . . . . . . . . . . . . . . . . . . . . . . . . . . . . . . . . . . . . . . . . . . . . . . . . . . . . . . . . 300 -
Common stock without par value. . . . . . . . . . . . . . . . . . . . . . . . . . . . . . . . . . . . . . . . . . . . . . . . . . . . . . . . . . . . . . . 6,218 6,481
Retained earnings. . . . . . . . . . . . . . . . . . . . . . . . . . . . . . . . . . . . . . . . . . . . . . . . . . . . . . . . . . . . . . . . . . . . . . . . . . . . 1,863 1,629
Accumulated other comprehensive income. . . . . . . . . . . . . . . . . . . . . . . . . . . . . . . . . . . . . . . . . . . . . . . . . . . . . . . . . .(882) . .... (180)
Total shareholders' equity. . . . . . . . . . . . . . . . . . . . . . . . . . . . . . . . . . . . . . . . . . . . . . . . . . . . . . . . . . . . . . . . . . . . 7,499 7,930
Total Liabilities and Shareholders' Equity. . . . . . . . . . . . . . . . . . . . . . . . . . . . . . . . . . . . . . . . . . . . . . .$ . . . . 43,019. . . . . . $ . .
. ..... . 40,291
4. TXU CORP. AND SUBSIDIARIES
Operating and Financial Statistics
Periods Ended March 31, 2001 and 2000
Three Months Twelve Months
Operating statistics 2001 2000 % Change 2001 2000 % Change
Sales volumes
Electric (gigawatt-hours):
Residential . . . . . . . . . . . . . . . . . . . . . . . . . . . . . . . .. .. .. . . . . 16,843. . . . . .12,685 . . . . . . . .32.8. . . . . . . . .62,846 . . . . . . 54,384. .
..... ..... ... ..... ..... 15.6
Commercial and industrial . . . . . . . . . . . . . . . . . . . . . . . . . . .21,519 . . . . . 18,386. . . . . . . . 17.0. . . .
..... ..... ... 93,097 83,408 11.6
Other electric utilities. . . . . . . . . . . . . . . . . . . . . . . ....... . . . . . . . . . . . . . . . . . 978 . . . . . . . (61.0). . . . . . . . . 2,651. . . . . . . .3,391 . . . . . . . . . . . . . . . . . . . . . .
381 ... .... .... .... (21.8)
Total electric . . . . . . . . . . . . . . . . . . . . . . . . . .. .. .. . . . . . 38,743. . . . . . . . . . . . . . . . . . .20.9 . . . . . . . 158,594. . . . . .141,183
..... 32,049 ... ...... ..... 12.3
Gas (billion cubic feet):
Residential . . . . . . . . . . . . . . . . . . . . . . . . . . . . . . .. .. .. . . . . . . . . 89 . . . . . . . . .52. . . . . . . . . . . . . . . . . . . . . . . . . . . . . . . . . . 140 . . . .
.. . 71.2 199 ... 42.1
Commercial and industrial . . . . . . . . . . . . . . . . . . . . . . . . . . . . . . 62 . . . . . . . . .49. . . . . . . . 26.5. .
.. . ... 172 153 12.4
Pipeline transportation (billion cubic feet) . . . . . . . . . . . . . . . . . . . 158 . . . . . . . .141. . . . . . . . 12.1 .
... .. .... 618 552 12.0
US energy trading and marketing:
Gas (billion cubic feet) . . . . . . . . . . . . . . . . . . . . . . . . . . . . . . . .272 . . . . . . . . . . . . . . . . . . . . . . . . . . . . . . .1,194 . . . . . . . 1,071. . . . . . . . . . . . . . . . . . . . . . . . . .
... 320 (15.0) .... .... 11.5
Electric (gigawatt-hours) . . . . . . . . . . . . . . . . . . . . .. .. .. . . . . . . 5,359. . . . . . . . . . . . . . . . . . .44.7 . . . . . . . . 23,572. . . . . . . .9,191 . . . .
.... 3,704 ... ..... .... -
UK wholesale energy sales:
Gas (billion cubic feet) . . . . . . . . . . . . . . . . . . . . . . . . . . . . . . . . 379 . . . . . . . . . . . . . . . . .
... 186 - 1,193 520 -
Electric (gigawatt-hours) . . . . . . . . . . . . . . . . . . . . .. .. .. . . . . . 43,750. . . . . . . . . . . . . . . . . . .79.0 . . . . . . . 119,447. . . . . . .79,320 . . . . . . . . 50.6
..... 24,435 ... ...... ..... ..
Customers (end of period & in thousands)
Electric . . . . . . . . . . . . . . . . . . . . . . . . . . . . . . . . . .. .. .. . . . . . . . . . . . . . . . . . . . . . . 7,694 5,974 28.8
Gas . . . . . . . . . . . . . . . . . . . . . . . . . . . . . . . . . . . . .. .. .. . . . . . . . . . . . . . . . . . . . . . . . . . . . . . . . . . . . . . . . . . 3,089. . . . . . . . . . . . . .
.... 2,583 19.6
Operating revenues (millions of dollars)
Electric:
Residential . . . . . . . . . . . . . . . . . . . . . . . . . . . . . .. .. .. . $ . . . .1,107 . .$ . . . . .867. . .
. .... . .. 27.7 $ 4,216 $ 3,868 9.0
Commercial and industrial. . . . . . . . . . . . . . . . . . . . .. .. .. . . . . . . .898. . . . . . . . 813 . . . . . . . .10.5 .
.. ... ... 3,870 3,651 6.0
Other electric utilities . . . . . . . . . . . . . . . . . . . . . . . .. .. .. . . . . . . . .12. . . . . . . . . 29
. .. (58.6) 109 113 (3.5)
US fuel (including over/under-recovered) . . . . . . . .. .. .. . . . . . . .780. . . . . . . . 354 . .
.. ... - 3,182 1,709 86.2
Transmission service . . . . . . . . . . . . . . . . . . . . . . . . . . . . . . . . . .44 . . . . . . . . 43 . .
.. .. 2.3 170 157 8.3
Other . . . . . . . . . . . . . . . . . . . . . . . . . . . . . . . . . . . . . . . . . . . . . 161 . . . . . . . .204. . . .
... .. (21.1) 582 728 (20.1)
Subtotal . . . . . . . . . . . . . . . . . . . . . . . . . . . . . . . .. .. .. . . . . 3,002 2,310 30.0 12,129 10,226 18.6
Earnings in excess of earnings cap . . . . . . . . . . . . .. .. .. . (14) - - (324) (92) -
Total electric . . . . . . . . . . . . . . . . . . . . . . . . . . . . .. .. .. . . . . . 2,988. . . . . . .2,310
.... .... 29.4 11,805 10,134 16.5
Gas:
Residential . .. . . . . . . . . . . . . . . . . . . . . . . . . . . . .. .. .. . . . . . . . 611 . . . . . . . .303. . .
... .. - 1,331 828 60.7
Commercial and industrial . . . . . . . . . . . . . . . . . . . . . . . . . . . . . 351 . . . . . . . .185. . . . . . . . 89.7. . . . . . . . . . . 803 . . . . . . . . .530 . . . . .
... .. ... ... ... 51.5
Subtotal . . . . . . . . . . . . . . . . . . . . . . . . . . . . . . . .. .. .. . . . . . . . 962 . . . . . . . .488. . . . . . . . . . . . . . . . . . . . . 2,134. . . . . . 1,358
... .. 97.1 .... 57.1
Pipeline transportation . . . . . . . . . . . . . . . . . . . . . . . . .. .. .. . . . . . . . . 38 . . . . . . . . .35
.. .. 8.6 126 113 11.5
US energy trading and marketing . . . . . . . . . . . . . . . . . . . . . . . . .2,270 . . . . . . 1,019. . . . . . . . . . -. . . .
.... .... 6,674 3,202 -
UK wholesale energy sales . . . . . . . . . . . . . . . . . . . . . .. .. . . . . 1,823 844 - 4,302 2,305 86.6
Other revenues, net of intercompany eliminations . . . .. .. .. . . . . . . . 294 . . . . . . . . .80 . . . . . . . . . . . . . . . . . . . . . .567. . . . . . . . . 314
... .. - .. 80.6
... $ 8,375 $ 4,776 75.4 $ 25,608 $ 17,426 47.0
Financial statistics - MARCH 2001
Common stock data:
Shares outstanding - end of period (millions) . . . . . . . . . . . . . . . . . . . . . . . . . . . . . . . . . . . . . . . . . . . . . . . . . . . . . . . . . . . . . . . . . . . . . . . . . . 258 . . . . . . . . . . . . . . .
...
Book value per share - end of period . . . . . . . . . . . . . . . . . . . . . . . . . . . . . . . . . . . . . . . . . . . . . . . . . . . . . . . . . . . . . . . . . . . . . . . . . . . . . . $27.89. . . . . . . . . . . . . . .
.....
Return on average common stock equity . . . . . . . . . . . . . . . . . . . . . . . . . . . . . . . . . . . . . . . . . . . . . . . . . . . . . . . . . . . . . . . . . . . . . . . . . . . . . 12.0. .%. . . . . . . . . . . .
... .
Dividends declared as a percent of net income . . . . . . . . . . . . . . . . . . . . . . . . . . . . . . . . . . . . . . . . . . . . . . . . . . . . . . . . . . . . . . . . . . . . . . . . . . . . . % . . . . . . . . . . .
70.4 . .
Capitalization ratios (end of period):
Long-term debt . . . . . . . . . . . . . . . . . . . . . . . . . . . . . . . . . . . . . . . . . . . . . . . . . . . . . . . . . . . . . . . . . . . . . . . . . . . . . . . . . . . . . . . . . . . . . . . . 60.9 . %. . . . . . . . . . . .
.... .
Preferred securities of subsidiary trusts . . . . . . . . . . . . . . . . . . . . . . . . . . . . . . . . . . . . . . . . . . . . . . . . . . . . . . . . . . . . . . . . . . . . . . . . . . . . . . . .6.2 . . . . . . . . . . . . . . .
..
Preference and preferred stock . . . . . . . . . . . . . . . . . . . . . . . . . . . . . . . . . . . . . . . . . . . . . . . . . . . . . . . . . . . . . . . . . . . . . . . . . . . . . . . . . . . . . .0.9. . . . . . . . . . . . . . .
..
Common stock redeemable under equity
forward contracts, at redemption value. . . . . . . . . . . . . . . . . . . . . . . . . . . . . . . . . . . . . . . . . . . . . . . . . . . . . . . . . . . . . . . . . . . . . . . . . . . . . . . 0.6. . . . . . . . . . . . . . .
..
Common stock equity . . . . . . . . . . . . . . . . . . . . . . . . . . . . . . . . . . . . . . . . . . . . . . . . . . . . . . . . . . . . . . . . . . . . . . . . . . . . . . . . . . . . . . . . . . . . 30.1 . . . . . . . . . . . . . .
....
Total . . . . . . . . . . . . . . . . . . . . . . . . . . . . . . . . . . . . . . . . . . . . . . . . . . . . . . . . . . . . . . . . . . . . . . . . . . . . . . . . . . . . . . . . . . . . . . . . . . . . . . . %. . . . . . . . . . . .
100.0 .
Additional financial information is available on request to TXU Corp. at 1601 Bryan Street, Dallas, Texas 75201-3411
(214) 812-4600.
5. Page 1 of 1
TXU Corp.
The following tables identify the major components of the change in earnings for the quarter and twelve
months ended March 31, 2001.
Change in $ Change in $
(Millions) (Millions) Per Share
Three Months Ended Before Tax After Tax Impact EPS
Reported EPS 03/31/2000 $ 0.71
Europe Restructuring 3/00 50 0.18 0.18
Adjusted EPS 03/31/2000 $ 0.89
US Electric Segment:
Base Rate Revenue 60 36 0.13
Mitigation Effect (14) (9) (0.03)
Operation & Maintenance (22) (14) (0.05)
Total US Electric Segment 0.05
US Gas Segment 9 0.03
US Energy Segment (2) (0.01)
Total Europe Segment (33) (0.12)
Australia Segment (3) (0.01)
Corporate and Other (0.05)
Net Decrease in Common Shares 0.05 (0.06)
Adjusted EPS 03/31/2001 $ 0.83
Europe Restructuring (17) (0.07) (0.07)
Earnings Per Share 03/31/2001 $ 0.76
Change in $ Change in $
(Millions) (Millions) Per Share
Twelve Months Ended Before Tax After Tax Impact EPS
Reported EPS 03/31/2000 $ 3.60
Europe Restructuring and Acquisition 50 0.18
Australia Non-recurring (2Q 99) 17 0.06
US Electric Fuel Reconciliation (2Q 99) 31 0.11
Sale of Minority Interest in PrimeCo (145) (0.51) (0.16)
Adjusted EPS 03/31/2000 $ 3.44
US Electric Segment:
Base Rate Revenue:
Growth (approx 3.3%) 143 86 0.31
Weather 176 106 0.38
Mitigation Effect (180) (117) (0.43)
Other Operating Revenues 53 35 0.13
O&M (excl. 3rd party transmission) (81) (53) (0.19)
Third Party Transmission O&M (46) (30) (0.11)
Depreciation (18) (12) (0.04)
Interest 27 17 0.06
Change in Effective Tax Rate 0.08
Other (0.01)
Total US Electric Segment 0.18
US Gas Segment 8 0.02
US Energy Segment (51) (0.18)
Europe Segment (71) (0.25)
Australia Segment 25 0.09
Corporate and Other (35) (0.13)
Net Decrease in Common Shares 0.20 (0.07)
Adjusted EPS 03/31/2001 $ 3.37
Gain on Sale of TXU Processing 34 0.12 0.12
Earnings Per Share 03/31/2001 $ 3.49
These tables are furnished in response to your request for information concerning the Company and not in
connection with any sale or offer for sale of, or solicitation of an offer to buy, any securities.
6. TXU CORP. AND SUBSIDIARIES 1
US ELECTRIC SEGMENT
For the Periods Ended March 31, 2001
Statements of Consolidated Income
(Unaudited)
Three Months Ended Twelve Months Ended
March 31, March 31,
2001 2000 % Change 2001 2000 % Change
Millions of Dollars Millions of Dollars
25.4 *
Operating revenues . . . . . . . . . . . . . . . . . . . . . . . . . . . . . .... .. ..$. . . . 1,839 $
.. 1,363 34.9 $ 7,935 $ 6,330
Operating expenses
Energy purchased for resale and fuel consumed . . . . . .. .. . . .. . . . . .852. . . . . . . . 426 . . . . . . . . . . . . . . . . . . . .3,505
.. ... - . 2,062 70.0
Operation and maintenance . . . . . . . . . . . . . . . . . . . . . .. .. .. . . . . . . .342. . . . . . . . 321
.. . 6.5 1,506 1,381 9.1
(5.0) *
Depreciation and amortization . . . . . . . . . . . . . . . . . . . . .. ..... .. . . . . . 157 . . . . . . . 154
... 1.9 622 655
Taxes other than income . . . . . . . . . . . . . . . . . . . . . . . .. .. ... .. . . . . . 149 . . . . . . . .135.
... .. 10.4 569 548 3.8
Total operating expenses. . . . . . . . . . . . . . . . . . . . .... .. . . . . . 1,500 . . .
..... 1,036 44.8 6,202 4,646 33.5
Operating income . . . . . . . . . . . . . . . . . . . . . . . . . . . . . . . ..... .. .. . . . . .339 . . . . . . . 327. . .
... ... 3.7 1,733 1,684 2.9
Other income (deductions) -- net . . . . . . . . . . . . . . . . . . . .. .. . . . . . . . . . (1) . . . . .
.. (2) (50.0) 23 7 -
Income before interest, other charges
and income taxes . . . . . . . . . . . . . . . . . . . . . . . . . . . . . .... .. .. . . . . . .338 325 4.0 1,756 1,691 3.8
Interest income. . . . . . . . . . . . . . . . . . . . . . . . . . . . . . . . . .... .. .. . . . . . . . . - . . . . . . . . . 1 . . . .
. . - - 3 -
Interest expense and other charges
Interest . . . . . . . . . . . . . . . . . . . . . . . . . . . . . . . . . . . . . . . . .. .. . . . . . . . . . . . . . . . .97 . . . . . . -
97 .. 405 429 (5.6)
Distributions on TXU Electric Company obligated,
mandatorily redeemable, preferred securities of
subsidiary trusts holding solely junior subordinated
debentures of TXU Electric Company . . . . . . . . . . . . .. . . . . 17 17 - 69 68 1.5
Preferred stock dividends . . . . . . . . . . . . . . . . . . . . . . . .. .. ... .. . . . . . . . 2 . . . 3 (33.3) 9 10 (10.0)
Allowance for borrowed funds used during
construction and capitalized interest . . . . . . . . . . . . . .... .. .. . . . . . . . (3). . .. (2) 50.0 (10) (8) 25.0
Total interest expense and other charges . . . . . . . . .. .. .... . . . . 113 . . . . . . . .115. . . . . . . .(1.7)
... .. . 473 499 (5.2)
Income before income taxes . . . . . . . . . . . . . . . . . . . . . . . .. ... .. .. . . . . . 225 . . . . . . 211
... 6.6 1,283 1,195 7.4
Income tax expense. . . . . . . . . . . . . . . . . . . . . . . . . . . . . . .. ..... .. . . . . . . 68 . . . . . . . . . . . .
.. 66 3.0 388 380 2.1
Net income. . . . . . . . . . . . . . . . . . . . . . . . . . . . . . . . . . . . . .. ..... .. . . . . . 157 . $ . . . . . . . . . .
... . 145 8.3 $ 895 $ 815 9.8
$
* Effective July 1, 1999, the effects of mitigation of earnings in excess of the earnings cap were recorded as a reduction in revenues rather than as
depreciation expense as a result of Senate Bill 7.
Reference is made to the Notes to Financial Statements contained in the Annual Report on Form 10-K of TXU Corp. and
Subsidiaries (TXU Corp.), all Quarterly Reports to the Securities and Exchange Commission on Form 10-Q and on the following
page of this statement. This financial statement is furnished in response to your request for information concerning TXU Corp.
and not in connection with any sale or offer for sale of, or solicitation of an offer to buy, any securities.
7. TXU CORP. AND SUBSIDIARIES
US ELECTRIC SEGMENT
Consolidated Operating Statistics
Periods Ended March 31, 2001 and 2000
Three Months Twelve Months
2001 2000 % Change 2001 2000 % Change
Electric energy sales (gigawatt-hours)
Residential . . . . . . . . . . . . . . . . . . . . . . . . . . . . . . . . . . . . . . .. .. .. .. . . . . . . 9,529. . . . . . . .7,556 . . .
.... .... 26.1 40,697 35,725 13.9
Commercial . . . . . . . . . . . . . . . . . . . . . . . . . . . . . . . . . . . . . . . . . . . . . . . . . . . . . . . . . . .6,663. . . . .
7,151 .... 7.3 32,777 30,437 7.7
Industrial . . . . . . . . . . . . . . . . . . . . . . . . . . . . . . . . . . . . . . . .. .. .. .. . . . . . . .5,900. . . . . . . 5,908
.... ... (0.1) 25,284 25,200 0.3
Government and municipal . . . . . . . . . . . . . . . . . . . . . . . . . . . . . . . . . . . .1,502 . . . . . . . 1,438. . . .
.... .... 4.5 7,181 6,732 6.7
Total general business . . . . . . . . . . . . . . . . . . . . . . . . . . . . . . . . . . . . . . . . . . . . . . .21,565. . . . . . . . 11.7
24,082 ..... ... 105,939 98,094 8.0
Other electric utilities . . . . . . . . . . . . . . . . . . . . . . . . . . . . . . .. .. .. .. . . . . . . . . . . . . . . . . . . . .978 . . . . . . .(61.0)
381 ... .. 2,651 3,391 (21.8)
Total electric energy sales . . . . . . . . . . . . . . . . . . . . . . . .. .. .. .. . . . . . .24,463 . . . . . . 22,543. . . . . . . . . 8.5
..... ..... . 108,590 101,485 7.0
Customers (end of period & in thousands). . . . . . . . . . . . . . . . . .. .. .. .. . . . . . . . . 2,689 2,628 2.3
Operating revenues (millions of dollars)
Base rate revenues:
Residential . . . . . . . . . . . . . . . . . . . . . . . . . . . . . . . . . . . .. .. .. .. . . $ . . . . . 470 . . $. . .
. ... . 402 16.9 $ 2,300 $ 2,087 10.2
Commercial . . . . . . . . . . . . . . . . . . . . . . . . . . . . . . . . . ......... . . . . . . . . . . . . . . . . . . 313
316 1.0 1,442 1,367 5.5
Industrial . . . . . . . . . . . . . . . . . . . . . . . . . . . . . . . . . . . . .. .. .. .. . . . . . . . 127 136 (6.6) 607 588 3.2
Government and municipal . . . . . . . . . . . . . . . . . . . . . . . .. .. .. .. . . . . . . . . .70. . . 71 (1.4) 339 330 2.7
Total general business . . . . . . . . . . . . . . . . . . . . . . . . . . . . . . . . . . . 983 . . . . . . . . 922
... ... 6.6 4,688 4,372 7.2
Other electric utilities . . . . . . . . . . . . . . . . . . . . . . . . . . . . . . . . . . . . . . . .12 . . . . . . . . . 29
.. (58.6) 109 113 (3.5)
Total base rate revenues . . . . . . . . . . . . . . . . . . . . . .. .. .. .. . . . . . . . .995. . . . . . . . . 951 . . . . . . . . .4.6
.. ... 4,797 4,485 7.0
Fuel (including over/under-recovered) . . . . . . . . . . . . . . . . . .. .. .. .. . . . . . . . .780. . . . . . . . . 354. .
.. .. - 3,182 1,709 86.2
Transmission service . . . . . . . . . . . . . . . . . . . . . . . . . . . . . . .. .. .. .. . . . . . . . . .44. . . . . . . . . . 43 . . .
. .. 2.3 170 157 8.3
Other . . . . . . . . . . . . . . . . . . . . . . . . . . . . . . . . . . . . . . . . . . . . . . . . . . . . . . . 34 . . .
.. 15 - 110 71 54.9
Subtotal. . . . . . . . . . . . . . . . . . . . . . . . . . . . . . . . . . . . . . . 1,853 1,363 36.0 8,259 6,422 28.6
Earnings in excess of earnings cap . . . . . . . . . . . . . . . . . . . .. .. .. . (14) - - (324) (92) -
Total operating revenues . . . . . . . . . . . . . . . . . . . . . . . . . . . $ . . . .1,839 . . $ . . 1,363
. .... . 34.9 $ 7,935 $ 6,330 25.4
Fuel supply and purchased power data
Mix for net input:
Fuel for electric generation:
Gas/Oil . . . . . . . . . . . . . . . . . . . . . . . . . . . . . . . . . . . .. .. .. .. . . . . . . . 23.9 % 24.0 % (0.4) 32.9 % 32.9 % -
Lignite . . . . . . . . . . . . . . . . . . . . . . . . . . . . . . . . . . . . . . . . . . . . . . 38.6 . .
.... 43.2 (10.6) 35.2 38.7 (9.0)
Nuclear . . . . . . . . . . . . . . . . . . . . . . . . . . . . . . . . . . .. .. .. .. . . . . . . . .18.2
.. 20.4 (10.8) 15.9 16.5 (3.6)
Total fuel for electric generation . . . . . . . . . . . . .. .. .. .. . . . . . . . .80.7 ... 87.6 (7.9) 84.0 88.1 (4.7)
Purchased power . . . . . . . . . . . . . . . . . . . . . . . . . . . . . . .. .. .. .. . . . . . . . 19.3. . . . . . . . .
... 12.4 55.6 16.0 11.9 34.5
Total . . . . . . . . . . . . . . . . . . . . . . . . . . . . . . . . . . .. .. .. .. . . . . . . 100.0 %
.. 100.0 % - 100.0 % 100.0 % -
- - - - - -
Average fuel cost for electric generation per million btu . . . . .. .. .. .. . .$ 2.74 $ 1.47 86.4 $ 2.54 $ 1.59 59.7
Average fuel and purchased power cost (excluding
capacity charge) per kwh of net input . . . . . . . . . . . . . . . . .. .. .. .. . .$. 3.33 $ 1.72 93.6 $ 3.01 $ 1.84 63.6
Weather (average for service area)
Percent of normal:
Cooling degree days . . . . . . . . . . . . . . . . . . . . . . . . . . . . . . . . . . . . . .17.6%
. 254.3% (93.1) 117.3% 115.4% 1.6
Heating degree days . . . . . . . . . . . . . . . . . . . . . . . . . . . . . . . . . . . . . . . .
109.3% 63.4% 72.4 120.3% 64.5% 86.5
Additional financial information is available upon request to TXU Corp. at 1601 Bryan Street, Dallas, Texas 75201-3411.
(214) 812-4600
8. TXU CORP. AND SUBSIDIARIES 1
US GAS SEGMENT
For the Periods Ended March 31, 2001
Statements of Consolidated Income
(Unaudited)
Three Months Ended Twelve Months Ended
March 31, March 31,
2001 2000 % Change 2001 2000 % Change
Millions of Dollars Millions of Dollars
Operating revenues . . . . . . . . . . . . . . . . . . . . . . . . . . . . . . . . . . . . . .$
$ 684 . 332 - $ 1,459 $ 901 61.9
Operating expenses
Energy purchased for resale . . . . . . . . . . . . . . . . . .. .. . . . . 495 . . . . . . . .148. . . . . . . . -. . . . .
... .. 951 373 -
Operation and maintenance . . . . . . . . . . . . . . . . . . .. .. . . . . . 67 . . . . . . . . .78. . .
.. . (14.1) 245 301 (18.6)
Depreciation and other amortization. . . . . . . . . . . . . . . . . . . 16 . . . . . . . . . 15 . . . . . . .
.. .. 6.7 62 62 -
Goodwill amortization. . . . . . . . . . . . . . . . . . . . . . . . . . . . . 5 6 (16.7) 21 21 -
Taxes other than income . . . . . . . . . . . . . . . . . . . . . . . . . . . . . . . . . . . . . . 15 . . . . . 46.7
22 .. 70 58 20.7
Total operating expenses. . . . . . . . . . . . . . . . . . . . . . . . . . . . . . . 262 . .
605 ... - 1,349 815 65.5
Operating income. . . . . . . . . . . . . . . . . . . . . . . . . . . . . . . . . . . . . . .
79 70 12.9 110 86 27.9
-
Other income (deductions) -- net . . . . . . . . . . . . . . . . . . . . . . . . . . . . . . . . . . . . .
1 (1) - 63 12 -
Income before interest, other charges
and income taxes . . . . . . . . . . . . . . . . . . . . . . . . . . .. .. . . . . . 80 . . . .
.. 69 15.9 173 98 76.5
Interest income. . . . . . . . . . . . . . . . . . . . . . . . . . . . . . . . . . . . . . 4 . .
. - - 15 1 -
Interest expense and other charges
Interest. . . . . . . . . . . . . . . . . . . . . . . . . . . . . . . . . . . . . . . . . . . . . . . . . . . . 15 . . . . . . . . . . . .
17 .. 13.3 72 62 16.1
Distributions on TXU Gas Company obligated,
mandatorily redeemable, preferred securities of
subsidiary trust holding solely junior subordinated
debentures of TXU Gas Company. . . . . . . . . . . . . . . . . . . . 2 . . 3 (33.3) 9 11 (18.2)
Preferred stock dividends. . . . . . . . . . . . . . . . . . . . . . . . . . . . . . . . . . . . . 1
1 - 4 4 -
Total interest expense and other charges. . .. .. . . . . . 20 . . . . . . . . .19. . . . . . . 5.3. . . . . . . . 85
.. . .. . 77 10.4
Income before income taxes. . . . . . . . . . . . . . . . . . . . .. .. . . . . . 64 . . . . . . . . .50 . .
.. .. 28.0 103 22 -
Income tax expense . . . . . . . . . . . . . . . . . . . . . . . . . . .. .. . . . . . 25 . . . . . . . . .20. . . . . . 25.0
.. . .. 45 6 -
Net income . . . . . . . . . . . . . . . . . . . . . . . . . . . . . . . . ..... $ . . . . 39 . . $ . . . . . .30. . . . . . 30.0
. .. . . .. $ 58 $ 16 -
Reference is made to the Notes to Financial Statements contained in the Annual Report on Form 10-K of TXU Corp. and Subsidiaries (TXU
Corp.), all Quarterly Reports to the Securities and Exchange Commission on Form 10-Q and on the following page of this statement. This
financial statement is furnished in response to your request for information concerning TXU Corp. and not in connection with any sale or
offer for sale of, or solicitation of an offer to buy, any securities.
9. TXU CORP. AND SUBSIDIARIES
US GAS SEGMENT
Consolidated Operating Statistics
Periods Ended March 31, 2001 and 2000
Three Months Twelve Months
2001 2000 % Change 2001 2000 % Change
Sales volumes
Gas distribution (billion cubic feet):
Residential . . . . . . . . . . . . . . . . . . . . . . . . . . . . . .. .. . . . . . . . . .46. . . . .
. 30 53.3 99 66 50.0
Commercial . . . . . . . . . . . . . . . . . . . . . . . . . . . . . . . . . . . . . . . 25 . . . . .
.. 18 38.9 58 44 31.8
Industrial and electric generation . . . . . . . . . . . . . . . . . . . . . . . .3 . . . . . 1 - 6 4 50.0
Total gas distribution . . . . . . . . . . . . . . . . . . .. .. .. . . . . . . . . 74 . . . .
.. 49 51.0 163 114 43.0
Pipeline transportation (billion cubic feet) . . . . . . . . ....... . . . . . . . . . . .
158 141 12.1 618 552 12.0
Gas distribution customers (end of period & in thousands) 1,444 1,414 2.1
Operating revenues (millions of dollars)
Gas distribution:
Residential . . . . . . . . . . . . . . . . . . . . . . . . . . . . . .. .. . . $ . . . . .420. . .$. .
. .. 176 - $ 860 $ 415 -
Commercial . . . . . . . . . . . . . . . . . . . . . . . . . . . . . . . . . . . . . . 215 . . . . .
... 89 - 444 217 -
Industrial and electric generation . . . . . . . . . . . . . . . . . . . . . . .26 . . . . .. 6 - 48 20 -
Total gas distribution . . . . . . . . . . . . . . . . . . .. .. .. . . . . . . . 661 . . . .
... 271 - 1,352 652 -
Pipeline transportation . . . . . . . . . . . . . . . . . . . . . . . . . . . . . . . . . .38. . . . . .
. 35 8.6 126 113 11.5
Other revenues, net of intra-segment eliminations . . .. .. .. . . . . . . .(15) . . . . . . . .26 . . . . . . . -
... .. (19) 136 -
Total operating revenues . . . . . . . . . . . . . . . . . . . . . . . . . 684 . . $ . . 332
$ ... . - $ 1,459 $ 901 61.9
Weather (average for service area)
Percent of normal:
Heating degree days . . . . . . . . . . . . . . . . . . . . . .. .. .. . . . . 109.3% 63.4% 72.4 120.3% 64.5% 86.5
Additional financial information is available upon request to TXU Corp. at 1601 Bryan Street, Dallas, Texas 75201-3411.
(214) 812-4600
10. TXU CORP. AND SUBSIDIARIES 1
US ENERGY SEGMENT
For the Periods Ended March 31, 2001
Statements of Operations
(Unaudited)
Three Months Ended Twelve Months Ended
March 31, March 31,
2001 2000 % Change 2001 2000 % Change
Millions of Dollars Millions of Dollars
Operating revenues . . . . . . . . . . . . . . . . . . . . . . . . . . . . . . . . . . .. .. $ .. . 2,282
.. $ 1,038 - $ 6,752 $ 3,300 -
Operating expenses
Energy purchased for resale . . . . . . . . . . . . . . . . . . . . . . . . .. .. .. .. . . 2,236. . . . . . 1,013. . . . . . . . . . . . . . . . .6,653
.... .... - .. 3,190 -
Operation and maintenance . . . . . . . . . . . . . . . . . . . . . . . . . .. .. .. .. . . . . 55 . . . . . . . 33
.. 66.7 209 152 37.5
Depreciation and amortization . . . . . . . . . . . . . . . . . . . . . . . . . . . . . . . . 1 . . . . . . . . . 1 . . . . . . -
. . 5 7 (28.6)
Taxes other than income . . . . . . . . . . . . . . . . . . . . . . . . . . . .. .. .. .. . . . . .2 . . . . . . . . .1. . . . . . . . .-
. 5 4 25.0
Total operating expenses . . . . . . . . . . . . . . . . . . . . . . . . . . . . . 2,294. . .
.... 1,048 - 6,872 3,353 -
Operating loss. . . . . . . . . . . . . . . . . . . . . . . . . . . . . . . . . . . . . . .. . . . (12) (10) 20.0 (120) (53) -
Other income (deductions) -- net . . . . . . . . . . . . . . . . . . . . . . . . .. .. . . . . . . . . . . .
1 1 - - 5 -
Loss before interest and income taxes. . . . . . . . . . . . . . . . . . . . .. .. .. .. . . . . . .
(11) (9) 22.2 (120) (48) -
Interest Income . . . . . . . . . . . . . . . . . . . . . . . . . . . . . . . . . . . . . . . . . . . . . . 3 . . . . . . . . . 1
. . - 9 2 -
Interest charges. . . . . . . . . . . . . . . . . . . . . . . . . . . . . . . . . . . . . . . . . 9 4 - 29 13 -
Loss before income taxes. . . . . . . . . . . . . . . . . . . . . . . . . . . . . ......... . . . (17) . . . . . . . (12)
... .. 41.7 (140) (59) -
Income tax benefit . . . . . . . . . . . . . . . . . . . . . . . . . . . . . . . . . . . .. .. .. .. . . . . (7). . . . . . . . (4)
.. 75.0 (50) (20) -
Net loss . . . . . . . . . . . . . . . . . . . . . . . . . . . . . . . . . . . . . . . . . . . .. .. $ .. . . . . . . . . $ . . . . (8)
.. (10) . 25.0 $ (90) $ (39) -
Operating Statistics
Three Months Ended Twelve Months Ended
March 31, March 31,
2001 2000 % Change 2001 2000 % Change
Energy trading and marketing sales volumes
Gas (billion cubic feet) . . . . . . . . . . . . . . . . . . . . . . . . . . . . . ......... . . .272 . . . . . 320
... (15.0) 1,194 1,071 11.5
Electric (gigawatt-hours). . . . . . . . . . . . . . . . . . . . . . . . . . . . ......... . 5,359 . . . . . 3,704
..... .. 44.7 23,572 9,191 -
Operating revenues (millions of dollars)
Energy trading and marketing. . . . . . . . . . . . . . . . . . . . . . . . .. .. .$ . . . 2,270
.. . $ 1,019 - $ 6,674 $ 3,202 -
Other. . . . . . . . . . . . . . . . . . . . . . . . . . . . . . . . . . . . . . . . . . . . . . . 12 19 (36.8) 78 98 (20.4)
Total operating revenues $ 2,282 $ 1,038 - $ 6,752 $ 3,300 -
Reference is made to the Notes to Financial Statements contained in the Annual Report on Form 10-K of TXU Corp. and Subsidiaries (TXU Corp.) and
all Quarterly Reports to the Securities and Exchange Commission on Form 10-Q. This financial statement is furnished in response to your request
for information concerning TXU Corp. and not in connection with any sale or offer for sale of, or solicitation of an offer to buy, any securities.
Additional financial information is available upon request to TXU Corp. at 1601 Bryan Street, Dallas, Texas 75201-3411.
(214) 812-4600
11. TXU CORP. AND SUBSIDIARIES 1
EUROPE SEGMENT
For the Periods Ended March 31, 2001
Statements of Consolidated Income
(Unaudited)
Three Months Ended Twelve Months Ended
March 31, March 31,
2001 2000 % Change 2001 2000 % Change
Millions of U.S. Dollars Millions of U.S. Dollars
Operating revenues . . . . . . . . . . . . . . . . . . . . . . . . . . . . . . . . . $ .
. 3,365 $ 1,849 82.0 $ 8,560 $ 6,023 42.1
Operating expenses
Energy purchased for resale and fuel consumed . . . . . . .. .. .. .. . . 2,681 . . ..... 1,224 - 6,384 3,564 79.1
Operation and maintenance . . . . . . . . . . . . . . . . . . . . . . . .. .. .. .. . . . 314 ... 284 10.6 1,080 1,187 (9.0)
Depreciation and other amortization. . . . . . . . . . . . . . . . . .. .. .. .. . . . . . . . . .66 70 (5.7) 237 287 (17.4)
Goodwill amortization . . . . . . . . . . . . . . . . . . . . . . . . . . . . .. .. .. .. . . . . 45 36 25.0 163 143 14.0
Total operating expenses . . . . . . . . . . . . . . . . . . . . . . . . . . . . . 3,106
.. 1,614 92.4 7,864 5,181 51.8
Operating income. . . . . . . . . . . . . . . . . . . . . . . . . . . . . . . . . . . . . . . 259 235 10.2 696 842 (17.3)
Other income (deductions) -- net. . . . . . . . . . . . . . . . . . . . . . . . 2 (1) - 124 10 -
Income before interest and income taxes. . . . . . . . . . . . . . .... .. .. . . . . 261 . . . . .
... 234 11.5 820 852 (3.8)
Interest income. . . . . . . . . . . . . . . . . . . . . . . . . . . . . . . . . . . . . . . 18 26 (30.8) 82 104 (21.2)
Interest expense and other charges. . . . . . . . . . . . . . . . . . . .. .. .. .. . . . . . . . . . . . . . . 144
158 . 9.7 588 566 3.9
Income before income taxes. . . . . . . . . . . . . . . . . . . . . . . . ......... . . . 121 . . . . . . . 116
... 4.3 314 390 (19.5)
Income tax expense . . . . . . . . . . . . . . . . . . . . . . . . . . . . . . . .. .. .. .. . . . . . . . . . . . . . . . 49 .
54 .. 10.2 99 154 (35.7)
Net income . . . . . . . . . . . . . . . . . . . . . . . . . . . . . . . . . . . . . . .. ..$ .. . . . . . . . . . $ . . . . . 67.
.. 67 . .. - $ 215 $ 236 (8.9)
Reference is made to the Notes to Financial Statements contained in the Annual Report on Form 10-K of TXU Corp. and Subsidiaries (TXU Corp.),
all Quarterly Reports to the Securities and Exchange Commission on Form 10-Q and on the following page of this statement. This financial
statement is furnished in response to your request for information concerning TXU Corp. and not in connection with any sale or offer for sale of, or
solicitation of an offer to buy, any securities.
12. TXU CORP. AND SUBSIDIARIES
EUROPE SEGMENT
Consolidated Operating Statistics
Periods Ended March 31, 2001 and 2000
Three Months Twelve Months
2001 2000 % Change 2001 2000 % Change
SALES VOLUMES
Electric (gigawatt-hours):
Industrial and commercial . . . . . . . . . . . . . . . . . . . . . . . . . . . ....... . . 6,324 3,589 76.2 25,321 18,020 40.5
Residential . . . . . . . . . . . . . . . . . . . . . . . . . . . . . . . . . . . . . . . .. .. .. . . . . . 6,705 4,574 46.6 19,395 16,124 20.3
Total electric . . . . . . . . . . . . . . . . . . . . . . . . . . . . . . . . . . . . . . . . . 13,029 8,163 59.6 44,716 34,144 31.0
Units distributed (gigawatt-hours) . . . . . . . . . . . . . . . . . . . . . . . . . .. .. .. . . . 9,904 9,204 7.6 34,093 33,092 3.0
Gas (billion cubic feet):
Industrial and commercial . . . . . . . . . . . . . . . . . . . . . . . . . . . ....... . . 23 19 21.1 61 64 (4.7)
Residential . . . . . . . . . . . . . . . . . . . . . . . . . . . . . . . . . . . . . . . .. .. .. . . . . . 41 19 - 81 53 52.8
Total gas . . . . . . . . . . . . . . . . . . . . . . . . . . . . . . . . . . . . . . .. .. .. 64 38 68.4 142 117 21.4
Wholesale energy sales:
Electricity generated and sold to the Pool (gigawatt-hours) . . . . . 43,750 24,435 79.0 119,447 79,320 50.6
Gas (billion cubic feet) . . . . . . . . . . . . . . . . . . . . . . . . . . . . . . .. .. .. . . . . . . . . .379. .
.. 186 - 1,193 520 -
CUSTOMERS (end of period & in thousands)
Electric . . . . . . . . . . . . . . . . . . . . . . . . . . . . . . . . . . . . . . . . . . . . . .. .. .. . . . . 4,484 2,835 58.2
Gas . . . . . . . . . . . . . . . . . . . . . . . . . . . . . . . . . . . . . . . . . . . . . . . . .. .. .. . . . 1,224 768 59.4
OPERATING REVENUES (millions of U.S. dollars)
Electric:
Industrial and commercial . . . . . . . . . . . . . . . . . . . . . . . . . . . ....... .$. 353 $ 251 40.6 $ 1,348 $ 1,189 13.4
Residential . . . . . . . . . . . . . . . . . . . . . . . . . . . . . . . . . . . . . . . .. .. .. . . . . . 592 419 41.3 1,723 1,592 8.2
Total electric operating revenues . . . . . . . . . . . . . . . . . . . . . . . . . . . . . . 945 . . . . . . . . 670
... 41.0 3,071 2,781 10.4
Distribution . . . . . . . . . . . . . . . . . . . . . . . . . . . . . . . . . . . . . . . . . . . . . . . . . . . . 127 189 (32.8) 472 657 (28.2)
Gas:
Industrial and commercial . . . . . . . . . . . . . . . . . . . . . . . . . . . ....... . . 90 65 38.5 215 211 1.9
Residential . . . . . . . . . . . . . . . . . . . . . . . . . . . . . . . . . . . . . . . .. .. .. . . . . . 181 119 52.1 402 342 17.5
Total gas operating revenues . . . . . . . . . . . . . . . . . . . . . . .. .. .. . . . . . . . . 271 . . . . .
... 184 47.3 617 553 11.6
Wholesale energy sales . . . . . . . . . . . . . . . . . . . . . . . . . . . . . . . . . . . . . . . . . .1,823 844 - 4,302 2,305 86.6
Other . . . . . . . . . . . . . . . . . . . . . . . . . . . . . . . . . . . . . . . . . . . . . . . .. .. .. . . 276 84 - 383 223 71.7
Less intercompany revenues . . . . . . . . . . . . . . . . . . . . . . . . . . . . . . . . . . . (77) (122) (36.9) (285) (496) (42.5)
Total operating revenues . . . . . . . . . . . . . . . . . . . . . . . . . . . . . $. . . 3,365 $ 1,849 82.0 $ 8,560 $ 6,023 42.1
Additional financial information is available upon request to TXU Corp. at 1601 Bryan Street, Dallas, Texas 75201-3411.
(214) 812-4600